BeaumarisBlack RockCheltenhamHamptonHampton EastHighettMentoneSandr<strong>in</strong>ghamTotal<strong>Feasibility</strong> <strong>Study</strong> ContextDemographic DataPopulationOver <strong>the</strong> last ten years,population growth <strong>in</strong> <strong>the</strong>Sandr<strong>in</strong>gham catchmentarea has been lowerthan <strong>the</strong> Melbourne andState averages.This section of <strong>the</strong> study draws upon demographic data from a number ofsources, namely: Spatial Vision – Demographic <strong>Study</strong> Sandr<strong>in</strong>gham College;Australian Bureau of Statistics – Census Data;City of Bayside – forecast id;K<strong>in</strong>gston City Council – forecast id; andDepartment of Education and Early Childhood Development (DEECD)The follow<strong>in</strong>g section represents data which is purely statistical <strong>in</strong> natureand has been gleaned specifically from <strong>the</strong> Demographic <strong>Study</strong>:Sandr<strong>in</strong>gham College prepared by Spatial Vision <strong>in</strong> December of 2012(based on data sets from <strong>the</strong> 2011 Australian Bureau of Statistics (ABS),Department of Plann<strong>in</strong>g and Community Development (DPCD), andDEECD) and data provided directly by <strong>the</strong> Department of Education andEarly Childhood Development.HistoricalVictorian population growth <strong>in</strong> <strong>the</strong> ten years from 2001 to 2011 has<strong>in</strong>creased by 8.5%, with Melbourne’s population <strong>in</strong>creas<strong>in</strong>g by 9.7% 2Population growth <strong>in</strong> <strong>the</strong> Sandr<strong>in</strong>gham catchment area 3 over this ten yearperiod shows a total <strong>in</strong>crease of 7.2% (3,957 people). Table 3 belowshows <strong>the</strong> actual numbers by suburb and <strong>the</strong> five and ten year percentage<strong>in</strong>creases 4 .Table 3: Data Source Demographic <strong>Study</strong>: Sandr<strong>in</strong>gham College, Spatial Vision,September 2012Total Population200120062011Growth2001 to 2006Growth2001 - 201112,260 5,599 3,555 8,015 4,389 7,192 5,389 8,295 54,69412,432 5,786 3,662 8,203 4,466 7,235 5,512 8,687 55,98312,790 6,051 3,717 8,537 4,788 7,796 5,700 9,272 58,6511.4% 3.3% 3.0% 2.3% 1.8% 0.6% 2.3% 4.7% 2.4%4.3% 8.1% 4.6% 6.5% 9.1% 8.4% 5.8% 11.8% 7.2%The 2016 forecast population for <strong>the</strong> Sandr<strong>in</strong>gham catchment area ispredicted to be much <strong>the</strong> same as <strong>the</strong> 2011 (58,621). In 2021 it isanticipated to have risen by 5.69% (61,956) and at 2026 it is expected tohave risen by 7.6% over <strong>the</strong> base year 5 (63,086).2 http://www.abs.gov.au/websitedbs/censushome.nsf/home/data?opendocument&navpos=2003 Sandr<strong>in</strong>gham area is def<strong>in</strong>ed as Beaumaris, Black Rock, Cheltenham, Hampton, HamptonEast, Highett, Mentone and Sandr<strong>in</strong>gham.4 P24 Demographic <strong>Study</strong>: Sandr<strong>in</strong>gham College, Spatial Vision, September 20125 Base year of 2011Page 10 of 22
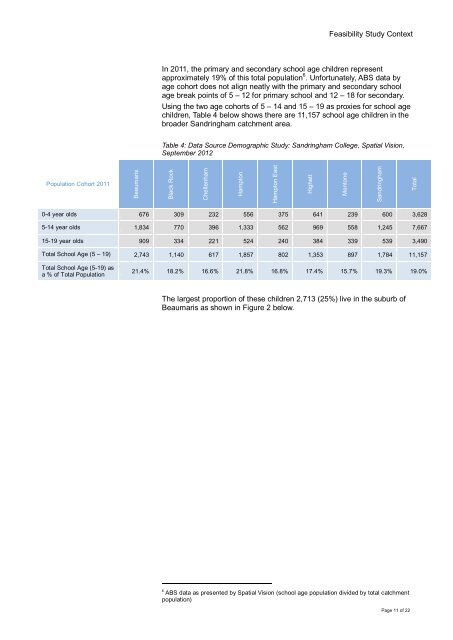
BeaumarisBlack RockCheltenhamHamptonHampton EastHighettMentoneSandr<strong>in</strong>ghamTotal<strong>Feasibility</strong> <strong>Study</strong> ContextIn 2011, <strong>the</strong> primary and <strong>secondary</strong> school age children representapproximately 19% of this total population 6 . Unfortunately, ABS data byage cohort does not align neatly with <strong>the</strong> primary and <strong>secondary</strong> schoolage break po<strong>in</strong>ts of 5 – 12 for primary school and 12 – 18 for <strong>secondary</strong>.Us<strong>in</strong>g <strong>the</strong> two age cohorts of 5 – 14 and 15 – 19 as proxies for school agechildren, Table 4 below shows <strong>the</strong>re are 11,157 school age children <strong>in</strong> <strong>the</strong><strong>broader</strong> Sandr<strong>in</strong>gham catchment area.Table 4: Data Source Demographic <strong>Study</strong>: Sandr<strong>in</strong>gham College, Spatial Vision,September 2012Population Cohort 20110-4 year olds 676 309 232 556 375 641 239 600 3,6285-14 year olds 1,834 770 396 1,333 562 969 558 1,245 7,66715-19 year olds 909 334 221 524 240 384 339 539 3,490Total School Age (5 – 19) 2,743 1,140 617 1,857 802 1,353 897 1,784 11,157Total School Age (5-19) asa % of Total Population21.4% 18.2% 16.6% 21.8% 16.8% 17.4% 15.7% 19.3% 19.0%The largest proportion of <strong>the</strong>se children 2,713 (25%) live <strong>in</strong> <strong>the</strong> suburb ofBeaumaris as shown <strong>in</strong> Figure 2 below.6 ABS data as presented by Spatial Vision (school age population divided by total catchmentpopulation)Page 11 of 22