Emma Hawkins - ALCAS Conference 2013
Emma Hawkins - ALCAS Conference 2013
Emma Hawkins - ALCAS Conference 2013
- No tags were found...

You also want an ePaper? Increase the reach of your titles
YUMPU automatically turns print PDFs into web optimized ePapers that Google loves.
Transferring LCA information into aCO2 Calculation and Design ToolFor:7 th Annual <strong>ALCAS</strong> <strong>Conference</strong>Delivered: 10.03.2011
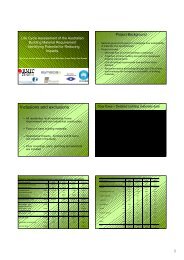
Table Base products Life Cycle AssessmentCalculator: Data EntryCalculator: ResultsBenefitsPossible Extensions
Table base 1:Powdercoated steel legs and railAluminium horns and feetManufactured in AsiaTable base 2a:Powdercoated steel legs and railAluminium horns and feetManufactured in AsiaTable base 2b:Chrome coated steel legs and railAluminium horns and feetManufactured in Asia
The most significant life cycle stage was the MANUFACTURE stage, primarily associatedwith STEEL and ALUMINIUM.300250200kg CO 2 e150100500ManufactureFinishing &PackagingTransport toSydneyTE ProcessingResults have been altered to protect confidentiality)Distributionto ConsumersInstallationUse &maintenanceDisposal
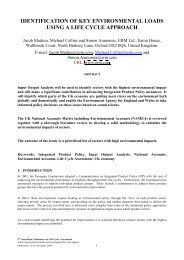
Based in Excel (macros)Two Data Entry Sheets:1. Annual Report2. Product Sheets (x 36)Data entered into green cellsResults shown on Data entry sheets and charts
CO 2 of individual products (total and by lifecycle stage)CO 2 new variations (total and by lifecycle stage)Annual CO 2 for product lineCarbon offset cost for individual productsCarbon offset cost for new variationsCarbon offset cost for product line/s
Constant emission factors(not dependent on weight)Individual parts, country of manufacture,material, finishing process and weight.Emission factors
VARIABLES:Table parts(legs, beams etc)CONSTANTS:Transport, electricity,installation, packaging,disposal
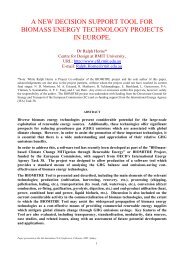
PowdercoatedproductsChromeproductsNew models
2Product Line Annual Carbon Footprint(kg CO 2 e / yr)2000180016001400120010008006004002000a a2 b2 c2 d2 e2 f2 g2 h2 i2 j2 k2 l2 m,2 n2 o2 p2 q2 r2 s2 t2 u2 v2 w2 x2 y2 z2 bb1 dd1 ff1 hh1
Impacts of materials and product life cyclestagesTest different combinations see impactsimmediately
Carbon footprint for range of productsCarbon reduction improvements over timeCarbon reduction integration into designprocess
CO 2 reduction potentialMost and least CO 2 intensive product linescarbon off-setting cost predictionsAnnual Sustainability and CSR Reports
Calculator could incorporate entire product rangeSingle product page simplify worksheetUser could select different:SuppliersEnergy mix, Raw materials, Processes, Transport distancesDisposal methodsProduct stewardship programTransport methods
Questions?Thank you