2005 Annual Report - Erie County Water Authority
2005 Annual Report - Erie County Water Authority
2005 Annual Report - Erie County Water Authority

Create successful ePaper yourself
Turn your PDF publications into a flip-book with our unique Google optimized e-Paper software.
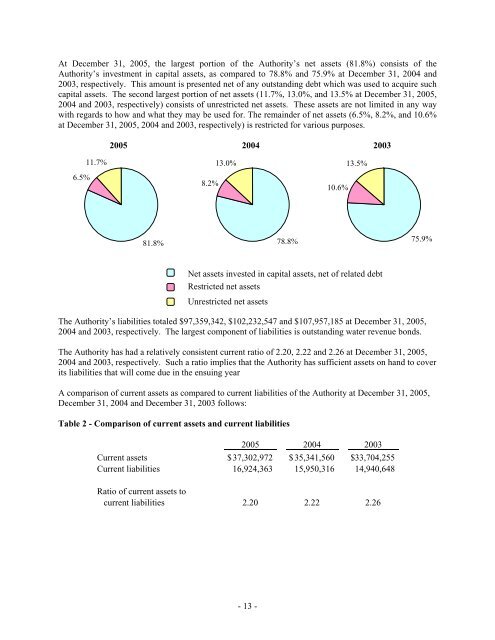
At December 31, <strong>2005</strong>, the largest portion of the <strong>Authority</strong>’s net assets (81.8%) consists of the<strong>Authority</strong>’s investment in capital assets, as compared to 78.8% and 75.9% at December 31, 2004 and2003, respectively. This amount is presented net of any outstanding debt which was used to acquire suchcapital assets. The second largest portion of net assets (11.7%, 13.0%, and 13.5% at December 31, <strong>2005</strong>,2004 and 2003, respectively) consists of unrestricted net assets. These assets are not limited in any waywith regards to how and what they may be used for. The remainder of net assets (6.5%, 8.2%, and 10.6%at December 31, <strong>2005</strong>, 2004 and 2003, respectively) is restricted for various purposes.<strong>2005</strong> 2004 20036.5%11.7%8.2%13.0%10.6%13.5%81.8%78.8%75.9%Net assets invested in capital assets, net of related debtRestricted net assetsUnrestricted net assetsThe <strong>Authority</strong>’s liabilities totaled $97,359,342, $102,232,547 and $107,957,185 at December 31, <strong>2005</strong>,2004 and 2003, respectively. The largest component of liabilities is outstanding water revenue bonds.The <strong>Authority</strong> has had a relatively consistent current ratio of 2.20, 2.22 and 2.26 at December 31, <strong>2005</strong>,2004 and 2003, respectively. Such a ratio implies that the <strong>Authority</strong> has sufficient assets on hand to coverits liabilities that will come due in the ensuing yearA comparison of current assets as compared to current liabilities of the <strong>Authority</strong> at December 31, <strong>2005</strong>,December 31, 2004 and December 31, 2003 follows:Table 2 - Comparison of current assets and current liabilities<strong>2005</strong> 2004 2003Current assets $ 37,302,972 $ 35,341,560 $ 33,704,255Current liabilities 16,924,363 15,950,316 14,940,648Ratio of current assets tocurrent liabilities 2.20 2.22 2.26- 13 -