2005 Annual Report - Erie County Water Authority
2005 Annual Report - Erie County Water Authority
2005 Annual Report - Erie County Water Authority

You also want an ePaper? Increase the reach of your titles
YUMPU automatically turns print PDFs into web optimized ePapers that Google loves.
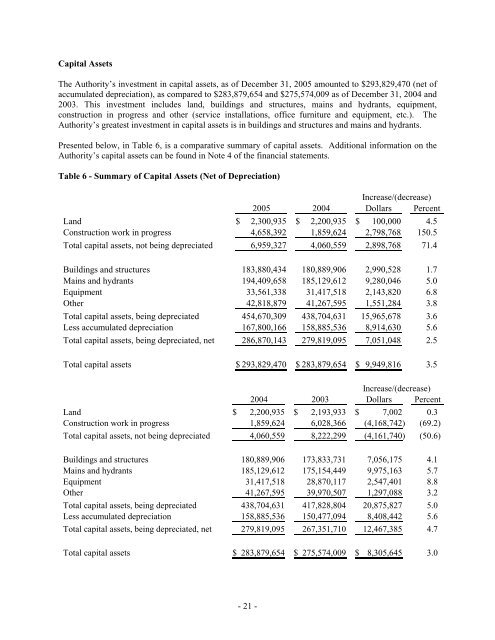
Capital AssetsThe <strong>Authority</strong>’s investment in capital assets, as of December 31, <strong>2005</strong> amounted to $293,829,470 (net ofaccumulated depreciation), as compared to $283,879,654 and $275,574,009 as of December 31, 2004 and2003. This investment includes land, buildings and structures, mains and hydrants, equipment,construction in progress and other (service installations, office furniture and equipment, etc.). The<strong>Authority</strong>’s greatest investment in capital assets is in buildings and structures and mains and hydrants.Presented below, in Table 6, is a comparative summary of capital assets. Additional information on the<strong>Authority</strong>’s capital assets can be found in Note 4 of the financial statements.Table 6 - Summary of Capital Assets (Net of Depreciation)Increase/(decrease)<strong>2005</strong> 2004 Dollars PercentLand $ 2,300,935 $ 2,200,935 $ 100,000 4.5Construction work in progress 4,658,392 1,859,624 2,798,768 150.5Total capital assets, not being depreciated 6,959,327 4,060,559 2,898,768 71.4Buildings and structures 183,880,434 180,889,906 2,990,528 1.7Mains and hydrants 194,409,658 185,129,612 9,280,046 5.0Equipment 33,561,338 31,417,518 2,143,820 6.8Other 42,818,879 41,267,595 1,551,284 3.8Total capital assets, being depreciated 454,670,309 438,704,631 15,965,678 3.6Less accumulated depreciation 167,800,166 158,885,536 8,914,630 5.6Total capital assets, being depreciated, net 286,870,143 279,819,095 7,051,048 2.5Total capital assets $ 293,829,470 $ 283,879,654 $ 9,949,816 3.5Increase/(decrease)2004 2003 Dollars PercentLand $ 2,200,935 $ 2,193,933 $ 7,002 0.3Construction work in progress 1,859,624 6,028,366 (4,168,742) (69.2)Total capital assets, not being depreciated 4,060,559 8,222,299 (4,161,740) (50.6)Buildings and structures 180,889,906 173,833,731 7,056,175 4.1Mains and hydrants 185,129,612 175,154,449 9,975,163 5.7Equipment 31,417,518 28,870,117 2,547,401 8.8Other 41,267,595 39,970,507 1,297,088 3.2Total capital assets, being depreciated 438,704,631 417,828,804 20,875,827 5.0Less accumulated depreciation 158,885,536 150,477,094 8,408,442 5.6Total capital assets, being depreciated, net 279,819,095 267,351,710 12,467,385 4.7Total capital assets $ 283,879,654 $ 275,574,009 $ 8,305,645 3.0- 21 -