Sustainability Report 2012 - Transnet
Sustainability Report 2012 - Transnet
Sustainability Report 2012 - Transnet
- No tags were found...

You also want an ePaper? Increase the reach of your titles
YUMPU automatically turns print PDFs into web optimized ePapers that Google loves.
Port of Durban2
<strong>Sustainability</strong> frameworkOur <strong>Sustainability</strong> Framework reflects what <strong>Transnet</strong> is: a wholly SOC whose financialdividends are re-invested in the business, and whose Shareholder, represented by theMinister of Public Enterprises, mandates us to play a powerful developmental role inthe growth and transformation of South Africa. In alignment with the annualShareholder Compact which <strong>Transnet</strong> signs with the Minister, we have defined our long-termdevelopmental mandate into specific sets of economic, social and environmental dividends,which together constitute the <strong>Transnet</strong> <strong>Sustainability</strong> Framework. This is how <strong>Transnet</strong>understands and targets sustainability in all we do.The <strong>Sustainability</strong> Framework enables us to drive and monitor actual performance in specific areas, to reportsystematically to our stakeholders, and to plan ahead based on an honest analysis of facts.Because this is the start of <strong>Transnet</strong>’s proactive sustainability performance drive, we are building a sustainabilityintelligence system to collate and analyse the necessary data for each set of dividends. This is no small task butis necessary for both management and accountability. As our sustainability intelligence matures in the comingyears, we will begin to introduce sustainability assurance audits, raising the bar on our determination todemonstrate the actual impact of our business on the economy, society and the environment.The SR <strong>2012</strong> is organised to reflect the economic, social and environmental dividends that <strong>Transnet</strong> hasdelivered in <strong>2012</strong> and to show where our sustainability efforts are now focused.ECONOMICDIVIDENDSCost-effective freightlogistics infrastructureahead of demand.Reliable and efficient rail,port and pipeline services.Skilled human resourcesaligned to infrastructureand services.Local supplier industrydevelopment.Rural development.Regional integration.A financially stable business,able to raise and service debt,reinvest revenues and pursueagreements with privateparties to optimiseinvestment and services.SOCIALDIVIDENDSGood governance,accountability andtransparency.Zero tolerance of fraud andcorruption.A representative workforce.Safety.Staff wellness.Broad-based black economicempowerment.Corporate social investment.Community benefits.Proactive stakeholderengagement.ENVIRONMENTALDIVIDENDSModal shift from road-to-rail,lowering South Africa’scarbon emissions.Energy efficiency.Climate change mitigation.Climate change adaptation.Water use efficiency.Waste managementoptimisation.Biodiversity enhancement.8
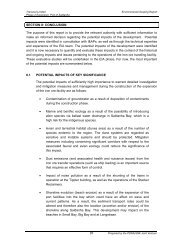
NATIONAL PORTSAUTHORITYSALDANHAPORT LIMITS| CAPE TOWN | MOSSEL BAY |PORT ELIZABETHBREAKWATERDREDGINGSERVICESTUGSERVICESPILOTSERVICESPORTCONTROLTOWERBERTHINGSERVICESNGQURA | EAST LONDONPORTLIMITSHARBOURMASTER| DURBANPORT LIMITS| RICHARDS BAY<strong>Sustainability</strong> performance: Operating divisions Social Financial dividends overview planLIGHTHOUSESAUTOMOTIVECONTAINERBULKMULTI-PURPOSEPORTTERMINALSDURBAN–JOHANNESBURG PIPELINE ANDNEW MULTI-PRODUCT PIPELINEALRODE ORTIA WALTLOOSECUNDA<strong>Sustainability</strong> <strong>Report</strong> <strong>2012</strong>11
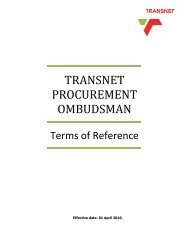
National Ports Authority“National Ports Authority, the landlord port authority of South Africa, owns, manages, controls andadministers the eight commercial ports of Saldanha, Cape Town, Mossel Bay, Port Elizabeth, Ngqura,East London, Durban and Richards Bay. We plan, build and maintain port infrastructure (breakwaters,entrance channels, turning basins, quay walls); control the safe navigation of vessels within port limits(using tugs and skilled pilots); licence terminal operators and others to provide cargo handling services;and we lease land to companies and authorities – all in strict environmental, safety and security standards.98% of South Africa’s trade passes through our port system in the form of containers, dry bulk, liquidbulk, break-bulk and automotives. In 2011/12 we are particularly proud of the opening of the PortNgqura as the first Green Port in South Africa. In addition, our first black female marine pilots graduatedfrom the School of Ports. Our challenges ahead are recruitment, skills development and energyefficiency.” CEO Tau MorwePROTECTING THE MANGROVES Bayhead Natural Heritage Site at Port of Durban:13 hectares of mangrove forest set aside forconservation. R50 million spent protecting sensitive mangroveswamps at the Port of Richards Bay.PORT TARIFFREDUCTIONOF R1 BILLION FORMANUFACTURINGEXPORTERSPROTECTIONOFICHTHYOFAUNA Port of Ngqurahabitat to 47species of fish. Extension ofmarineenvironmentproviding arefuge for marinespecies alongthe high energycoast.LIGHTHOUSESSALDANHAPORT LIMITS| CAPE TOWN | MOSSEL BAY |2011/12HIGHLIGHTSTENANTS3 422EMPLOYEESPORT ELIZABETHDREDGINGSERVICESCreates depth forvessels to navigate through.TUGGUIDESVESSELSTOBERTHR8,3bnREVENUEBREAKWATERCreates a channelfor vessels tonavigate through.PILOTSTEERSVESSELTrained portpilot takenby boat orhelicopter tosteer vesselssafely to port.R1,7bnCAPITALINVESTMENT16
Port Terminals“Port Terminals provides cargo handling services at 16 terminal facilities in seven ports to a widerange of customers including shipping lines, freight forwarders and cargo owners. Operations are incontainers, bulk, break-bulk and automotives. We invest in state-of-the-art cargo handling equipment(ship-to-shore cranes, straddle carriers, rubber-tyre gantries, tipplers, conveyors) and manage thelogistics interface with inbound and outbound rail and trucking carriers. In 2011/12 we are proud ofthe implementation of the Navis terminal operating system and the certification of all our terminals toISO standards. A key challenge ahead is to reduce levels of equipment breakdowns at DCT Pier 2 andRichards Bay, to sustain container volume throughput during berth deepening in Durban, and toimprove energy efficiency. Port Terminals aims to become Africa’s port operator of choice.”CEO Karl SocikwaCAPE TOWN CONTAINERTERMINAL EXPANSION Six new Liebherr Super Post-Panamax cranes. 28 new Kalmar rubber-tyregantry cranes. Aggressive recruitment andtraining programme foroperators of new cranes. Productivity SAAward 2011 –averaging 30 – 31gross cranemoves/hour.MULTI-PURPOSETERMINALSBULKTERMINALS2011/12HIGHLIGHTS6 211EMPLOYEESR7,1bnREVENUER1,5bnCAPITALINVESTMENTMost volumesachieved targetor above target18
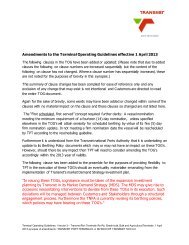
PipelinesSCHOOLOFPIPELINES Skills sharing and skillsdevelopment. Pipeline operations andmaintenance.STRETCHES3 8 0 0 kmACROSS FIVE PROVINCESCOMISSIONING OF NEWMULTI-PRODUCT PIPELINEJANUARY <strong>2012</strong> Estimated total cost of R23,4 billion. 555 km distance of 24-inch trunkline. 3 million l/h expected final capacity whichequals 8,7 billion l/annum in total capacity. Economic lifespan of more than 75 years. 6 345 local jobs created. 39,1% local employment.HYDRO CARBON CLEAN-UP Avtur site in Kliprivier clean-up commenced, to becompleted by December <strong>2012</strong>. Ladysmith site clean-up of crude oilspillage complete. Magaliesburg site clean-up of intermixturedumped on road, to be completed by March 2013.PRESSUREAT90 BARPipelines designedfor a maximumallowable operatingpressure of 90 bar.END USERGAUTENGDJP AND NMPP12-INCH & 24-INCHALRODE ORTIA WALTLOOSECUNDA9,0%ROTAInternal productivityinterruptions decreasedby 17,2% vs prior yearREDUCTIONIN SPILLAGEINCIDENCES0,21DIFRwww.transnet.net/Divisions/PipeLines<strong>Sustainability</strong> <strong>Report</strong> <strong>2012</strong>21
<strong>Transnet</strong> is strengthening its efforts in driving sustainability throughout the businesswith the adoption of a <strong>Sustainability</strong> Framework in 2011/12. We have established acompany-wide <strong>Sustainability</strong> Forum and sustainability monitoring of economic, socialand environmental dividends. In the year under review, Operating divisions continued tocreate business-focused structures and associated capacity to plan, manage and monitorprogress against their sustainability strategies. Strides were also made in identifying keyperformance areas and indicators in line with the new <strong>Sustainability</strong> Framework to report onsustainability achievements and establishing future priorities. In doing so, we have identifiedwhere our established ways of doing business already constitute sustainable good practice;and we have identified where there are important gaps and opportunities. In some areas, wehave surpassed our expectations but in others, there is much work ahead.<strong>Transnet</strong>’s sustainability performance is reported in the form of economic, social and environmental dividends.It is evident that there are overlaps between these three categories but they remain valid as distinct windowsthrough which to view the impact of <strong>Transnet</strong> as a pivotal South African S0C.This report highlights significant sustainability facts and concerns across the <strong>Transnet</strong> business. Stakeholdersreading this report will be able to gain new insights into <strong>Transnet</strong>’s sustainability track record to date and focusareas ahead. The intention is to allow the broader stakeholder community to follow our sustainability journeyand begin to detect, through our annual <strong>Sustainability</strong> <strong>Report</strong>s, the quality of lasting value that <strong>Transnet</strong> bringsto the wellbeing of South Africa’s present and future generations.<strong>Sustainability</strong> performance reviewECONOMICDIVIDENDSPageCost-effective, efficientand reliable freightlogistics and infrastructureahead of demand 25Skilled human resourcesaligned to infrastructureand services 39Local supplier industrydevelopment 42Rural development 43Regional integration 43A financially stablebusiness 45SOCIALDIVIDENDSPageGood governance,accountability andtransparency 47Zero tolerance of fraudand corruption 48A representativeworkforce 49Safety first 51Staff wellness 54Broad-based blackeconomic empowerment 55Corporate socialinvestment 57Proactive stakeholderengagement 60ENVIRONMENTALDIVIDENDSPageModal shift from roadto-rail,lowering SouthAfrica’s carbon emissions 69Energy efficiency 70Climate changemitigation and adaptation 72Water use efficiency 74Waste managementoptimisation 74Biodiversity enhancement 75<strong>Sustainability</strong> <strong>Report</strong> <strong>2012</strong>23
Economic dividends<strong>Transnet</strong> is intently focused on being a primary catalyst for economic growth and jobcreation in South Africa in support of Government’s NGP. Our railways, ports andpipelines carry the productivity and consumption activities of the nation fromorigin to destination, connecting the country to local and international trade. Where<strong>Transnet</strong>’s infrastructure meets demand and our operations are reliable, business output ismobile, on time, and at scale – and our economy grows. It is <strong>Transnet</strong>’s single-mindeddetermination to deliver exceptional economic dividends to society through appropriateinfrastructure investment, operational efficiencies, skills development, localisation, jobcreation, support for rural areas, regional integration, and sound business discipline. over the next seven years to create capacity ahead of demand. The sustainability focus will be on thecost-effectiveness of these investments and the ability to not only meet demand, but to do soefficiently and effectively. <strong>Transnet</strong> aims to be a reliable supplier of transport services through exceptional rail, port and pipelineefficiencies. Sustained achievement of world-class performance will be <strong>Transnet</strong>’s measure of success. long-term plans to drive a new cadre of highly skilled employees. Our ability to match workforce skillsto infrastructure and operational requirements, year on year, is the sustainability challenge. aim is to grow a lasting and competitive local supplier base for our business, transform the racial legacyof these industries, and create jobs. cost-effectively and reliably, supporting long-term food security and rural jobs. transport costs, and increase regional competitiveness and stability. Our sustainability challenge is tograsp the opportunities and manage the risks. able to raise and service debt, reinvest revenues and enter into agreements with private parties. Ourbusiness is sustainable and there are tried and tested measures for business discipline which we applyrigorously.24
Gross Value Add resulting from <strong>Transnet</strong> capital and operating expenditureValue added is defined as the financialvalue created by the activities of abusiness and its employees.To unlock sustainable value for allstakeholders, the execution of strategyresults in value created by the activitiesof the business and its employees.Value added 2010/11Value added 2011/12<strong>Sustainability</strong> performance: Economic dividendsRefer to Volume 1Appendix B forfurther details.Employees 42%Capital providers 12%Government 3%Re-invested 43%Employees 42%Capital providers 13%Government 1%Re-invested 44%Cost-effective, efficient and reliable freight logisticsand infrastructure ahead of demandThe year under review proved to be an exceptional year withinvestment in infrastructure and continuous business processoptimisation translating into an average improvement of 18,0%in operational efficiencies across the business and industrycommending <strong>Transnet</strong> on its exceptional performance, especiallyon the export lines.In line with the Quantum Leap strategy, <strong>Transnet</strong>’s focus in2011/12 was on meeting volume targets and rolling out thefive-year R110,6 billion investment programme. A total ofR22,3 billion was invested (compared to R21,5 billion in2010/11) to maintain and expand current operations to meetfuture demand. This excludes the R1,2 billion payment made forthe former Durban International Airport site which is classifiedas a short-term investment, until the land has been transferredin line with International Financial <strong>Report</strong>ing Standards.We highlight here our key achievements, challenges and targetsin delivering cost-effective, efficient and reliable freightlogistics and infrastructure ahead of demand for each majorcommodity business sector.“Ten years from now I see us operating aworld-class freight business. Theinvestments we are currently making willensure that.”Brian MolefeGroup Chief ExecutiveCAPITAL INVESTMENTPAYS OFF18,0% IMPROVEMENTIN OPERATINGEFFICIENCIES ACROSSTRANSNETCAPITAL INVESTMENTR22,3 BILLION<strong>Sustainability</strong> <strong>Report</strong> <strong>2012</strong>25
Economic dividends (continued)“<strong>Transnet</strong> Freight Rail did remarkably wellin the second half of 2011 and surprisedthe industry with its efficiency. We are alsoencouraged by what Freight Rail hasachieved so far in <strong>2012</strong>.”Sipho NkosiChief Executive Officer: Exxaro, <strong>2012</strong>GFB VOLUMESINCREASE 9,9%TO 81,0 MTIN 2011/12THREE TIMES ANNUALGDP GROWTH38 NEW CLASS 43DIESEL-ELECTRICLOCOMOTIVES INOPERATIONIN 2011/12General freight businessFreight Rail transported 81,0mt for the 2011/12 year in theGeneral Freight Business (GFB), reflecting a positive growth of9,9% compared to 73,7mt in 2010/11, more than three timesannual Gross Domestic Product (GDP) growth. This is the highestyear-on-year growth rate achieved by Freight Rail over recentyears, bringing GFB to pre-2008 economic crisis volumes.Locomotive efficiency (GTK per loco per month) is reflecting amarginal improvement compared to the prior year. Whilston-time departure and arrival deviations are above the plannedlevels, average delays from scheduled departure and arrivaltimes improved, by 18,9% and 17,7% respectively. The ‘YardCountdown Tool’ implemented as part of the Scheduled Railwaystrategy is resulting in positive improvements, which isevidenced by the significant decrease in the departure schedulefrom 304 minutes in February <strong>2012</strong> to only 169 minutes inMarch <strong>2012</strong> (also below the target of
GFBKey performance area<strong>Transnet</strong> Freight RailUnit of measureActual2010/11Actual2011/12Target2018/19Volumes million tons 73,7 81,0 170,2Capital investment (a) R million 10 261,0 5 758,0 151 080,0Locomotive efficiency GTK/loco/month 5 121 5 167 7 106Wagon turnaround Days 12,6 11,5 7,2On-time departures (b)350 284 163Minutes from scheduleOn-time arrivals (c) 434 357 193<strong>Transnet</strong> Rail EngineeringLocomotive availability % (active fleet) 89,6 90,5 91,1Locomotive reliability faults/million km 28 25 22Wagon availability % (active fleet) 93,8 94,2 95,5Wagon reliability faults/million km 0,79 0,62 0,55<strong>Sustainability</strong> performance: Economic dividends(a)(b)(c)2018/19 target reflects planned cumulative investment from <strong>2012</strong>/13 over the seven-year period.A leniency departure window of 90 minutes included in the 2011/12 actual figures. Prior year not adjusted.A leniency arrival window of 180 minutes included in the 2011/12 actual figures. Prior year not adjusted.Richards Bay Multi-Purpose Terminal<strong>Sustainability</strong> <strong>Report</strong> <strong>2012</strong>27
Economic dividends (continued)“We have a very good relationship withFreight Rail, and 2011 went exceptionallywell with Kumba railing 39,1 million tons tothe port, which was a 7% increase from theprevious year.”Gert SchoemanKumba Iron Ore spokesperson7 April <strong>2012</strong>EXPORT IRON OREINCREASE 13,2%TO 52,3 MTIN 2011/1274,0% INCREASE SINCE2006/07“Three years ago, we could not deliver amillion tons per week.”Siyabonga GamaChief Executive: <strong>Transnet</strong> Freight Rail44 NEW CLASS 15ELOCOMOTIVESIN OPERATION BYSEPTEMBER 2011Export iron oreThe iron ore line continued to perform exceptionally wellthroughout 2011/12 with 52,3mt being recorded for 2011/12compared to 46,2mt in 2010/11 exceeding the budget by 0,7mt.Consistent positive performance over the past few years hastranslated into a 74,0% increase compared to 2006/07 –evidence of Freight Rail’s ability to meet market demandconsistently and reliably.Locomotive efficiency was recorded at an average of43,1 million GTK per loco per month for the 2011/12 yearreflecting an improvement of 10,9% compared to the prior year.The focus will be placed on the use of the Plato planning tool toimprove locomotive utilisation even further.The average deviation from the on-time departure and arrivalschedules for the 2011/12 year were well below budget, which isa good reflection of the positive impact the Scheduled Railwaystrategy is having on the business.Both locomotive availability and reliability has improvedsignificantly as a result of improved maintenance practices.Wagon availability and reliability has once again been sustainedat better than benchmark levels.To date, two expansion programmes to 41,0mt and 47,0mtrespectively have been completed on the iron ore line and theexpansion to a total capacity of 62,3mt neared completionduring the year. The project entailed the construction of a32,5km railway line connecting the new Kumba Kolomela iron oremine at Postmasburg (Sishen South) with the existing linebetween Sishen and Saldanha.In order to meet the ramp up to 62,3mt, an additional 32 Class15E locomotives were purchased to supplement the 44 Class15E locomotives previously supplied. This will result in astandardisation of the iron ore locomotive fleet with a moresimplified maintenance and operating methodology allowing forimproved efficiencies going forward. In addition, significantenergy cost savings will result due to the electricity regenerationcapabilities of the Class 15E locomotives and the phasing out ofdiesel locomotives. <strong>Transnet</strong> is working closely with the industryto expand the line from 62,3mt to 82mt over the medium-term.30
Economic dividends (continued)Maritime containers (Ports)Container volumes of 4,4 million TEUs for the 2011/12 year reflect an increase of 6,6% compared to the prioryear. The growth in the container market was mainly driven by imports (7,0%), exports (5,0%) andtransshipments (10,0%). However, the container sector is starting to feel the effects of the Euro Zone crisis aswell as consumer caution due to uncertainty in the market. This will be closely monitored going forward.Maritime containers (Ports)Key performance area<strong>Transnet</strong> National Ports AuthorityUnit of measureActual2010/11Actual2011/12Target2018/19Volumes TEUs 4 081,0 4 352,0 7 646,1Capital investments (a) R million 1 125,0 978,0 14 312,0Port efficiency – Durban40 45 44Port efficiency – Cape Town 26 46 50TEUs/STAT hourPort efficiency – Port Elizabeth 36 32 42Port efficiency – Ngqura not set 41 50Shipping delays – Tugs (Durban) (b)1,0 0,1 not setAverage minutesShipping delays – Pilots (Durban) (b) 0,5 0,0 not set<strong>Transnet</strong> Port TerminalsCapital investments (a) R million 460,0 807,0 9 844,0GCH – DCT Pier 2 (excluding east quay)23 21 35GCH – DCT Pier 1 26 27 32GCH – CTCT 25 28 32GCH – PECT 25 27 25GCH – NCT 24 30 32Number of movesSWH – DCT Pier 2 (excluding east quay) 47 42 70SWH – DCT Pier 1 40 44 65SWH – CTCT 46 57 60SWH – PECT 37 38 45SWH – NCT 40 47 60Truck turnaround – DCT Pier 246 44 32Truck turnaround – DCT Pier 1 Minutes45 43 35(a) 2018/19 target reflects planned cumulative investment from <strong>2012</strong>/13 over the seven-year period.(b) Average minutes ship is delayed due to National Ports Authority’s marine services (breakwater in to breakwater out).GCH Moves per gross crane hour.SWH Moves per ship working hour.STAT Ship turnaround time.TEU Twenty-foot equivalent unit (container).4,4M TEUsINCREASE 6,6%7,0% EXPORTS5,0% IMPORTS10,0% TRANSSHIPMENT30 GCH AT NGQURACONTAINER TERMINALIMPROVEMENT25,0%R257 MILLION CAPEXCAPE TOWN PORTTEUs/STAT HOURIMPROVEMENT76,9%R652 MILLION CAPEX32
Petroleum (Pipelines)Total petroleum volumes are 7,1% below the prior period. Reasons for the reduction in volumes include thebreakdown in the industry operated single buoy mooring resulting in the extended Sapref shutdown andcutback in production at Natref, ongoing Natref and Secunda production issues and the Enref fire.There were also demand challenges that resulted in supply cutbacks as the pipeline delivery network wasminimum stock levels. Orders placed for ORTIA were recently increased and there are currently very high stocklevels at ORTIA resulting in additional supply cutbacks.<strong>Sustainability</strong> performance: Economic dividendsPipelinesKey performance area<strong>Transnet</strong> PipelinesUnit of measureActual2010/11Actual2011/12Target2018/19Volumes billion litres 18,0 16,7 20,1Capital investments (a) R million 6 077,0 4 507,0 11 350,0 (b) % 102 93 n/aCapacity utilisation – NMPP % n/a 40 92Production interruptions – internal causes (b) hours 285 236 n/a(a) 2018/19 target reflects planned cumulative investment from <strong>2012</strong>/13 over the seven-year period.(b) Future use of the DJP is under review.n/a Not applicable.Pipelines Pump Station 1 – Durban<strong>Sustainability</strong> <strong>Report</strong> <strong>2012</strong>33
Economic dividends (continued)Upgrade to Durban Container Terminal – Pier 2 and Pier 1In an effort to boost efficiency and productivity at South Africa’s leading container terminal, <strong>Transnet</strong>signed an agreement in September 2011 with China-based Shanghai Zhenhua Heavy Industries Co forthe purchase of seven tandem lift ship-to-shore (STS) cranes for Durban Container Terminal (DCT)Pier 2. This formed part of targeted interventions to renew <strong>Transnet</strong>’s fleet of ageing port handlingequipment across all container terminals. The cranes are expected to be delivered by December <strong>2012</strong>.Pier 2 is known for its poor efficiency and productivity levels, achieving an average of only 21 GCH(target of 26 GCH) in 2011/12 mainly due to poor port infrastructure. The procurement of the STScranes will address the terminal’s performance, making Pier 2 the first terminal in Africa to operatetandem lift STS cranes. Efficiency is expected to improve to 28 GCH with the introduction of the newcranes. The tandem lift capability of the cranes which can simultaneously handle two 12m containers orfour 6m containers within hoisting capability of 80 tons, is a significant step towards making Pier 2 aglobally competitive terminal. The purchase of the cranes is in addition to the implementation of aTerminal Operating System, NAVIS Sparcs N4. In the past year, Port Terminals has rolled out the systemto all container terminals. The system offers improved planning, reduced turnaround times and reducedoperating costs by coordinating equipment, vessel stow plans, crane schedules and container moves.Technical issues relating to the implementation of the system impacted further on Pier 2’s poorefficiency and productivity levels. An improvement in GCH at Pier 2 was achieved in the last quarter of2011/12 reaching 22 GCH, with the NAVIS system operating optimally after the initial teethingproblems were resolved.In comparison to Pier 2, Pier 1 has state-of-the-art equipment and achieved an impressive 27GCHduring 2011/12. Upgrades to berths 2, 5 and 10 at Pier 1 also commenced. These were focused on thedeepening and widening of the berths to allow for larger vessels. A highlight of the year was thecommencement of the feasibility study to deepen the north quay to 14,5m and 350m long toaccommodate three vessels simultaneously while at the same time focusing on providing the necessaryprotection to the quay walls.Looking ahead, Port Terminals is expanding Pier 1’s capacity to 2,0 million TEUs by 2018/19 up from thecurrent 700 000 TEUs while Pier 2’s capacity will be expanded to 3,3 million TEUs by 2018/19 up fromthe current 2,1 million TEUs.Port of Durban34
Cape Town Container Terminal expansion projectKey milestones for the Cape Town Container Terminal(CTCT) expansion project were achieved in 2011/12. Theaim of the seven-year project, which commenced in 2006,is to double the container capacity from 700 000 TEUs to1 400 000 TEUs per annum. Total budget committed isR5,4 billion.Key aspects of the project include: the Ben Schoeman Basin to allow for larger vessels; the current generation of Super Post-Panamaxcontainer ships; (RTG) cranes that stack containers wider, deeper andhigher; Post-Panamax STS cranes; refrigerated containers, with a total of 2 712 reeferpoints to be served by gantry cranes; and An aggressive recruitment and training programme foroperators of lifting equipment to operate the new cranes.May 2011 saw the completion of major dredging,deepening and refurbishment work at berth 602, thesecond of the four berths undergoing such upgrades.The upgrade resulted in 720m of quay wall being madeavailable to accommodate two large 305m vessels alongthe quay. Old straddle carriers were replaced by six newLiebherr Super Post-Panamax cranes with twin liftcapability and 28 Kalmar manufactured RTG cranes.Additional initiatives included container stacks beingrelocated closer to the berths to reduce travelling timeand promote better efficiency.September 2011 saw the opening of the new truckentrance and staging area. The new entrance comprisesfour lanes and has a fifth lane for abnormal cargo, leadinginto the combined A and P check that serves as a truckand verification point for the terminal. The upgradeprovides tangible improvement in the alleviation of truckcongestion from Duncan Road, which is located within thePort of Cape Town.The CTCT is already enjoying the benefits of theexpansion project with additional capacity of 1 millionTEUs being created and increased productivity. Theterminal was awarded the Productivity SA award during2011 – averaging 30 to 31 GCH per hour.Modernising our transport infrastructure,especially at our ports, is a significantstride towards lowering the cost of doingbusiness in this country, job creation andeconomic growth. Crucially, this serves asa catalyst for long-term growth,investment and efficiencies in the WesternCape region.”Malusi GigabaMinister of Public Enterprises6 May 2011“This project signifies our commitment toensure the competitiveness of oureconomy as custodians of our transportand logistics infrastructure. Theinvestment will not only increase capacitybut will go a long way towards improvingproductivity and efficiency in our ports.”Brian MolefeGroup Chief Executive6 May 2011“This terminal consistently exceedscustomer expectations including highership working hour and our own efficiencytargets. From a customer perspective, therate at which containers are moved perhour has improved more than 30% in thepast 12 months.”Karl SocikwaChief Executive: <strong>Transnet</strong> Port Terminals6 May 2011Port of Cape Town<strong>Sustainability</strong> performance: Economic dividends<strong>Sustainability</strong> <strong>Report</strong> <strong>2012</strong>35
Economic dividends (continued)Opening of the Port of NgquraPositioned at the southern tip of the African continent, South Africa is well positioned to act as a globaltransshipment hub and become one of southern Africa’s key freight transport hubs. The 16th March<strong>2012</strong> marked a major milestone for <strong>Transnet</strong> and South Africa in the country’s development efforts andcommitment to regional economic development, with the opening of the state-of-the-art deep water<strong>Transnet</strong>’s vision to earmark Ngqura as a vital link in South-South trade and as a transshipment hub– reducing total supply chain cost through improved connectivity, improved service levels, and increasedcompetition between shipping lines calling at the port. The port is also South Africa’s first ‘Green Port’and is indicative of <strong>Transnet</strong>’s commitment to the environment. TEUs per annum, 65,0% is transshipment cargo). height of nine metres. construction and operation. the natural literal drift. eagle owls, three rock kestrels and a peregrine falcon in the area.Port of Ngqura36
”The NMPP is the greenest, safest andmost cost-effective method of bulk fueldelivery from Durban to Gauteng and inproviding this extraordinary facility forSouth Africa, we are extremely proud.”Charl MöllerChief Executive: <strong>Transnet</strong> PipelinesR23,4 BILLIONestimated total cost of pipeline.555kmtotal distance covered by the NMPP,from Island View in Durban, through theFree State, to Gauteng.3 000 Ml/hexpected fuel capacity once futureexpansions are complete.6 345number of local jobs created.39,10 %local employment achieved.3km/dayrate at which the pipeline wasconstructed in rural areas whereconstruction team had easy access towork on it.Commissioning of the New Multi-Product Pipelinecommissioning of the NMPP, one of the country’s mostsignificant capital investment programmes, a legacyasset with an economic lifespan of more than 75 years.This project is a true example of providing logisticsnearing the end of its economic life as a continuousoperation,high-pressure, multi-product pipeline. Currentfuel demand in Gauteng and neighbouring regions hasconcurrently, with a total of approximately 112 millionlitres of fuel flowing at three milllion litres per hourcompleted in its entirety, the NMPP will be able to carryfive products including 95 and 93 unleaded petrol, 500and 50 ppm diesel and jet fuel. The total capacity will be26,7 billion litres per year.NMPP achievements in 2011/12 include: Alrode to Langlaagte; Twini in Durban, Hilltop near Pietermaritzburg andMnambithi near Ladysmith.The NMPP is scheduled to be fully operational by the endof 2013 when the two terminals will be completed.In delivering the NMPP to South Africa, we have fulfilledtwo commitments. Firstly, we have ensured that theinland market demand for fuel is met. Secondly, we havereduced the number of tankers on our roads.<strong>Sustainability</strong> performance: Economic dividends100 m/dayrate at which the pipeline wasconstructed in urban and peri-urbanareas where construction team didn’thave such easy access.Pipelines – Durban<strong>Sustainability</strong> <strong>Report</strong> <strong>2012</strong>37
Economic dividends (continued)Rail Engineering – global firstMarch <strong>2012</strong> saw the culmination ofa project started in 2007 with abenchmark award for RailEngineering.Rail Engineering is the firstorganisation globally to developLean Six Sigma within the SAPProject and Portfolio Management.The award for this historic globalinnovation was received by RailEngineering’s Chief ExecutiveOfficer Mr Richard Vallihu from thePresident of SAP (Europe, MiddleEast and Africa), Mr Franck Cohen.Currently, Rail Engineering hasapproximately 838 projectsunderway, with 453 Lean Six Sigmaefficiency in management of thesekey projects, Rail Engineeringinstalled the new SAP PPM. LeanSix Sigma has not only led toimproved operational efficienciesbut has achieved monetary savingsof above R250 million since 2007.“Our monetary savings as a result of the Lean Six Sigma projectswhich we started in 2007 is at this moment a quarter of a billionRand . . . As much as we as a team are going to celebrate this award,this is just the beginning of more ventures that we shall continue toembark on.”Richard VallihuChief Executive: <strong>Transnet</strong> Rail EngineeringRail Engineering’s Wheel Business – Koedoespoort“I am pleased to announce that the Ports Regulator and <strong>Transnet</strong>have agreed to an arrangement which will result in exporters ofmanufactured goods receiving a significant decrease in port chargesduring the coming year, equal to about one billion Rand in total.”President Zuma,State of the Nation Address9 February <strong>2012</strong>Port tariff reduction of R1 billion to local manufacturing export industry for <strong>2012</strong>/13In order to address traffic flow imbalances primarily in the container and automotive sector (evident incontainer exports where approximately 35,0% of boxes are empty), National Ports Authority proposedto the Ports Regulator, a once-off tariff reduction of R1 billion to the local manufacturing exportindustry for <strong>2012</strong>/13 while a longer term port pricing strategy is being finalised.The R1 billion tariff reduction and discount was approved by the Ports Regulator as part of the NationalPorts Authority tariff determination for <strong>2012</strong>/13. National Ports Authority is implementing thefollowing discounts on its export cargo dues tariffs: The export cargo dues tariff discount operates on a first come, first served basis during <strong>2012</strong>/13 andterminates once the threshold value of R1 billion is attained. The discount is expected to improveefficiencies and achieve optimal utilisation of terminal handling and port infrastructure.38
2011/12R652 MILLIONSPENT ON SKILLSDEVELOPMENTSkilled human resources aligned to infrastructureand services<strong>Transnet</strong> recognises that one of its biggest challenges is skilledhuman capital. <strong>Transnet</strong> is currently faced with an ageingworkforce, limited engineering and technical skills, and criticalvacancies. There is a continued focus on aligning skilled humancapital to infrastructure and services with particular emphasison sector-specific engineering, technical and artisan skillsthrough building and maintaining established feeder pipelines.<strong>Sustainability</strong> performance: Economic dividendsSEVENTRANSNETSCHOOLS OFEXCELLENCEDuring 2011/12, <strong>Transnet</strong> invested 3,9% of total payroll(R652 million) on skills development initiatives. <strong>Transnet</strong> intends toescalate the training spend in line with employment growth targetsto 4,7% in <strong>2012</strong>/13 (R865 million).2011/12 saw <strong>Transnet</strong> exceed its targets for the feeder pipelineand sector-specific skills targets. <strong>Transnet</strong> achieved its engineering(60) and technicians (181) targets with a total of 393 engineeringbursars in the system. The intention is to increase the engineeringfeeder pipeline intake of new recruits from 60 to 200 in <strong>2012</strong>/13.During 2011/12, <strong>Transnet</strong> offered 181 technicians experientialtraining and the majority have been placed within <strong>Transnet</strong>. The planis to increase the intake to 350 (94,0%) in <strong>2012</strong>/13. In addition tobursaries, <strong>Transnet</strong> provides engineers and technicians with astructured Engineers-in-Training and Technician-in-Trainingprogramme after placement, focusing on coaching and mentoring.<strong>Transnet</strong> aims to have 2 000 apprentices undergoing training at anygiven time. 500 new recruits were targeted in 2011/12, with a totalof 1 095 entering the programme. Sector-specific skillsdevelopment will continue to focus on marine, rail and cargohandlingwith 2 506 learners taken on in 2011/12 with a plannednew intake of 1 800 learners into various development programmesin <strong>2012</strong>/13.Training of 800 protection officers will commence in <strong>2012</strong>.Students at the School of Ports – Durban<strong>Sustainability</strong> <strong>Report</strong> <strong>2012</strong>39
Economic dividends (continued)Training achievementsActual2011/12Target2011/12Achievement%Projection<strong>2012</strong>/13Apprentices: new recruits 1 095 500 170,8 500Technicians learners: new recruits 181 180 100,0 300Engineer bursars: new recruits 60 60 100,0 120Sector specific critical skills: new recruits 2 506 1 500 156,0 1 800Training spend (% of payroll) 3,9 3,5 100,0 4,7Leadership development 1 372 956 143,5 1 562All training 62 701 34 300 183,0 36 626School of PortsOne campus inDurbanSchool ofPort TerminalsOne campusin DurbanSchool ofRailEight campusesnationallySchool ofPipelinesOne campusin DurbanSchool of RailEngineering19 campusesnationallySchool ofLeadershipDevelopmentVirtual schoolSchool ofSecurityOne campus inTraining includes: Training includes: Training includes: Training includes: Training includes: Training includes: Training includes: liftingcontrollers, trainingdevelopmentequipmentcoordinators servicesand plannersoperationscoachingcoordinationbest practiceworkersCommercesupply chain<strong>Transnet</strong> boasts seven Schools of Excellence related to its core business.Our approach to skills development focuses on an integrated value chain, extending from secondaryeducational institutions, tertiary institutions, and <strong>Transnet</strong> Schools of Excellence into workplace programmesthereby ensuring a continuous feeder pipeline of critical skills. During <strong>2012</strong>/13, <strong>Transnet</strong> will invest insponsoring 2000 Grade 10 – 12 high school learners through its Rail Cadet Scheme. Sponsorships directed totertiary institutions are ongoing with <strong>Transnet</strong> currently sponsoring the establishment of the <strong>Transnet</strong> Centreof Systems Engineering at the University of the Witwatersrand aimed at fostering business and academicengagement. <strong>Transnet</strong> will continue to afford opportunities for workplace experience through its Graduate-in-Training (GIT) Programme. During 2011/12, 137 GITs participated in the programme, and an increase of 10,0%is anticipated for <strong>2012</strong>/13. On average, 60,0% of GITs are placed within <strong>Transnet</strong>.<strong>Transnet</strong>’s net employment rate increased by 6,3% from the previous year in terms of the number ofmanagement employees, and a 5,7% increase in the number of bargaining unit employees. The employeeturnover rate averaged 5,1%.The current average age of a <strong>Transnet</strong> employee is 41 years. Thus, the overarching picture for our Company isthat of an ageing workforce with a significant proportion of our employees falling within the 43 to 60 yearsage bracket. The challenge is being addressed by investing in a growing base of younger employees in the25 to 35 age group.40
Headcount2 0001 8001 6001 4001 2001 0008002011/12 Workforce ProfileAfricanIndianColouredWhite<strong>Sustainability</strong> performance: Economic dividends6004002000Age18 19 20 21 22 23 24 25 26 27 28 29 30 31 32 33 34 35 36 37 38 39 40 41 42 43 44 45 46 47 48 49 50 51 52 53 54 55 56 57 58 59 60 61 62 63 64 65+18 – 25 26 – 35 36 – 4546 – 55 56 – 60 61+The following key initiatives are underway to address theworkforce profile challenges:ObjectiveRobust recruitmentplanFeeder pipelines andyouth developmentprogrammesLearnershipsWorkforce Plan (WFP)InitiativeGrow skills intake by 10,0%.Replace turnover of 5,1%.Recruit against employment growth target of8 166 for <strong>2012</strong>/13.Recruit youth against feeder pipeline targets:apprenticeships, engineering bursary scheme,workplace experience programmes, GITprogrammes – 10% increase per annum alignedto employment growth targets.Sponsorships towards learners in schools in ruralareas through the Rail Cadet Scheme.Introduce and continue learnerships to targetyouth and unemployed learners in identifiedareas:Call Centre Learnership.Certificate in Freight Handling.Analysis and drafting of long-term WFP during<strong>2012</strong>/13.41 YEARSAVERAGE AGE OFTRANSNETEMPLOYEES2011/12Ensure transfer ofcritical skills to youngemployeesExpand coaching and mentoring programmes(Engineers, Technicians, Executives andoperational skills).<strong>Transnet</strong>’s focus for the coming year is on aligning long-term investment and human capital development plans.The WFP aims to establish a seven-year and a 30-year view on the human resources that will be needed toimplement <strong>Transnet</strong>’s Long-Term Planning Framework. This will assist education institutions’ medium tolong-term curriculum and resource planning by indicating the likely timing, scale and nature of skillsrequirements for the development and operation of South Africa’s ports, railways and pipelines. It will focus<strong>Transnet</strong>’s bursary and GIT programmes, CSI in education, and position <strong>Transnet</strong>’s Schools of Excellence to playleading roles in sector skills development.<strong>Sustainability</strong> <strong>Report</strong> <strong>2012</strong>41
Economic dividends (continued)Local supplier industry development<strong>Transnet</strong> has the opportunity to accelerate South Africa’s economic transformation and support Government’sdevelopment goals through its Supplier Development (SD) programme. The aim is to address the negativeimpacts of the historical lack of investment in infrastructure which saw a significant decline in local industrywith a large proportion of the population being unable to participate meaningfully in the economy. Byleveraging our procurement spend, we aim to increase local content through the development of skills, jobcreation and technology transfer.<strong>Transnet</strong>’s focus on SD has intensified during the year. The majority of previous SD transactions were forrolling stock, mainly locomotives, in partnership with General Electric (GE), Electro-motive Diesels and Mitsui;but have been expanded to port operations with numerous transactions being concluded relating to porthandling equipment (STS cranes). Overall supplier development achievements include: In February 2011, <strong>Transnet</strong> signed an agreement with GE for the procurement of 100 locomotives – 10 ofwhich would be manufactured at GE’s plant in the United States with the remaining 90 being manufactured atRail Engineering’s Koedoespoort facility. Production is ongoing and on schedule with 27 locomotives alreadydelivered to Freight Rail. The agreement with GE reflects the alignment to the Department of PublicEnterprises (DPE) Competitive Supplier Development Programme (CSDP) with GE committing to stringentlocalisation, industrialisation, skills development, job creation/preservation and technology and intellectualproperty requirements.diesel-electric locomotives from GE’s local arm, General Electric South African Technologies (GESAT).The contract value is R968 million and contractual SD obligations negotiated amounted to R631 million whichequates to 65,0% of the contract value building on the 52,0% achieved in the previous contract.<strong>Transnet</strong> has progressed significantly in transforming its supplier base towards a Broad-based black economicempowerment (B-BBEE) supplier base.Actual black spend for the year ended 31 March <strong>2012</strong> amounts to R11,9 billion, which is 37,0% of the totalspend of R32,2 billion. 79,5% of actual black spend is allocated to Level 1 to 4 entities (2011/12: 57,0%) and8,4% to Levels 7 to 9 (2010/11: 26,7%), evidencing a clear shift of procurement spending to black owned andmanaged companies. In terms of the Department of Trade and Industry (DTI) Codes of Good Practice <strong>Transnet</strong>’sB-BBEE spend in 2011/12 is as follows:ROLLING STOCKLOCAL SUPPLIER<strong>Transnet</strong>’s total recognised B-BBEE spend per the DTI codesis R25,8 billion or 80,0% (2011/12: R19,4 billion or 75,0%),of total measurable procurement spend of R32,2 billion(2011/12: R25,7 billion).CONTRACTEDSINCE 2007DELIVERED TO DATER3 BILLION55,0%42
Economic dividends (continued)Delivery of wagons to client in MozambiqueIn its quest to transform into a dominant manufacturingand engineering centre of excellence on the Africancontinent, Rail Engineering marked a key milestone on15 March <strong>2012</strong> with the Minister of Public Enterprises,Mr Malusi Gigaba marking the delivery of 98 wagons toRio Tinto in Mozambique. These wagons were the last ina total of 200 wagons and spare parts designed,engineered and manufactured at the Rail Engineeringfacility in Uitenhage for Rio Tinto. The first 102 wagonswere shipped in December 2011. In line with <strong>Transnet</strong>’scommitment to the CSDP, 85,5% of the raw materialsand components used to manufacture the wagons weresourced locally or built in-house. Only the draw-gear anda few specialised components were imported.This represents a significant achievement for RailEngineering’s commitment to increasing productivity andefficiency levels with 50 wagons per month beingmanufactured over a five-month period.“This is a particularly proud moment for usnot only because of the significance of thisachievement but because of the stringentstandards we imposed on ourselves tosatisfy the customer. The design,development and prototyping,industrialisation and starting productionof this new wagon was accomplished inless than five months – an impressive leadtime by any international standards.”Malusi GigabaMinister of Public Enterprises15 March <strong>2012</strong>Swazi rail linkAfrica trade is a strategic focus area of <strong>Transnet</strong>’sFreight Rail business with the southern African railnetwork system providing strategic links betweenlandlocked countries and ports. The establishment of astrategic rail link (146 km) from Ermelo utilising theBuhrmanskop – Lothair branch line to connect with theSwaziland rail network, and onwards to the Port ofRichards Bay and Maputo, in partnership with SwazilandRailways, is a key initiative for <strong>Transnet</strong> going forward.signifying the first large scale rail investment in southernAfrica since the construction of the Richards Bay line in1976. On completion, an additional capacity of 15,0mtpawill be created which will predominantly be generalfreight volumes from the existing coal export line.Rail Engineerings’ Locomotive Business– Koedoespoort“This day marks our continual thrust to beresponsive to the infrastructural needs ofour regions. We promise to ensure thatsuch new capital investments aretranslated into tangible benefits for thepeople of both Swaziland and SouthAfrica.”Brian MolefeGroup Chief Executive12 January <strong>2012</strong>44
A financially stable businessSince 2005, <strong>Transnet</strong> has been gearing up for growth initially through the Four-point Turnaround strategy toachieve financial stability (reigniting investment, strengthening governance and disposing of non-core assets) andthereafter the Quantum Leap strategy to achieve operational stability (establishing a sound funding strategy,eliminating backlog and consistently achieving strong financial results). <strong>Transnet</strong> is now ready to embark on anaggressive investment drive to ensure growth through the MDS. A financially stable business is critical to achievethis. Financial performance over the past year indicates that the Company is able to maintain a strong financialposition: evidence of the Company’s ability to generate sustainable cash flows. target of 3,0 times despite an increase in net finance costs resulting from increased borrowings to fund thecapital investment programme. It is expected that the cash interest cover ratio will not fall below the target overgoing forward. economic growth outlook both locally and internationally. The gearing ratio deteriorated marginally to 42,1% asat 31 March <strong>2012</strong> despite the capital expenditure of R22,3 billion. This level is still well below the target rangeof 50,0% reflecting the significant capacity available to fund future capital expenditure. to access the capital markets to raise the required funding for the year ahead.<strong>Sustainability</strong> performance: Economic dividendsDecrease in insurance premiumsThe unprecedented severity andcost to insurers of global naturaldisasters in 2011 have adverselyinfluenced insurance pricing and theavailability of insurance capacity.This posed a challenge for the<strong>2012</strong>/13 insurance renewal.Insurers however, expressedconfidence in <strong>Transnet</strong>’s EnterpriseRisk Management process andmaturity and the progress made overthe last year on various safetyinitiatives to reduce our incidentsand claims. Despite the hardening ofthe insurance market, <strong>Transnet</strong> wasable to achieve a 13,5% reduction inthe premiums for <strong>2012</strong>/13 as wellas a reduction in the rolling stockstop loss deductible fromR75 million to R50 million, whilestill placing cover only with A-ratedinsurers.LOOKING AHEAD<strong>Transnet</strong>’s economic dividends focus for <strong>2012</strong>/13:Capital investment of R31,2 billion to address demand.Grow rail volumes to 225mt; containers through ports to4,8 million TEUs; automotives through ports to 610 000units; and petroleum through pipelines to 18 021 million kl.Scheduled railway operations with high efficiency targets.Container terminal moves per gross crane hour between28 and 32.Accelerated skills development.Extend local supplier development, with 70% of spend onB-BBEE suppliers.Grow cross-border rail volumes and exports oflocomotives and wagons.Grow agriculture and timber rail volumes to 5,6mt.Increase direct jobs to 63 725 and indirect jobs to172 934.Maintain gearing below 50,0% and cash interest coverabove 3 times.Attract private sector investment of R1,5 billion.<strong>Sustainability</strong> <strong>Report</strong> <strong>2012</strong>45
Social dividendsSouth African society is profoundly inequitable, borne of a past where access toeconomic resources and social services were determined by race. 18 years intodemocracy, high levels of poverty and unemployment stubbornly persist,education and health care are inadequate, and corruption is pervasive. But South Africa isalso a resilient, resourceful and culturally rich society where human potential forexcellence is evident every day and where civil society’s voice is never silent. This is thesociety in which <strong>Transnet</strong> exists, invests and operates. Our railways, ports and pipelinesare located in communities, towns and cities. Our people and our customers have familiesand live in neighbourhoods and villages across the land.Ever mindful of our social context, <strong>Transnet</strong> is committed to upholding the highest standards of moralintegrity and good governance in all our dealings and to leaving a profoundly transformative social legacythrough our employment choices, stakeholder engagement and our honest and caring business practices.We are focused on delivering the following social dividends: financiers, and communities from which issues are promptly addressed in action.46
Social dividends (continued)“<strong>Transnet</strong> is committed through its FraudRisk Management Plan to minimise thenegative impact of fraud, corruption and/or other economic crimes within <strong>Transnet</strong>.The Tip-Offs Anonymous Hotline forms anintegral part of <strong>Transnet</strong>’s anti-fraud andanti-corruption efforts. All cases reportedare investigated by <strong>Transnet</strong> InternalAudit, following a clear forensics process.”Anoj SinghActing Chief Financial OfficerTip-Offs Anonymous Hotline statistics9691834922941 April 2010 –31 March 20111 023159Total allegationsTotal foundedTotal unfoundedTotal in progress3984661 April 2011 –31 March <strong>2012</strong>Security managementZero tolerance of fraud and corruptionFraud, corruption and other economic crimes have a debilitatingimpact on our business, the economy and the moral fibre ofsociety. Every effort is therefore made to root them out in<strong>Transnet</strong> and hold the perpetrators to account. <strong>Transnet</strong> has aFraud Risk Management Plan with a dedicated whistle-blowingmechanism. The Tip-Offs Anonymous Hotline is managed by<strong>Transnet</strong> Internal Audit and all reported cases are investigatedthrough an established forensics process. In 2011/12, a total of1 023 call reports were received representing an increase from969 in 2010/11. Of this figure, 159 were founded, 398 wereunfounded and 466 are being investigated.With the advent of the MDS, <strong>Transnet</strong> has adjusted its FraudRisk Management Plan to address new challenges, including: result of R300,1 billion accelerated spending over the nextseven years; and emanating from the planned increase in the <strong>Transnet</strong> staffcomplement over the next seven years.The adjusted Fraud Risk Management Plan’s key initiatives are: employees; and its Operating divisions to improve adherence to <strong>Transnet</strong>’sstrategy of Zero Tolerance; and Tip-Offs Anonymous Hotline 088 0000 3056transnet@tip-offs.comAs an economic crime, copper cable theft has had a detrimental impact on rail service delivery due to the high costof replacing cables, the associated damage to wagons and locomotives, and the disruptions in rail service. In itsefforts to combat copper cable theft, Freight Rail revised its Crime Prevention Strategy. As a result, there hasbeen a dramatic decrease in the number of incidents from 2 091 incidents by the end March 2011 to 1 557incidents by the end of March <strong>2012</strong>. Cable theft cost <strong>Transnet</strong> R38 million in 2010/11 and R19 million in2011/12.Incidents of other economic crimes that have a detrimental impacton <strong>Transnet</strong>’s business are recorded as follows:2010/11 2011/12Goods in transit theft 109 233General theft 1 257 1 527Copper products theft 40 31Motor vehicle theft 8 7Sleeper theft 27 26Tarpaulin theft 114 145Battery theft 294 221COPPER CABLETHEFT INCIDENTS2010/11 2011/122 091 1 55748
A representative workforceAfrican employees represent 65% of the<strong>Transnet</strong> workforce as compared to theNational Employment Action Plan (NEAP)target of 75% and woman employeesrepresent 22% of the workforce, ascompared to the NEAP target of 22%.Gender diversity 2011/12 Employment equity 2011/12<strong>Sustainability</strong> performance: Social dividendsFemale 22%Male 78%African 65%Coloured 10%Indian 4%White 21%<strong>Transnet</strong>’s Employment equity (EE) profile per occupational category in 2011/12 is as follows:MaleFemaleOccupationalcategory* African Coloured Indian White Total African Coloured Indian White TotalGrandtotalTop management 24 7 15 17 63 22 2 6 8 38 101Seniormanagement 155 36 76 150 417 81 21 26 31 159 576Professional 1 115 278 313 1 306 3 012 712 117 118 191 1 138 4 150Skilled technical 7 540 1 407 740 6 397 16 084 3 646 522 183 884 5 235 21 319Semi skilled 10 817 1 514 347 1 659 14 337 2 619 340 66 224 3 249 17 586Unskilled 4 918 571 39 99 5 627 1 061 91 12 22 1 186 6 813Grand total 24 569 3 813 1 530 9 628 39 540 8 141 1 093 411 1 360 11 005 50 545* Covers permanent employees only (for EE reporting purposes, the number may be different as Department of Labour requires that employeesthat have a fixed term contract in excess of three months be recorded as permanent).Students at Port Simulator – Durban<strong>Sustainability</strong> <strong>Report</strong> <strong>2012</strong>49
Social dividends (continued)“<strong>Transnet</strong> is committed to the integrationof People with Disabilities into theworkplace. Additional initiatives are inplace to improve awareness and educationof our employees on the definition andtypes of disabilities that could bedisclosed. We also recognise thatreasonable accommodation is an integralpart of creating a conducive environmentfor People with Disabilities within <strong>Transnet</strong>.Specific targets per Operating divisionhave been set and all Chief Executives aremonitoring achievements thereof.”Nonkululeko SishiGroup Executive: Human ResourcesRepresentivity of People with Disabilities (PWDs) remains asignificant challenge for <strong>Transnet</strong> with PWDs representing only0,8 % of the <strong>Transnet</strong> workforce. One of the key challenges is theunwillingness to declare disabilities in the workplace due to alack of understanding. Physical access constraints and attitudecontribute to this challenge.The EE focus for <strong>2012</strong>/13 includes: declare their disability status; placement of PWDs for current vacancies; across Operating divisions; Disability Policy which includes definitions and process forreasonable accommodation; and TransformationNational Ports Authority has made history by appointingRufus Lekala as South Africa’s first black Chief HarbourMaster – he became the world’s youngest harbour masterwhen he was appointed to the Port of East London in 2002.He is now the youngest Chief Harbour Master in the world atthe age of 41.Captain Rufus Lekala, Chief HarbourMaster – National Ports Authority“The maritime sector used to be one thatwas closed off to the historicallydisadvantaged, including women, but this ischanging and we are geared for evengreater success stories like this”.Tau MorweChief Executive: National Ports AuthorityIn addition, <strong>Transnet</strong>’s first black, female marine pilotsgraduated from the School of Ports in Durban. PreciousDube, Bongiwe Mbambo and Pinky Zungu are three of onlyfive female marine pilots in South Africa with an openlicence to navigate vessels of any size and type into SouthAfrican waters.Rail Engineering’s recently approved Women in RailEngineering (WIRE) Programme aims to create a strongsuccession pool of competent female managers that canassume future positions in Rail Engineering; accelerate thedevelopment of women in Rail Engineering to meet EEtargets; accelerate the engineering, operation basedleadership capabilities in Rail Engineering; create a pipelineof potential successors for all management positions; anddevelop a structured training programme within RailEngineering.50
Safety first<strong>Transnet</strong> is committed to providing a safe and healthy workingenvironment for all our stakeholders. Safety is a key part of ourSHEQ (Safety, Health, Environment and Quality) managementsystem. Performance is measured against industry recognisedindicators such as the disabling injury frequency rate, lossincidents, fatalities and derailments.There has been a decrease in the DIFR over the past year from0,82 to the level of 0,65 at year-end. This is below the target of0,80 and the performance reflects an improvement of 20,7%compared with the prior 12 month period. The DIFR rate hasdropped by more than 40% over the past six years. This isexceptional progress by international standards but is not yetgood enough.There has been a notable reduction in the number and severityof loss incidents over the past year, dropping from 1 652 in2010/11 to 1 060 by 31 March <strong>2012</strong>. The estimated cost ofthese incidents year-to-date is R432 million compared toR1,1 million for the previous year.There were seven employee fatalities in 2011/12 compared to12 in the prior year. Employee fatalities have dropped by morethan 70% over the past six years. Four of the seven deathsresulted from motor vehicle accidents and three occurred due tonon-adherence to Standing Operating Procedures. Whilst thereis a significant decline in fatalities, one fatality is one too manyand <strong>Transnet</strong> continuously strives for zero fatalities.There were 100 public fatalities reported for 2011/12 comparedto 151 in the prior year. The majority of these were rail-related.Trespassing into <strong>Transnet</strong>’s operational areas remains thebiggest contributor to these incidents.Running line derailments have declined from 125 in 2010/11 to87 in 2011/12. Shunting derailments declined year-on-year from363 to 294. However, shunting derailments at private sidingsincreased from 210 to 219 in the same period.<strong>Transnet</strong> is now in the third year of its intensive Safety CultureProgramme through Safety Leagues and competitions.The safety leaguesUsing the competitive framework of a soccer league, SafetyLeagues aim to embed safety management practices andbehaviour. Teams compete for prize money, which is usedtowards morale-boosting facilities such as canteens and braais.Performance is measured on unplanned absenteeism, personalprotective equipment usage and breathalyser statistics. Thereare currently three Safety Leagues involving more than 9 000employees in 13 business units and four Operating divisions.DIFR 0,6520,7%IMPROVEMENTIN 2011/12FATALITIES2010/11 2011/1212 EMPLOYEES 7151 PUBLIC 100“Our foremost priority is reducing health andsafety risks in the workplace for all our staffand contractors. In 2011/12 we achieved thebest safety record in many years with asignificant decrease in the disabling injuryfrequency rate and the number of employeefatalities. Our Operating divisions achievedvarious National Occupational SafetyAssociation five-star ratings for excellentsafety performance. This can be attributedto the ‘Safety Mindset’ that is evident at alllevels of the business. We neverthelessacknowledge that we have more work to doas we strive towards totally eliminatinginjuries from the workplace. We alsoacknowledge that an injury-free workplace isnot an end in itself; it is a standard that mustbe maintained through constant vigilance,evaluation and communication. We willmaintain our ‘no excuses’ approach tosafety, and continue to support each otherin doing so.”Virginia DunjwaChief Risk Officer<strong>Sustainability</strong> performance: Social dividends<strong>Sustainability</strong> <strong>Report</strong> <strong>2012</strong>51
Social dividends (continued)“We’ve gained several learnings in the GSLand two stand out. The first is that safetystarts with you as local business manager.The second is that safety should bediscussed continually at all forums and allplatforms. This has helped us to raisegreater safety awareness”.Pottie PotgieterChief Operation Officer: Rail EngineeringThe Seven Golden Safety ActionsI will not perform unsafework and put myself andothers in dangerIf I don’t understand andif I have a problem, Ispeak up and say soI always prepare, checkand report unsafe actsand conditionsI take responsibility formyself and my team andI don’t blame othersNo matter what mylevel I contribute toimproving safetyI rest well and worksafelyI know the standard operating procedures andsafety rules, follow them and don’t take shortcuts“Safety, including that of communities whomake it possible for <strong>Transnet</strong> to run itsoperations throughout the country throughpartnerships, is one of the key elements ofour business. It is for this reason that ourteams did all in their power to make surethat we deliver on our promise to ensurethe safety of this community.”Brian MolefeGroup Chief Executive13 September 2011 Authority, Freight Rail, Rail Engineering and Port Terminals. year one of the GSL). The 2011/12 Safety League saw improvements in frequency atwhich sites breathalyse and a drop in employees testing positivefor alcohol. Although absenteeism remains a challenge across alldivisions, league sites are continuously innovating to reduceunplanned leave and sick leave with some sites managing toachieve and maintain the league target of 0,7% absenteeismrate. League sites earn points for actively promoting andembedding <strong>Transnet</strong>’s Seven Golden Safety Actions. Currrently,Rail Engineering’s Uitenhage Red Bulls team are at the top ofthe League.Annual Safety Competition Day<strong>Transnet</strong> holds an Annual Safety Competition Day in April eachyear, incorporating the Practical First-Aid CompetencyCompetition, the Fire Safety Competency Competition and thefinals of the <strong>Transnet</strong> Occupational Health and SafetyRepresentative Competition. The top three divisional First-Aidand Fire Teams from Operating divisions and the top threedivisional winners of the Health and Safety RepresentativeCompetition, compete on the day.The competitions motivate, encourage and reward deservingcollective and individual efforts in the field of health and safety.This annual event also helps to measure the level of skills andpreparedness in the respective fields.Several other <strong>Transnet</strong> Safety Awards, which encourage a healthand safety culture are given during the year, and areacknowledged at the prize-giving function of the <strong>Transnet</strong> SafetyCompetition Day.Level crossingsAccidents at level crossings pose a huge risk to safety for<strong>Transnet</strong>. Not only do level crossing accidents result in a loss oflife but these accidents also damage <strong>Transnet</strong>’s assets (rollingstock), cause train delays, customer dissatisfaction, financialloss and negative publicity. In an effort to reduce the accidentsbetween trains, road vehicles and pedestrians, Freight Rail hasembarked on an awareness campaign to promote and enhancesafety at level crossings through law enforcement,advertisements, media campaigns, and visiting and educatingcommunities and schools in areas where level crossing accidentsare the highest. As a result of these efforts, level crossingaccidents have decreased from 117 in 2010/11 to 81 in2011/12.52
Appointment of level crossing traffic officersin Rustenburg, North WestIn its analysis of level crossing statistics, Freight Railidentified Rustenburg in the North West as a highrisk area due to increased platinum mining, rapidurbanisation, growth of the city and increase intraffic density. In partnership with the Road TrafficManagement Corporation and the North WestDepartment of Public Safety, Freight Rail embarkedon a pilot project in 2011 to reduce level crossingaccidents through law enforcement. Freight Rail hascommitted R4,5 million to the level crossinginitiative which involves education and awarenesscampaigns and the recruitment of 22 young railwaytraffic officers who man the level crossing inRustenburg. Dedicated project managers will beemployed to monitor implementation and results.<strong>Sustainability</strong> performance: Social dividendsConstruction of boundary wall along railwayline in Mbekweni, Paarl<strong>Transnet</strong>’s commitment to its Level CrossingCampaign was reaffirmed on 13 September 2011when construction started on a three kilometre wallalong the railway line going through the informalsettlement in Mbekweni, Paarl in the Western Cape.The construction follows a tragic incident in whichtwo toddlers were killed when they wandered intothe path of an oncoming Metrorail passenger trainoperated by the Passenger Rail Agency of SouthAfrica. On visiting the site on the day of the fatalitiesin May 2011, the <strong>Transnet</strong> Group Chief Executivevowed to ensure that the Company prevented furtherloss of life by erecting an impenetrable wall alongthe line. This was done through an acceleratedprocess to source the required expertise and secureregulatory approvals.In addition to the wall construction, Freight Rail ran arail safety awareness campaign in the communitywith a door-to-door education drive and apartnership with the South African Police Service(SAPS). These initiatives reached more than 1200people, including children.Annual Safety Competition DayWe remember our colleagues who tragicallydied as a result of injuries sustained at<strong>Transnet</strong> workplaces during 2011/12: 25 April 2011 30 September 2011 4 October 2011 29 February <strong>2012</strong><strong>Sustainability</strong> <strong>Report</strong> <strong>2012</strong>53
Social dividends (continued)ABSENTEEISMDOWN2010/11 2011/122,19% 1,95%“The Culture Charter has in some waysimproved our working environment,especially in terms of safety. It haschanged the way I think and communicate.As workers we need to communicate more.When we communicate it’s easy to worktogether.”Precious MolefeElectricianPipelinesStaff wellness<strong>Transnet</strong> is committed to ensuring the wellness of its staff.During 2011/12 <strong>Transnet</strong> focused on various initiativesto achieve this.The Absenteeism Management Programme resulted in adecreased rate of sick absenteeism month on month, from2,19% in 2010/11 to 1,95% in 2011/12. The DiseaseManagement Programme achieved an increase in the number ofregistrations for medically uninsured employees from 86 in2010/11 to 97 in 2011/12. The Employee AssistanceProgramme’s rate increased from 8,5% to 8,7% against abenchmark of 8% – 12%. <strong>Transnet</strong> plans on increasing thisthrough sustained efforts of marketing and communication. TheExecutive Wellness Programme achieved 40% against a targetof 75% for Executive Managers to complete a full medicalassessment. The challenge remains the busy schedules of theexecutive cadre. In addition, <strong>Transnet</strong> piloted its Life SkillsProgramme within the Marine Cadet Programme assisting withsocial integration and adaption to life at sea. The programmetargeted 50 cadets, 24 of whom participated.The Culture CharterBuilding a high performance culture remains an imperative for<strong>Transnet</strong>. November 2011 marked the most successful scoringparticipation by <strong>Transnet</strong> employees in the Culture Charterbehaviour review since its launch in 2008. A total of 28 772employees participated, showing an overall increase of 12 450from 2010. This is indicative of a growing sense of ownership ofthe culture behaviour and a growing perception that scoring is acredible process that allows employees’ voices to be heard.72 24 546 421246 391540 402066 28 540 372359 338We have We havea safety goodmindset communicationWe treateach otherwith dignityand respectWe areempoweredto performin our jobsWe arebusinessfocusedWe recogniseand rewardgood workWe deliveron ourpromisesNot at all Sometimes Almost always54
Employees were asked to score the culture behaviour based ontheir perceptions of how well we are living the culture.Overall, the 2011/12 Charter scores indicate that mostemployees have positive perceptions about culture at <strong>Transnet</strong>.The challenge remains to convert behaviour from ‘Sometimes’ to‘Almost always.’ Scores indicate: participants believe that we do not always comply with safetypolicies and procedures. third of participants believe that this only occurs ‘Sometimes’or ‘Not at all’. takes place ‘Sometimes’. This needs attention. raised by employees focus mainly on perceptions of fairness. empowered to perform in their jobs. Relationships betweensenior managers, supervisors and employees are not alwayspositive. Effective management will be a key focus goingforward. and rewarded for their good work, despite objectively fairmarket comparisons in <strong>Transnet</strong>’s remuneration policy.When asked to prioritise one area, employees scored as follows: Broad-based black economic empowerment<strong>Transnet</strong>’s B-BBEE policy is based on the B-BBEE Act, Act No 53of 2003. In terms of the six pillars (management control, EE,skills development, preferential procurement, enterprisedevelopment and socio-economic development) formeasurement of B-BBEE, <strong>Transnet</strong>’s B-BBEE scoring for2011/12 is Level 5, which is unexpectedly low. This is attributedto the following challenges: of <strong>Transnet</strong>’s skills and leadership training of black employeesand black employees with disabilities; and proof of specific initiatives that assist and/or accelerate thedevelopment, sustainability and ultimate financial andoperational independence of black-owned beneficiary entities.“The Culture Charter has helped me tounderstand what other colleagues arethinking. It has helped me to work withpeople, talk to them, and know what theirviews are. We need to respect one anotherand have good communication skills.”Mashudu MuthivhiYard officialFreight Rail“Thanks to the Culture Charter we nowhave a collective identity in <strong>Transnet</strong>. I’vebeen part of the Culture Programme sinceits inception in 2007, and its been ajourney of trying to find ourselves in<strong>Transnet</strong> and living our culture. Being partof this change process has enriched mylife. It warms my heart to see that theculture behaviours are entrenched in ourCompany and that culture awareness iseverywhere. I realise that change beginswith me. If we want to leave a legacy forthe next generation of <strong>Transnet</strong>ters, we allneed to live the culture behaviours.”Ntombekaya MgayiOrganisational Development ManagerRail Engineering“We recognise the role that B-BBEE playsin the economic transformation of SouthAfrica as it significantly increases thenumber of previously disadvantagedpeople who manage, own and control thecountry’s economy, as well as significantlydecreases income inequalities.”Brian MolefeGroup Chief Executive<strong>Sustainability</strong> performance: Social dividends<strong>Transnet</strong>’s B-BBEE management control, employment equity,preferential procurement and socio-economic development allscore well in the B-BBEE scorecard.<strong>Sustainability</strong> <strong>Report</strong> <strong>2012</strong>55
Social dividends (continued)<strong>Transnet</strong> appoints black-ownedexternal audit firmA major milestone in thetransformation of the accountingand auditing profession wasreached in South Africa on20 February <strong>2012</strong> when thePublic Enterprises Minister,Mr Malusi Gigaba, announced theappointment ofSizweNtsalubaGobodo as<strong>Transnet</strong>’s external auditors.The appointment marked the firstin South Africa for a locally grownand black-owned firm to handlethe entire audit account of acorporate the size of <strong>Transnet</strong>.“This reaffirms our commitment toensuring that state-ownedcompany(ies), as entrusted to usby the people of South Africa, areused as agents of change andtransformation of our economy,”said Minister Gigaba.SizweNtsalubaGobodo wasselected out of three biddersbased on technical ability, blackeconomic empowerment and price.“This is an honour, not only forSizweNtsalubaGobodo, but for the wholeof our industry. We are delighted that acompany of <strong>Transnet</strong>’s size with such anenormous responsibility in this economyhas shown confidence in one of us. We areaware that our performance in the<strong>Transnet</strong> account will determine the fate oflocal players in future.”<strong>Transnet</strong>’s B-BBEE ratingB-BBEEscorecardpillarsTotalpointsallocatedTarget(Level 3)Target(Level 2)Target(Level 1)Points R/A/Gachieved statusManagementcontrol 10 8,5 9 10 7,53Employmentequity 15 10 12 15 9,31Skillsdevelopment 25 16 20 25 12,51Preferentialprocurement 30 27 28 30 26,06Enterprisedevelopment 15 8,5 11 15 0Socioeconomicdevelopment 5 5 5 5 5Overallscoring 100 75 85 100 60,41No issues currently pose a threat to B-BBEE.Issues identified which pose threats to B-BBEE. Actions to resolve the issuesare in hand.Issues identified which pose threats to B-BBEE. Solutions to be identified.In order to improve our overall B-BBEE rating to Level 1 by2016/17, the following initiatives have been identified for<strong>2012</strong>/13 to achieve a Level 3 rating: measure the contributions of <strong>Transnet</strong> towards thedevelopment of black employees and black employees withdisabilities by way of skills development training andleadership programmes; and programme for assisting and/or accelerating the development,sustainability and ultimate financial and operationalindependence of black-owned QSE and EME beneficiaryentities, through the expansion of their financial and/oroperational capacity.Victor SekeseChief Executive OfficerSizweNtsalubaGobodo56
Corporate social investmentThe <strong>Transnet</strong> Foundation is <strong>Transnet</strong>’s custodian on CSI, which in2011/12 spent approximately R160 million on five majorprogrammes: The award-winning Phelophepa health care train,containerised assistance, rural and farm schools sport, teacherdevelopment, and employee volunteer initiatives.Whilst the <strong>Transnet</strong> Foundation remains the custodian of theCompany’s CSI initiatives, the Operating divisions respondproactively to the needs of vulnerable communities surroundingtheir operations.The Phelophepa: Train of hopePhelophepa is a flagship project of the <strong>Transnet</strong> Foundation.Phelophepa I made history when it became the first sustainableSouth African CSI initiative to receive the prestigious UnitedNations Public Service Award for its excellence in public servicethe Archon Award from the Honour Society of Nursing, SigmaTheta Tau International, for the train’s dedication in providingprimary health care services and health education programmesin rural areas in South Africa.March <strong>2012</strong> marked the unveiling of <strong>Transnet</strong>’s second ‘Train ofHope’, Phelophepa II. With the launch of Phelophepa II ourCompany reaffirmed its commitment to help South Africaachieve the United Nations MDG which include reducing childmortality, improving maternal health, and combating HIV/Aids,malaria and other diseases.The introduction of Phelophepa II will more than double thenumber of people who benefit from the facility as both trainswill run simultaneously by 2013. The beginning of September2011 saw Phelophepa I register 59 573 patients at a remarkablerate of 1 722 patients per week – shattering the previous recordof 49 314 patients achieved in 2009.Phelophepa services include: dental, optometry, pharmacy, oraland vision screening, HIV counselling, health education andpsychological counselling. In addition, the train offers SouthAfrican and international final-year professional health studentspractical experience in nursing, dentistry, optometry, psychologyand pharmaceuticals. <strong>Transnet</strong>’s partner sponsors forPhelophepa are Roche and Colgate-Palmolive South Africa.Phelophepa combines elements of Sotho and Tswana andmeans ‘good, clean health.’Cost to build Phelophepa II was R82 million and R25 million hasbeen set aside to upgrade Phelophepa I to the same level as thesecond train. Phelophepa II was engineered and built at RailEngineering’s facility in Salt River.“When I think of the <strong>Transnet</strong> Foundation,three things immediately come to mind:caring, improving lives and making adifference. That’s why the Company isinvesting over R160 million in Corporatesocial investment.”Cynthia MgijimaHead: <strong>Transnet</strong> Foundation“What started off 18 years ago as amodest three-coach eye clinic has becomean internationally well known beacon ofhope, providing health care throughoutSouth Africa especially in rural areas. Thelaunch of <strong>Transnet</strong> Phelophepa II will allowus to reach communities that need it mostand demonstrates how public-privatesector partnerships can be used totransform lives of communities throughsocial entrepreneurship.”Malusi GigabaMinister of Public Enterprises12 March <strong>2012</strong>“This is an immensely importantphilanthropic engagement for Roche. Weare proud to have continuously grown oursupport for the Phelophepa healthcaretrain during the 18 years of sponsorship,because Phelophepa has such aremarkable impact on the lives ofthousands of people every year.”Franz HumerChairman of the Board of Directors, Roche“Colgate-Palmolive South Africa isextremely proud of its long associationwith Phelophepa. The on-board dentalclinic provides oral health services andhygiene education to communities in themost remote areas of South Africa. Wemust acknowledge the dedication of theacademics and students who havecommitted their time to the clinics andlook forward to our on-going partnership.”Bradley FarrGeneral Manager, Colgate-PalmoliveSouth Africa<strong>Sustainability</strong> performance: Social dividends<strong>Sustainability</strong> <strong>Report</strong> <strong>2012</strong>57
Social dividends (continued)Proactive stakeholder engagement<strong>Transnet</strong> has a wide range of stakeholders whose relationship with the business is integral to our sustainabilitycommitment. In 2011/12, many stakeholders were engaged in a variety of ongoing dialogues on economic,social and environmental issues.Every major capital investment project and every significant change to an operating system involves extensiveengagement with interested and affected parties – typically Government, customers, suppliers, employees,unions, financiers, media and communities. In the regulated parts of our business, there is interaction with theregulators. In all matters affecting labour, we have structured relationships with recognised trade unions.Long-term infrastructure planning is done in coordination with national, provincial and local government, otherSOCs, long-term customers and other logistics service providers. Relationships with our day-to-day customersreceive high levels of constant management attention. Communities in our areas of work are engaged on manyissues concerning safety, local economic development, the environment and CSI. With a growing regionalinterest, we are increasing interaction with embassies and trade missions in Africa. Road shows are becoming aregular feature in the Group Chief Executive’s diary as we seek to better communicate our ongoing work andplans. As an SOC, there is structured interaction with our Shareholder on all aspects of the <strong>Transnet</strong> business.We have recognised the need to monitor and analyse the outcomes of these engagements in a more systematicway in order to ensure that stakeholders’ concerns are systematically followed through to actions and thatoutcomes are reflected comprehensively in our sustainability reporting in years to come. Tracking allstakeholder engagements in a company as large and geographically diverse as <strong>Transnet</strong> is a challengingexercise but is receiving attention in <strong>2012</strong>/13.The following table summarises the material subjects of key stakeholder engagements held in 2011/12,highlighting areas of concern and <strong>Transnet</strong>’s response.Official opening of the Port of Ngqura from left: President Jacob Zuma, Minister Malusi Gigaba,<strong>Transnet</strong> Chairman Mafika Mkwanazi and <strong>Transnet</strong> Group Chief Executive Brian Molefe60
Stakeholder engagmentStakeholder group<strong>Transnet</strong>’sShareholder,Government andother SOCsRegulators and otherGovernment agenciesHow <strong>Transnet</strong> engages Shareholder’sCompactengagements. Quarterly reports,Annual report andCorporate Plan. SOCs CEOs,Chairman and ChiefFinancial Officerfora. Annual GeneralMeetings. Board engagementwith the ShareholderMinister, DeputyMinister and theDirector-General ofthe DPE. Bilateral meetingsbetween the DPE,<strong>Transnet</strong> andExecutivemanagement. Provincial visits bythe GCE and Ministerof PublicEnterprises. Business breakfastshosted by theMinister of PublicEnterprises. Meetings. Submissions.Main area ofstakeholder concern Progress againstNew Growth Pathcommitments. Meetingdevelopment stateobjectives. Infrastructureinvestment to createthe requiredcapacity. Operationalefficiencies. Skills developmentand job creation. Supplierdevelopment andlocalisation. Rural development. Regional integration. Performance againstShareholder’sCompact targets. Deliveringsustainable returns. Lowering the cost ofdoing business inSouth Africa. Policy alignmentwith Governmentdepartments. PFMA approvals. Financial strategy ofthe Company. Investor and fundingconcerns. Governance. Appropriateness oftariffs. Access to networkinfrastructure. Productivity andefficiency levels. Customer servicelevels.<strong>Transnet</strong>’s response Executing theQuantum Leapstrategy successfullyand fulfilling theCompany’s mandate. Participating inachievinginfrastructure thatmeets the needs ofthe growingeconomy. Earning anappropriate returnon invested capitaland maintaining astrong financialposition. Meeting the NGPobjectives. Support industrialcapacity building andjob creation. Undertaking theMDS. Secure revenuestreams. Closing the fundinggaps through PrivateSector Participation(PSP). Increasedtransparency.What <strong>Transnet</strong> hopesto achieve Greatercollaborationthereby creating anenablingenvironment forsuccessful executionof the MDS. Alignment on tariffmethodology andregulatory policy tocreate regulatorycertainty. Secure funding forrequired but notfunded in theR300,1 billion MDS. Managing the impactof regulation onrevenues.<strong>Sustainability</strong> performance: Social dividends<strong>Sustainability</strong> <strong>Report</strong> <strong>2012</strong>61
Social dividends (continued)Stakeholder groupHow <strong>Transnet</strong> engagesMain area ofstakeholder concern<strong>Transnet</strong>’s responseWhat <strong>Transnet</strong> hopesto achieveCustomers GCE road shows. Operating divisionCEO businessbreakfasts. Customersatisfactionfeedback andreports. Fact sheets,pamphlets andnewsletters. Annual customersatisfaction survey. Participation inindustry forums andSteeringCommittees. Regular directcustomerengagement. Consultativematters. Golf days. Service delivery. Innovation. Leadership. Reliability. Safety. Customer relationsand communication. Integrated accountmanagement tooptimiseopportunities acrossOperating divisionsto drive volumegrowth. <strong>Transnet</strong> pricing/tariff guidelines,best practicemethodology andmodels to sustaincapital investmentand support volumegrowth. Transparent capacityallocation frameworkand processes toensure fair allocationof capacity. Creating sufficientcapacity andimproving onoperatingefficiencies. Growingtransshipmentvolumes andestablishing SouthAfrica as atransshipment huband increasing overborder rail volumes. Undertaking theMDS. Alignment andcollaboration ongrowth andexpansion plans,detailed in keyaccount plans. Conclusion oflong-termtake-or-paycontracts.Suppliers andbusiness partners <strong>Transnet</strong> AcquisitionCouncil. B-BBEE fora. Publications and sitevisits. Stakeholderengagementmeetings. Supplier summits. Governance. Transparency. Suppliers partneringwith <strong>Transnet</strong> todeliver capital spendand achievelocalisation andempowermentobjectives.62
Main area ofStakeholder group How <strong>Transnet</strong> engages stakeholder concernEmployees, labour Strategic leadership Dignity and respect.unions and pensioners forum. Safety. <strong>Transnet</strong> Training and skillsRestructuringdevelopment.Committee. Remuneration. National BusinessCommittees. Culture. Local Business Queries from formerCommittees.employees onwhether they qualify Internet/intranet.for pensions. Memoranda from In November 2010,the GCE.the Portfolio Culture CharterCommittee on Publicchampions.Enterprises Correspondence withrecommended thatpensioners and fundcertain enhancedadministrators.benefits beimplemented for the Engagement with the pensioners of thePortfolio Committee <strong>Transnet</strong> Secondon Public Enterprises Defined Benefittogether withFund and thedefined benefit<strong>Transnet</strong> Sub-Fundpension funds.of the TransportPension Fundcomprising thepayment of fivemonths’ pensionbenefits as a bonus,an uplift of the basepensions andCPI-linked increases,targeting 75%of CPI.<strong>Transnet</strong>’s response Investing inemployee safety anddevelopment. Maintaining aperformance systemthat supportscontinuousimprovement. Informing employeesof key strategicinitiatives, policiesand procedures thatimpact theworkforce. Social responsibilityand reputationmanagement. Both funds haveprovided bonuses totheir pensioners offive months’ pensionbenefits. Neitherfund will implementa base uplift, as thisis tantamount toadjusting the salaryof employees at dateof retirement, andnot within the ambitof the funds. Bothfunds, which havead hoc bonus rules,will seek to payannual bonuses totheir pensioners thatresult in an annualincrease in pensionreceived linkedto CPI.What <strong>Transnet</strong> hopesto achieve Increase in labourproductivity todeliver on volumegrowth and MDStargets. Labour stability tosupport strategyexecution andcompetitiveness ofSouth Africa’sfreight logisticssystem. Building unionrelationships tosupport labourstability. Collaboration withorganised labour toensure businesssuccess.<strong>Sustainability</strong> performance: Social dividends<strong>Sustainability</strong> <strong>Report</strong> <strong>2012</strong>63
Social dividends (continued)Stakeholder groupHow <strong>Transnet</strong> engagesMain area ofstakeholder concern<strong>Transnet</strong>’s responseWhat <strong>Transnet</strong> hopesto achieveInvestors Quarterly reports,Annual <strong>Report</strong> andCorporate Plan. Investor road showsand presentations. Market feedback. Circulate anddistribute mediastatements issuedby <strong>Transnet</strong> beforethe statements areread in the media. Realising poorreturns on capitalinvestment. Financialperformance– Company’s abilityto deliver on itscommitments as setout in its strategy. Affordability ofcapital investmentplans. Sovereign concernsthat could lead to adowngrade of SouthAfrica andconsequently<strong>Transnet</strong>. Politicalinstability that canimpact interestrates and foreignexchange rates. Policy uncertainty. Regulatory tarifflower than<strong>Transnet</strong> needs. Volumes railed lowerthan planned – thusputting pressure onplanned cashflowfrom operationswhich in turnincreases fundingrequirement. Managing cash andworking capitalproactively. Diversifying sourcesof funding. Seeking innovativemeans for PSP. Exploring possibilityof ‘off-balancesheet’funding. Continued supportand access to costeffective funding tomeet requirements. Betterunderstanding of<strong>Transnet</strong> strategy. Enable investors tofeel comfortable toengage when they sorequire.Communities Partnerships,awareness. Campaigns. CSI initiatives. Employmentopportunities. Environmentalimpacts. Supporting keycommunitydevelopment issues. Beneficiation. Sustaining CSIinitiatives. Fostering mutuallybeneficialrelationships. Supportingcommunities in areasof operation. Demonstratingprinciples ofaccountability andcare. Increasing reach ofbeneficiaries. Identify and impartskills to potentialsuppliers atcommunity level,thus contributing tothe transformationof suppliers. A deeperunderstanding ofcommunity interests. Building trustedrelationships. Ensuring sustainablecommunitydevelopment, bybuilding trust withincommunities where<strong>Transnet</strong> hasestablished CSIprogrammes.64
Top 20 customer surveyIn October 2011, <strong>Transnet</strong> conducted a survey of its top 20 customers across Freight Rail, Rail Engineering,National Ports Authority, Port Terminals and Pipelines. Key findings included: same goals; <strong>Transnet</strong> was particularly commended for: Shortcomings identified included: Arising from this survey, <strong>Transnet</strong> has resolved to develop a Top 20 Customer Satisfaction Dashboard for regulartracking of customer views in order to proactively respond, at senior levels, to issues as they arise.The 2011 customer survey has highlighted <strong>Transnet</strong>’s need to: This resolve is embedded in the MDS.<strong>Sustainability</strong> performance: Social dividendsPort Elizabeth Car Terminal<strong>Sustainability</strong> <strong>Report</strong> <strong>2012</strong>65
Social dividends (continued)Iron ore line expansion stakeholder engagementThe iron ore line expansion project, a joint initiative of<strong>Transnet</strong> and its iron ore mining customers, now in anadvanced feasibility study phase, will increase the capacityof the Sishen-Saldanha export corridor from 60mtpa to90mtpa through rail and port infrastructure upgrades.Stakeholder engagement was identified as a priorityworkstream for project planning and risk mitigation in thefeasibility phase, particularly given the sensitivity ofstakeholders and the natural environment.The stakeholder process began in October 2011, broadlydivided into port and rail components. The portengagement involved stakeholders from the Port ofSaldanha Bay and surrounding areas of Langebaan andVredenburg. The rail stakeholders were from towns alongthe West Coast and in the Northern Cape situated adjacentto the railway line. The objectives included: to informstakeholders on the background and purpose of theproject, engage on the project process to be followed,engage on various development options, and to buildsustainable relationships.Key issues raised by port stakeholders included: dust, nodevelopment in Big Bay, trust that can be placed in<strong>Transnet</strong> and the mining houses, and benefits to be accruedto local communities.Key issues raised by rail stakeholders included: noise andvibration, veld fires, community safety, wetlandsprotection, and trust that can be placed in <strong>Transnet</strong> and themining houses.Through well attended and animated community forumsheld between October 2011 and February <strong>2012</strong>, a numberof ‘wins’ were identified and a good foundation of trust wasbuilt on which to proceed. <strong>Transnet</strong> however, acknowledgesthat this foundation will be eroded if concerted efforts toaddress issues of concern in a structured way are notimplemented. The outcomes are the following: companies in Saldanha and along the railway line; throughout the project; mechanism; steps to identify opportunities for local economicbenefits and skills training; veld fires, safety, local benefits; and issues throughout.Iron ore train66
Employee Retirement ProvisionsThe <strong>Transnet</strong> Retirement Fund (the Fund) is an independent legal entity established in terms of the<strong>Transnet</strong> Pension Fund Amendment Act No 41 of 2000 and is managed and governed by a Board ofTrustees. The administrator of the Fund is Metropolitan Retirement Administrators. The Fund is a dailyunitised defined contribution arrangement offering member choice - investment risks are carried by themembers of the Fund and not the participating employers. The value of the benefits that ultimatelyaccrues to members is determined by the accumulation of contributions directed towards retirementfunding, together with investment returns, net of taxes and on-going investment management charges.The Fund provides retirement, death and withdrawal benefits for employees of the participatingemployers on their retirement or upon termination of service for other reasons, as well as benefits forthe dependents of members in the event of their death. Members contribute at a rate of 7,5% of eachmember’s pensionable salary matched by the participating employers’ contributions of 7,5% of eachmember’s pensionable salary. In addition, participating employers contribute 4,5% of each member’spensionable salary. These contributions are used to Fund risk premiums, administration costs andother fund expenses. The Fund offers a number of distinct investment portfolios that offer superiorrisk and return characteristics relative to inflation, which are appropriate for members with differenttime horizons to retirement. The number of members in the Fund at 31 March <strong>2012</strong> was 62 326(2010/11: 60 314).<strong>Sustainability</strong> performance: Social dividends<strong>Transnet</strong> Second DefinedBenefit FundThe <strong>Transnet</strong> Second Defined BenefitFund (TSDBF) is a closed fund ofpensioners with no new membersentering. This poses significantchallenges to ensuring sustainablebenefits for these members. TheBoard of Trustees of the TSDBF havehad extensive engagements withmembers, <strong>Transnet</strong> and Parliament inrecent years in order to ensure thatmembers receive optimum benefitsfrom available funds.Refer to Volume 1for further details.LOOKING AHEAD<strong>Transnet</strong>’s social dividends are being further enhancedin <strong>2012</strong>/13 by:Accelerated diligence on governance, risk management,compliance, and fraud and corruption prevention forMDS implementation.Improved EE, particularly for women and PWDs.Heightened safety efforts to achieve zero fatalities.Level 3 B-BBEE rating in <strong>2012</strong>/13 to achieve Level 1 by2016/17.Roll-out of Phelophepa II community health care trainfacility.Measurable success in <strong>Transnet</strong> Foundation’s teacherdevelopment programme.Tracking of stakeholder engagements across <strong>Transnet</strong>.<strong>Sustainability</strong> <strong>Report</strong> <strong>2012</strong>67
Environmental dividends“Everyone has the right to have the environment protected, for the benefit of presentand future generations, through reasonable legislative and other measures thatprevent pollution and ecological degradation, promote conservation and secureecologically sustainable development and use of natural resources while promotingjustifiable economic and social development.”These are the systemic environmental challenges which <strong>Transnet</strong> faces:Constitution of the Republic of South Africa, 1996 ransnet’s business is conducted across South Africa’s rich ecosystems: in coastal waters, overmountains, rivers, wetlands, semi-deserts, valleys, forests, fynbos and veld. Through these systems, webuild infrastructure, operate equipment, and handle large volumes of cargo. Every day, our employees,contractors, suppliers and customers have an impact on the natural environment and depend on it fortheir livelihoods. Our responsibility is to mitigate this impact and protect our invaluable natural heritage. primary source of energy, is supplied by South Africa’s coal-fired power stations which emit largequantities of greenhouse gases (GHG) into the earth’s atmosphere, contributing to global warming. Diesel,imported from oil-extracting countries and manufactured by emissions-intensive processing locally, emitsGHG at a high cost to the environment, both in climate change and localised air quality. We use water buthave not yet quantified how much we can save. We comply with waste management regulations but havenot yet pursued deliberate recycling strategies. year to power stations and export facilities, and continues to invest in new railway capacity to meet therelentless demand for coal from growing economies both locally and abroad. We are mindful that this isboth a value proposition and a long-term risk as the world seeks renewable forms of energy tosustainably support burgeoning populations. erratic and violent weather events, particularly coastal storms and floods. Our infrastructure planning isbeing adapted accordingly. Water scarcity adaptation measures are also needed.In recent years, our focus has been on environmental impact mitigation plans for infrastructure projectsand environmental regulation compliance. In these, <strong>Transnet</strong> is acclaimed for innovative biodiversityprotection and sound environmental management practices. These efforts continue and will be furtherenhanced in the years ahead. Our environmental focus is now expanding to encompass initiatives inenergy, carbon, water and waste.68
Environmental dividends (continued)Total electricity consumptionfor 2011/12Freight Rail traction 68,0%Freight Rail property 6,0%<strong>Transnet</strong> Property 3,0%Rail Engineering 11,0%Pipelines 6,0%Port Terminals 5,0%National Ports Authority 1,0%Total traction electricity2011/12Iron ore line 14,0%GFB 59,0%Coal line 27,0%Energy efficiency<strong>Transnet</strong>’s total electricity consumption in 2011/12 was approximately3 792 146MWh. 68,0% of this was used for Freight Rail traction; 9,0% inbuildings; and the remainder in <strong>Transnet</strong>’s ports, pipelines and rail engineeringoperations.<strong>Transnet</strong>’s total fuel consumption in 2011/12 was 227 934 079 litres. 62,0%of this was used by Freight Rail diesel locomotives; 3,9% by National PortsAuthority for tugs and pilot boats; 7,7 % by Port Terminals mainly for straddlecarriers; and the remainder in other <strong>Transnet</strong> operations including RailEngineering.Energy efficiency is an imperative for <strong>Transnet</strong>, specifically as we implementthe MDS which requires more electricity and more diesel to move largervolumes, in circumstances of severe electricity supply constraints, sharplyincreasing electricity and fuel prices, and the advent of carbon taxes.Efficiency gains are however, particularly challenging for Freight Rail tractivepower, <strong>Transnet</strong>’s largest energy consumer, where only new locomotivetechnology is able to introduce meaningful energy savings per ton kilometre.As Freight Rail buys and commissions new locomotive fleets as part of theMDS, it will be able to show increased energy efficiency over time.To indicate the levels of energy efficiency that can be achieved in the newlocomotives, Freight Rail has been measuring the regenerative capabilities ofnew fleets on the coal and iron ore lines. With the introduction of 100 newClass 19E locomotives on the coal line, Freight Rail records thatapproximately 10,0% of the energy consumed in these locomotives isregenerated for own use on the coal line. On the iron ore line, the 44 newClass 15E locomotives regenerate approximately 20,0% of their energyconsumption back into the Eskom grid, on a round trip between Sishen andSaldanha. The coal and iron ore lines are Freight Rail’s most streamlined andoperationally efficient businesses and these levels of energy efficiency areunlikely to be replicable on the general freight network.The calculation of electricity regeneration is not straightforward and FreightRail is currently investigating technology installations in some sub-stations tocapture the regenerative electricity discharged by locomotives back into thesystem. Tracking of regeneration is complicated by, amongst other factors,the need to use different configurations of locomotives (old and new, electricand diesel interchangeably on a single train set), train scheduling, electricitysub-station locations, and route gradients.At the Port of Ngqura Container Terminal, Port Terminals has installed six newLiebherr STS cranes. In 2011/12, Port Terminals metered the electricity usageand regenerative capabilities of this new equipment and has concluded that20,0% of electricity used by the cranes is regenerated.For the MDS forecast volumes, we have estimated that all <strong>Transnet</strong>’soperations (rail, port and pipelines) will need between 44,0% and 65,0% moreelectricity over the next seven years than we used in 2011/12. Grid electricitysupply to meet this demand is not certain and is registered by <strong>Transnet</strong> as asignificant risk to MDS.70
In March <strong>2012</strong>, the Minister of Public Enterprises asked all SOCsto implement energy saving initiatives in buildings under theirmanagement. In response, <strong>Transnet</strong> has taken the following steps: divisions and <strong>Transnet</strong> Property to introduce everydayelectricity conservation measures and manage emergencyswitch-off where required; water tanks to heat pumps, power factor correction to controlpeak power consumption, a building management system toreduce air conditioning plant consumption and lightingcontrol, installation of prepaid meters to ensure correctrecovery of electricity consumption, introduction of naturallighting, replacing electrical stoves with gas, introductionof temperature sensors in geysers and in air conditioningsystems and the insulation of piping to retain temperatures; implemented to record electricity use and action plans forevery building in <strong>Transnet</strong> on a monthly basis; being implemented to reach all <strong>Transnet</strong> employees; Management programme are replacing inefficient lighting inspecified <strong>Transnet</strong> buildings; and efficiency in lighting, heating and cooling solutions atits manufacturing sites and depots.The energy efficiency focus for <strong>2012</strong>/13 targets initial savingsper unit of production, wherever immediately feasible, and aimsto improve the Company’s systems, equipment and technologyfor monitoring consumption and savings. These steps will befollowed in subsequent years by more specific energy efficiencymeasures appropriately designed for different parts of thebusiness.COAL LINE100 NEW CLASS 19ELOCOMOTIVES10,0% ENERGYREGENERATEDIRON ORE LINE44 NEW CLASS 15ELOCOMOTIVES20,0% ENERGYREGENERATED<strong>Sustainability</strong> performance: Environmental dividendsEnergyefficiency targets<strong>2012</strong>/13ElectricityefficiencymeasuresTargets <strong>2012</strong>/13% savingson 2011/12DieselefficiencymeasuresTargets <strong>2012</strong>/13% savingson 2011/12Freight Rail traction kWh/ton km 3,0% Litres/ton km 3,0%Freight Rail property kWh/m 2 3,0% n/a n/aRail Engineering kWh/man-hour 4,0% Litres 4,0%National Ports Authority kWh 4,0% Litres –Port Terminals kWh/ton 5,0% Litres/ton km 2,7%<strong>Transnet</strong> Property kWh/m 2 5,0% n/a n/aPipelines n/a 0% n/a n/a<strong>Sustainability</strong> <strong>Report</strong> <strong>2012</strong>71
Environmental dividends (continued)Climate change mitigation and adaptationSouth Africa made an international commitment in 2009 to reduce its GHG emissions by 34,0% and 42,0% by2020 and 2025 respectively; to plateau emissions for 10 years thereafter; and to decline emissions from2036. In October 2011, Government released the National Climate Change Response White Paper, aiming overthe next two years to establish sector-specific GHG emission reduction outcomes and carbon budgets whichwill translate into company-specific emission reduction outcomes. Companies and economic sectors will berequired to submit mitigation plans to achieve the desired outcomes. Carbon pricing, with a possible carbontax, will then be introduced.In February <strong>2012</strong>, the DPE advised SOCs to develop specific climate change strategies in line with theirmandates that support a low-carbon economic growth trajectory with opportunities for green industryjobs growth.As a first step in embedding a climate change response strategy into our business, <strong>Transnet</strong> completed itscarbon footprint study in 2011/12. <strong>Transnet</strong> will be participating in the voluntary Carbon Disclosure Projectfrom <strong>2012</strong>/13.For the year 2011/12, <strong>Transnet</strong> accounted for 4,31mt C0 2equivalent. This is approximately 1,0% of the SouthAfrica’s total transport sector emissions and approximately 10,0% of South Africa’s total GHG emissions in2011/12. <strong>Transnet</strong> ranks as the 10 th largest GHG emitter in South Africa in 2011/12. South Africa is a majorcontributor globally, ranking 14 th in GHG emissions.EskomSasolBHP BillitonArcelorMittalSAAnglo AmericanGold FieldsPPCHarmony GoldEvraz Highveld Steel<strong>Transnet</strong>SappiMondi Group16,616,410,55,95,35,04,64,34,22,070,9230,30 50 100 150 200 250Million tons CO 2equivalentSource: Carbon Disclosure Project, <strong>2012</strong>72
<strong>Transnet</strong>’s total carbon emissionsScope 1: Direct GHG emissions (mostly diesel)Scope 2: Indirect GHG emissions (mostly grid electricity)Scope 3: Indirect emissions not in Scope 2 (mostly air travel and car hire) 2e = 4,31m14,8%571 18885,0%3 737 993Scope 1Freight Rail accounts 2eScope 2Freight Rail accounts 2e78,0%445 960TFR75,0%2 803 104TFR15 399 2,7%TRE416 275 11,1%TRE3 307 0,5%TPL213 299 5,7%TPL<strong>Sustainability</strong> performance: Environmental dividends0,2%65 509 11,4%TPT183 865 4,9%TPT4,7%27 176TNPA1,6%60 080TNPA2,4%13 8371,6%61 3696 836Scope 1 Scope 2 Scope 3Scope 2 emissions accountfor 85% of <strong>Transnet</strong>’s totalemissionsScope 3 2erecorded 0,2%31,4%2 341TFR20,1%1 499TRE2,1%158TPL9,1%680TPT15,3%1 137TNPA22,0%1 639<strong>Transnet</strong>’s indirect (Scope 2) emissions (largely grid electricity usage) account for 85,0% of <strong>Transnet</strong>’s totalemissions. 75,0% of these Scope 2 emissions are accounted for by Freight Rail. Freight Rail is also the largestemitter of <strong>Transnet</strong>’s direct (Scope 1) emissions (largely diesel) and other indirect (Scope 3) emissions.In the year ahead we will use this GHG emissions inventory to design specific mitigation plans and initiativesacross <strong>Transnet</strong>. Focus areas for <strong>2012</strong>/13 are to establish Company policy positions and initial managementplans for: <strong>Transnet</strong>’s R300,1 billion capital expenditure plan for the next seven years offers large-scale opportunity forgreening the Company’s supply chain and introducing new, environmentally sound technologies into thebusiness. Procurement policies and specifications are being designed accordingly.<strong>Transnet</strong>’s Long-Term Planning Framework (our 30-year planning horizon for rail, port and pipelineinfrastructure which is updated annually) now incorporates a clear sustainability focus, included in which is anew initiative to develop innovative long-term energy planning; long-term climate change adaptation planning;and strategic environmental impact assessments.<strong>Sustainability</strong> <strong>Report</strong> <strong>2012</strong>73
Environmental dividends (continued)Water use efficiencyIn a water scarce country, we need to ensure that we utilisewater efficiently and effectively throughout our operations.While water use efficiency has been initiated at some of<strong>Transnet</strong>’s operational sites, we need reliable metering systems,specific targets and an agreed plan for water use efficiencythroughout the business. In <strong>2012</strong>/13 <strong>Transnet</strong> will improve itsmonitoring of water consumption, analyse trends, and developplans to reduce consumption and prevent water wastage.Approved plans will be implemented thereafter.Waste management optimisationThe promulgation of the National Environmental Management:Waste Act No 59 of 2008 has placed various responsibilities onwaste generators. <strong>Transnet</strong>’s operations and processes generatea variety of waste materials as by-products.<strong>Transnet</strong> is committed to developing sustainable ways tomanage and dispose of this waste. Opportunities for wasterecycling will be given further attention in the year ahead.Iron ore travelling on conveyerCurrent important waste management initiatives includethe following:Asbestos clean-upThe most significant contamination challenge addressed during2011/12 concerned legacy asbestos issues in rail operatingareas. Asbestos contamination has occurred in two ways:historic spillages during the transportation of asbestos frommines; and the historical use of asbestos products in buildings.A register of buildings containing asbestos is maintained by<strong>Transnet</strong> Property and reviewed annually to ensure that there isno exposure that has occurred that will create an obligation asrequired by legislation. Environmental conditions such as windsand rains have, over time, been contributing to the spread ofasbestos fibres in a number of operational areas and along therailway lines. In 2011/12 <strong>Transnet</strong> committed R788 million tocleaning up this asbestos legacy of which only R23 million wasspent. This slow progress is attributed to a new regulatoryprocess involving environmental approvals and waste licencesfor rehabilitation of the sites.Workers at Port of Richards BayFreight Rail committed a total of R450 million to cleaning upasbestos spills and contamination by 2015/16. Most of theclean-up was undertaken in the Northern Cape, in response toasbestos exposure that interfered with infra-maintenance –asbestos that was buried and uncovered during the removal ofrail line, sleepers and ballast. The exposure was remediated incompliance with the requirements of the Occupational Health and74
Safety Act, 1993 and section 28 of the National EnvironmentalManagement Act, 1998; and disposed at registered landfill sites.A total of 95 710kg was removed from an area coverage of17 464m 2 . Expenditure to date is R4,1 million. The main challengethat affected sustained expenditure was the requirement to obtainwaste licences in terms of the National Environmental: Waste Act,2008. Waste licences for clean-up were obtained in March <strong>2012</strong>from the Department of Environmental Affairs, enabling cleaningefforts to accelerate in <strong>2012</strong>/13.<strong>Sustainability</strong> performance: Environmental dividendsIn 2011/12 Rail Engineering committed R107 million over threeyears, to cleaning up asbestos contamination at its sites, of whichR21 million was spent. In the year ahead, Rail Engineering willconduct soil analyses in Koedoespoort to determine the extent ofburied asbestos.<strong>Transnet</strong> Property will initiate an analysis and subsequentrehabilitation of the Culemborg and Kloofeind sites in theyear ahead.Hydrocarbon clean-upIn compliance with the National Environmental Management ActNo 107 of 1998, Freight Rail identified 70 areas contaminated byhydrocarbon (oil and diesel) pollution. The clean-up commenced inApril 2011 and is being rolled out over the next three years. Theclean-up involves cleaning the identified site and putting newcontrol measures in place, including absorbent mats and drip trayswhich absorb and trap the oil and diesel spillages to preventfurther pollution. Freight Rail’s budget for the clean-up isR34 million and to date, 18 sites have been rehabilitated.Rehabilitation is to be concluded in March 2013. Pipelines iscurrently cleaning-up sites in Kliprivier, Ladysmith andMagaliesburg and hopes to complete this by March 2013.Changing cartridges in the manganesedust monitoring systemScrap steel and oil recyclingPort Terminals has implemented a reverse logistics process inorder to ensure oil and scrap steel are disposed of for reuse notlandfill disposal. A total of 6 552 tons of scrap steel and 235 000litres of used oil were recycled during 2011/12.Biodiversity enhancementThe nature of <strong>Transnet</strong>’s business activities lends itself toincreased environmental exposures primarily due to the nature ofcommodities transported across <strong>Transnet</strong>’s extensive port, rail andpipeline network. <strong>Transnet</strong> aims to be a leading company forenvironmental management and compliance, and has alreadycreated several opportunities for best practice in the field ofenvironmental management.SHEQ officials at the Port ofPort Elizabeth<strong>Sustainability</strong> <strong>Report</strong> <strong>2012</strong>75
Environmental dividends (continued)NMPPThe endangered giant bullfrogAs a greenfields project, the NMPP had as one of its objectivesto ensure sustainable infrastructure development. During theconstruction phase, the NMPP traversed several wetlands thatwere habitat to the endangered giant bullfrog. <strong>Transnet</strong>developed a biodiversity offset plan for the wetlands that wereimpacted by the construction of Terminal 2 of the pipeline nearHeidelberg. With the bullfrog pan being so close to the terminalsite, every effort was made to protect the species duringconstruction by introducing protective catch fences to preventthe bullfrogs from entering the construction site. The fence wasclosely monitored on a daily basis and frogs that did manage toget through the fence were taken out of the construction areaand safely relocated. Further risk will be mitigated in the comingyear by facilitating the construction of concrete culverts alongthe route and also by constructing drift fences to guide the frogsas they migrate.Port of NgquraA marine biologist tagging juvenile fishat the Port of NgquraThe Port of Ngqura is habitat to approximately 47 species offish indicating a diverse ichthyofauna. The port provides a hardsubstrata habitat that is very different to the soft sedimenthabitat characteristic of the adjacent sandy beach environment.As a result, the port has the potential to alter the distribution,diversity and abundance of the fish species in the coastalenvironment. It has been suggested that the abundance of fishspecies could be an indication of the good biological status ofthe port. Throughout the construction of the port, care wastaken to ensure that the natural habitat of the fish species isprotected. A study conducted between September 2006 andSeptember 2007 indicates that the fish assemble between threehabitats in the port: dolosse, quay wall and sandy shore. The portis effectively a sheltered extension of the marine environmentand provides a refuge for marine species on an otherwisehigh-energy coast.Port of DurbanThe Bayhead Natural Heritage Site (BNHS) comprisesapproximately 13 hectares of mangrove forest and sevenhectares of secondary coastal grassland. The BNHS is situatedon prime industrial land bordered on one side by Pier 2 containerterminal. The Bayhead mangroves and adjacent intertidal mudand sand flats constitute one of the few areas in the Port ofDurban that reflect the Bay’s once diverse and rich naturalheritage. National Ports Authority is committed to managing theenvironment including the protection of the BNHS and has setthis area aside for conservation in order to ensure that thisportion of land remain as part of the historical habitat of thePort of Durban.Mangrove forest at Bayhead NationalHeritage Site76
A new estuary management plan to promote the sustainable useof the Port of Durban has been developed by National PortsAuthority in partnership with the Ethekweni Municipality, theKwaZulu-Natal Department of Agriculture, Environmental Affairsand Rural Development. The plan’s main objective is to promotethe sustainable use of the estuarine resources, looking at issuessuch as water quality, waste management, social and economicuses, development and the protection of the remaining estuarinehabitat.Port of Richards Bay<strong>Sustainability</strong> performance: Environmental dividendsNational Ports Authority is implementing an Erosion MitigationPlan for the Natural Heritage Site at the Port of Richards Bay.Total project cost is R50 million. It involves the protection ofsensitive mangrove swamps from the detrimental effects ofunnatural waves created by vessels in the port through installinga floating breakwater system made of concrete pontoons. Thepontoons quell these waves before they reach the mangroveswamps, protecting the mangroves from being destroyed.Pontoons at the Port of Richards BayLOOKING AHEAD<strong>Transnet</strong>’s environmental dividends focus for<strong>2012</strong>/13 is on:Growing volumes on rail and measuring the carbonemissions reduction impact.Energy efficiency improvements of between 3,0%and 6,0%.Energy planning for both energy security and climatechange mitigation.Water use monitoring.Waste management, focusing on legacy asbestosclean-up and hydrocarbon clean-up.Port of Cape TownParticipation in the Carbon Disclosure Project.<strong>Sustainability</strong> <strong>Report</strong> <strong>2012</strong>77
Global <strong>Report</strong>ing Initiative tableG3 indicatorStrategy and Profile1. Strategy and analysis1.1 Senior decision-makers’ statement aboutthe relevance of sustainability to theorganisation and its strategy1.2 Description of key impacts, risks andopportunitiesReferenceAddressed in the Board and Executive sustainabilitystatements in the SR (page 6 and 7) and the ExecutiveStatement in the IR (page 45).Impacts, risks and opportunities are highlightedthroughout the SR and IR. In addition, see <strong>Transnet</strong> GroupTop 10 Risks in the IR (page 46).2. Organisational profile2.1 Name of reporting organisation <strong>Transnet</strong> SOC Ltd.2.2 Primary products and services An overview of the Company’s primary products andservices are provided in the Operating divisions overviewin the SR (pages 10 and 11) and the Operating divisionhighlights in the IR (pages 14 and 15).2.3 Organisational operating structure An overview of <strong>Transnet</strong>’s organisational operatingstructure is provided in the Company overview in the SR(page 5) and the IR (page 13).2.4 Location of the organisation’sheadquarters2.5 Countries where the organisation<strong>Transnet</strong>’s operations are limited to South Africa.operates2.6 Nature of ownership and legal form <strong>Transnet</strong> SOC Ltd operates as a corporate entity (SOC),with its sole shareholder being the Government of SouthAfrica.2.7 Markets served See Operating divisions overview in the SR (pages 10and 11) and the Operating division highlights in the IR(pages 14 and 15).2.8 Scale of the reporting organisation See Company overview and Operating divisions overview inthe SR (pages 5, 10, 11) and the IR (pages 13, 14 and 15).2.9 Significant changes during the reporting No significant changes during the reporting period.period2.10 Awards achieved See Operational reviews in the IR (pages 78 to 125).3. <strong>Report</strong> parameters3.1 <strong>Report</strong>ing period 1 April 2011 – 31 March <strong>2012</strong>.3.2 Date of most recent previous report 31 March 2011 Integrated Annual <strong>Report</strong>.3.3 <strong>Report</strong>ing cycle Annual.3.4 Contact point See About the <strong>Sustainability</strong> <strong>Report</strong> in the SR (page 3)and About the Integrated <strong>Report</strong> in the IR (page 6).3.5 Process of defining report content See About the <strong>Sustainability</strong> <strong>Report</strong> in the SR (page 3)and About the Integrated <strong>Report</strong> in the IR (pages 2 to 7).78
GRI tableG3 indicatorReference3.6 Boundaries of report This report covers all areas under which <strong>Transnet</strong> hasoperational control. See About the <strong>Sustainability</strong> <strong>Report</strong>in the SR (page 3) and About the Integrated <strong>Report</strong> in theIR (pages 2 to 7).3.7 Limitations This report covers all areas under which <strong>Transnet</strong> hasoperational control. See About the <strong>Sustainability</strong> <strong>Report</strong>in the SR (page 3) and About the Integrated <strong>Report</strong> in theIR (pages 2 to 7).3.8 Basis for reporting on joint ventures andsubsidiaries<strong>Transnet</strong> has no significant active subsidiaries or jointventures in which it has operational control.3.9 Data measurement techniques <strong>Transnet</strong> does not currently report on this indicator.3.10 Explanation of effect of restatements No restatements.3.11 Significant changes No significant changes for 2011/12.3.12 GRI index The full GRI table appears at the back of the SR (pages 78to 84).3.13 Assurance Currently <strong>Transnet</strong> only provides assurance on financialinformation.4. Governance, commitments and stakeholder engagement4.1 Governance structure See Corporate Governance report in the AFS (page 156).4.2 Indicate whether the Chair of the highestgovernance body is also an executiveofficerThe Chairman, Mr Mkwanazi, is a Non-executive Director.4.3 Number of non-executive members The Board comprises 18 Directors, of which 16 are NonexecutiveDirectors.4.4 Mechanisms for stakeholders andemployees to provide recommendationsto the <strong>Transnet</strong> Board4.5 Linkage between compensation andperformance4.6 Processes for managing conflicts ofinterest4.7 Process for determining qualificationsand expertise4.8 Internally developed statements ofmission or values, codes of conduct,and principles relevant to economic,environmental and social performanceSee Stakeholder Engagement section in the SR (pages 61to 64) and the IR (pages 133 to 137).See Remuneration report within Directors’ report in theAFS (page 32).See Declarations of Interest in the SR (page 47) and theCorporate Governance report in the AFS (page 156).See Corporate Governance report in the AFS (page 156).See Code of Ethics in the SR (page 47) and CorporateGovernance report in the AFS (page 156).4.9 Board oversight of CSR policies and risk See Corporate Governance report in the AFS (page 156).management4.10 Performance evaluation process See Corporate Governance report in the AFS (page 156).<strong>Sustainability</strong> <strong>Report</strong> <strong>2012</strong>79
Global <strong>Report</strong>ing Initiative table (continued)G3 indicator4.11 Explanation of how the precautionaryapproach or principle is addressed by theorganisation4.12 Externally developed, voluntaryeconomic, environmental and socialcharters, sets of principles, or otherinitiativesReferenceAlthough no formal adherence to “the precautionaryprinciple” is applied, <strong>Transnet</strong> seeks to have a minimalnegative impact on its stakeholders, society and theenvironment.See Corporate Governance report in the AFS (page 156).4.14 List of stakeholder groups See Stakeholder Engagement section in the SR (pages 61to 64) and the IR (pages 133 to 137).4.15 Basis for identification and selection ofstakeholders<strong>Transnet</strong> identifies its stakeholders as the groups andentities upon which <strong>Transnet</strong>’s activities have a significantinfluence, and vice versa.4.16 Approaches to stakeholder engagement See Stakeholder Engagement section in the SR (pages 61to 64) and the IR (pages 133 to 137).4.17 Key topics and concerns raised duringstakeholder engagementEconomicEconomic performanceEC1 Direct economic value – revenues,operating expenses, employeecompensation, donation and othercommunity investments, retainedearnings, and payments to capitalproviders and governmentsEC2EC3EC4Financial implications and other risksand opportunities for the organisation’sactivities due to climate changeCoverage of <strong>Transnet</strong>’s defined benefitplan obligationsSignificant financial assistance receivedfrom the GovernmentSee Stakeholder Engagement section in the SR (pages 61to 64) and the IR (pages 133 to 137).See Appendix B in the IR (pages 132 and 133).See Climate Change mitigation and adaptation section inthe SR (pages 72 and 73).See note 32 Post-retirement Benefit Obligations in theAFS (page 107).<strong>Transnet</strong> has not received any financial assistance fromGovernment.Market presenceEC5 Range of ratios of standard entry levelwage compared to local minimum wage atsignificant locationsEC6EC7Policy, practices, and proportion ofspending on locally-based suppliers atsignificant locations of operationsProcedures for local hiring and proportionof senior management hired from thelocal community at significant locationsof operations indirect economic impacts<strong>Transnet</strong> does not currently report on this indicator.See Local Supplier Industry Development in the SR(page 42) and Supplier Development Programme in the IR(page 48).<strong>Transnet</strong>’s EE plan articulates the Company’s ongoingand sustained commitment to achieve a workforce thatreflects the national economically active population ofSouth Africa across all occupational levels.80
GRI tableEC8EC9G3 indicatorDevelopment and impact ofinfrastructure investments and servicesprovided primarily for public benefitthrough commercial, in-kind, or pro bonoengagementUnderstanding and describing significantindirect economic impacts, including theextent of impactsEnvironmentalReferenceSee CSI section in the SR (pages 57 to 59) and the IR(page 47).See Operational Reviews in the IR (pages 78 to 125).MaterialsEN1 Materials used by weight or volume <strong>Transnet</strong> does not currently report on this indicator.EN2 Percentage of materials used that are <strong>Transnet</strong> does not currently report on this indicator.recycled input materialsEnergyEN3EN4EN5EN6EN7Direct energy use segmented by primarysourceIndirect energy consumption by primarysourceEnergy saved due to conservation andefficiency improvementsInitiatives to provide energy-efficient orrenewableenergy-based products and services, andreductions inenergy requirements as a resultInitiatives to reduce indirect energyconsumption and reductions achievedSee energy use data in Energy Efficiency section in the SR(pages 70 to 71).See energy use data in Energy Efficiency section in the SR(pages 70 to 71).Energy saving initiatives are currently being identified.See Energy Efficiency section in the SR (pages 70 to 71).<strong>Transnet</strong> has been measuring the regenerativecapabilities of new locomotive fleets on the coal and ironore lines and further such initiatives will be explored andimplemented in the year ahead. See Energy Efficiencysection in the SR (pages 70 to 71).<strong>Transnet</strong> will explore such initiatives in the year ahead.See Energy Efficiency section in the SR (pages 70 to 71).EN8 Total water withdrawal by source <strong>Transnet</strong> does not currently report on this indicator butwill be monitoring and developing plans to reduce waterconsumption in the year ahead across the business. SeeWater Use Efficiency section in the SR (page 74).EN9EN10Water sources significantly affected bywithdrawal of waterPercentage and total water volume ofwater recycled and reused<strong>Transnet</strong> does not currently report on this indicator butwill be monitoring and developing plans to reduce waterconsumption in the year ahead across the business. SeeWater Use Efficiency section in the SR (page 74).<strong>Transnet</strong> does not currently report on this indicator butwill be monitoring and developing plans to reduce waterconsumption in the year ahead across the business. SeeWater Use Efficiency section in the SR (page 74).BiodiversityEN11 Location and size of land owned, leased ormanaged in biodiversity-rich habitats<strong>Transnet</strong> does not currently report specifically onbiodiverse rich areas as separate from the environmentin general.<strong>Sustainability</strong> <strong>Report</strong> <strong>2012</strong>81
Global <strong>Report</strong>ing Initiative table (continued)EN12G3 indicatorDescription of significant impacts ofactivities, products, and services onbiodiversity in protected areas andareas of high biodiversity value outsideprotected areasReference<strong>Transnet</strong> does not currently report specifically onbiodiverse rich areas as separate from the environmentin general.EN13 Habitats protected or restored See Biodiversity Enhancement section in the SR (pages75 to 77).EN14EN15Strategies, current actions andfuture plans for managing impacts onbiodiversityNumber of IUCN Red List species andnational conservation list species withhabitats in areas affected by operations,by level of extinction risk<strong>Transnet</strong>’s Operating divisions have environmentalmanagement systems in place to prevent and manageimpacts on the environment.<strong>Transnet</strong> does not currently report on this indicator.Emissions, effluent and wasteEN16EN17EN18EN19EN20EN21EN22EN23EN24Total direct and indirect greenhouse gasemissions by weightOther relevant indirect greenhouse gasemissions by weightInitiatives to reduce greenhouse gasemissions and reductions achievedEmissions of ozone-depleting substancesby weightNOx, Sox and other significant airemissions by weight and typeTotal water discharge by quality anddestinationTotal amount of waste by type anddisposal methodTotal number and volume of significantspillsWeight of transported, imported,exported or treated waste deemedhazardous under the terms of the BaselConvention Annex I, II, III, and VIII, andpercentage of transported waste shippedinternationallySee <strong>Transnet</strong>’s Total Carbon Emissions inventory in the SR(page 73).See <strong>Transnet</strong>’s Total Carbon Emissions inventory in the SR(page 73).<strong>Transnet</strong> will use the carbon emissions inventory inthe year ahead to design specific mitigation plans andinitiatives across <strong>Transnet</strong>. See <strong>Transnet</strong>’s Total CarbonEmissions inventory in the SR (page 73).<strong>Transnet</strong> does not currently report on this indicator.<strong>Transnet</strong> does not currently report on this indicator.<strong>Transnet</strong> does not currently report on this indicator.<strong>Transnet</strong> is committed to developing sustainable ways tomanage and dispose of waste. Opportunities for wasterecycling will be given further attention in the year ahead.See Waste Management Optimisation in the SR (pages 74and 75).<strong>Transnet</strong> does not currently report on volumes of spills.<strong>Transnet</strong> does not currently report on weight of waste andhazardous materials.82
GRI tableEN25G3 indicatorIdentify, size, protected status andbiodiversity value of water bodies andrelated habitats significantly affected bythe reporting organisation’s discharges ofwater and runoffReference<strong>Transnet</strong> does not currently report on this indicatorProducts and servicesEN26EN27ComplianceEN28TransportEN29Initiatives to mitigate environmentalimpacts of products and services, andextent of impact mitigationPercentage of products sold and theirpackaging material that are reclaimed bycategoryMonetary value of significant fines andtotal number of non- monetary sanctionsfor non-compliance with environmentallaws and regulationsSignificant environmental impacts oftransporting products and other goodsand materials used for <strong>Transnet</strong>’soperations, and transporting members ofthe workforceOverallEN30 Total environmental protectionexpenditures and investments by typeLabour practices and decent workEmploymentLA1LA2LA3Total workforce by employment type,employment contract and regionTotal number and rate of employeeturnover by age group, gender and regionBenefits provided to full-time employeesthat are not provided to temporary orpart-time employees, by major operationLabour/management relationsLA4LA5Percentage of employees covered bycollective bargaining arrangementsMinimum notice period(s) regardingsignificant operational changes, includingwhether it is specified in collectiveagreementsSee Climate Change Mitigation and Adaptation section inthe SR (pages 72 and 73).Not material to <strong>Transnet</strong>.No significant monetary fines were incurred.See Waste Management Optimisation section in the SR(pages 74 and 75).<strong>Transnet</strong> does not currently report on this indicator.Operational Reviews in the IR (pages 78 to 125).See employee turnover rate in the SR (page 40) andOperational Reviews in the IR (pages 78 to 125).<strong>Transnet</strong> does not currently report on this indicator.<strong>Transnet</strong> does not currently report on this indicator.<strong>Sustainability</strong> <strong>Report</strong> <strong>2012</strong>83
Global <strong>Report</strong>ing Initiative table (continued)G3 indicatorOccupational health and safetyLA6LA7LA8LA9Percentage of total workforcerepresented in formal joint managementworkerHealth and Safety Committeesthat help monitor and advise onoccupational health and safetyprogrammesRates of injury, occupational diseases,lost days, absenteeism and total numberof work-related fatalities, by regionEducation, training, counselling,prevention and risk-control programmes inplace to assist workforce members, theirfamilies, or community members regardingserious diseasesHealth and safety topics covered informal agreements with trade unionsReference<strong>Transnet</strong> does not currently report on this indicator.See Safety First section in the SR (page 51) andOperational Reviews in the IR (pages 78 to 125).See Staff Wellness section in the SR (page 54) and HumanCapital section in the IR (page 39).<strong>Transnet</strong> has engaged with labour unions in order toestablish more onsite facilities for HIV/Aids voluntarytesting and counselling.Training and educationLA10 Average hours of training per year peremployee by categoryLA11 Programmes for skills managementand lifelong learning that support thecontinued employability of employeesand assist them in managing their careersLA12 Percentage of employees receivingregular performance and careerdevelopment reviewsDiversity and equal opportunityLA13 Composition of governance bodies andbreakdown of employees per categoryaccording to gender, age group, minoritygroup membership, and other indicatorsof diversityLA14Ratio of basic salary of men to women byemployee categoryHuman rightsInvestment and procurement activitiesHR1Percentage and total number ofsignificant investment agreements thatinclude human rights clauses or that haveundergone human rights screening<strong>Transnet</strong> spends 3,9% (R652 million) of its total payrollon skills development initiatives.See Skilled Human Resources Aligned to Infrastructureand Services in the SR (pages 39 to 41) and Human Capitalsection in the IR (page 39).<strong>Transnet</strong> holds performance reviews and talent forumsacross it Operating divisions in order to track itsemployees’ skills and talent, and maintain its successionpools.See Corporate Governance report in the AFS (page 156).<strong>Transnet</strong> does not currently report on this indicator.<strong>Transnet</strong> does not currently report on this indicator.However, <strong>Transnet</strong>’s Board Acquisition and DisposalCommittee oversees its procurement policies andprocedures, ensuring that they are legally compliant.84
GRI tableHR2HR3G3 indicatorPercentage of significant suppliersand contractors that have undergonescreening on human rights and actionstakenTotal hours of employee training onpolicies and procedures concerningaspects of human rights that are relevantto operations, and percentage ofemployees that are trainedReference<strong>Transnet</strong> does not currently report on this indicator.However, all suppliers and contractors are requiredto abide by the Supplier Code of Conduct which isunderpinned by various codes and policies prohibitingcorrupt practices.<strong>Transnet</strong> does not currently report on this indicator.Non-discriminationHR4Total number of incidents ofdiscrimination and actions taken<strong>Transnet</strong> does not currently report on this indicator.However, <strong>Transnet</strong>’s EE plan articulates the Company’scontinued commitment to the elimination of unfairdiscrimination.Freedom of association and collective bargainingHR5 Operations identified in which the rightto exercise freedom of association orcollective bargaining may be a significantrisk, and actions taken to support theserightsNo such operations were identified. <strong>Transnet</strong>’s employeeprofile reflects a high level of unionisation (90,4%) withlabour unions comprising a major stakeholder with whom<strong>Transnet</strong> engages.Child labourHR6 Operations identified as havingsignificant risk for incidents of childlabour, and measures taken to contributeto the elimination of child labourForced and compulsory labourHR7Operations identified as having significantrisk for incidents of forced and compulsorylabour, and measures taken to contributeto the elimination of forced and compulsorylabourIndigenous rightsHR9Total number of incidents of violationsinvolving rights of indigenous people andactions taken<strong>Transnet</strong> does not make use of child labour.<strong>Transnet</strong> does not make use of compulsory or forced labour.<strong>Transnet</strong> does not currently report on this indicator.However “Dignity and Respect” which includes culturaltolerance is a core behaviour of <strong>Transnet</strong>’s Culture Charter– an indicator which is scored yearly, with organisationwideinitiatives initiated when performance gaps arefound.<strong>Sustainability</strong> <strong>Report</strong> <strong>2012</strong>85
Global <strong>Report</strong>ing Initiative table (continued)SocietyCommunitySO1G3 indicatorNature, scope, and effectiveness of anyprogramme and practices that assessand manage the impacts of operations oncommunities, including entering, operatingand exitingCorruptionSO2 Percentage and total number of businessunits analysed for risks related tocorruptionSO3SO4Percentage of employees trained inorganisation’s anti-corruption policies andproceduresActions taken in response to incidents ofcorruptionPublic PolicySO5 Public policy positions and participationin public policy development and lobbyingSO6 Total value of financial and in-kindcontributions to political parties,politicians and related institutions bycountryAnti-competitive behaviourSO7 Total number of legal actions for anticompetitivebehaviour, anti-trust, andmonopoly practices and their outcomesComplianceSO8Monetary value of significant fines andtotal number of non-monetary sanctionsfor non-compliance with laws andregulationsProduct responsibilityCustomer health and safetyPR1 Lifecycle stages in which health andsafety impacts of products and servicesare assessed for improvement, andpercentage of significant products andservices categories subject to suchproceduresReferenceSee CSI section in the SR (pages 57 to 59) and in theIR (page 47).<strong>Transnet</strong>’s Tip-Offs Anonymous Hotline and FraudRisk Management Plan are integrated throughout theCompany. See Zero Tolerance of Fraud and Corruptionsection in the SR (page 48) and the Directors’ <strong>Report</strong> inthe AFS (page 14).See Zero Tolerance of Fraud and Corruption section in theSR (page 48) and the Directors’ <strong>Report</strong> in the AFS (page 14).See Zero Tolerance of Fraud and Corruption section in theSR (page 48) and the Directors’ <strong>Report</strong> in the AFS (page 14).See Economic Regulations section in the IR (page 50).<strong>Transnet</strong> does not make financial or in-kind contributionsto political parties.<strong>Transnet</strong> does not currently report on this indicator.No significant monetary fines were incurred due to noncompliance.<strong>Transnet</strong> does not currently report on thetotal number of instances of non-complaince.<strong>Transnet</strong> does not currently report on this indicator.86
GRI tablePR2G3 indicatorTotal number of incidents of noncompliancewith regulations andvoluntary codes concerning health andsafety impacts of products and servicesduring their lifecycle, by type of outcomesReference<strong>Transnet</strong> does not currently report on this indicator.Product and service labellingPR3PR4Type of product and service informationrequired by procedures, and percentageof significant products and servicessubject to such information requirementsTotal number of incidents of noncompliancewith regulation and voluntarycodes concerning product and serviceinformation and labelling, by type ofoutcomesMarketing communicationsPR6PR7Programmes for adherence to laws,standards and voluntary codes concerningmarketing communications, includingadvertising, promotion and sponsorshipTotal number of incidents of noncompliancewith regulation andvoluntary codes concerning marketingcommunications, including advertising,promotion, and sponsorship by type ofoutcomesCustomer privacyPR8CompliancePR9Total number of substantiated complaintsregarding breaches of customer privacyand losses of customer dataMonetary value of significant fines fornon-compliance with laws and regulationsconcerning the provision and use ofproducts and services<strong>Transnet</strong> does not currently report on this indicator.<strong>Transnet</strong> does not currently report on this indicator.<strong>Transnet</strong> does not currently report on this indicator.<strong>Transnet</strong> does not currently report on this indicator.<strong>Transnet</strong> does not currently report on this indicator.No significant monetary fines were incurred in relation tothe provision and use of products and services.<strong>Sustainability</strong> <strong>Report</strong> <strong>2012</strong>87
Abbreviations and acronymsB-BBEEBNHSCSDPCSICTCTDCTDIFRDPEDTIEEGCHGDPGFBGHGGITGRIGSLGTKKing IIIbroad-based black economicempowermentBayhead Natural Heritage SiteCompetitive Supplier DevelopmentProgrammeCorporate social investmentCape Town Container TerminalDurban Container Terminaldisabling injury frequency rateDepartment of Public EnterprisesDepartment of Trade and Industryemployment equitygross crane moves per hourGross Domestic ProductGeneral Freight Businessgreenhouse gasesGraduate in TrainingGlobal <strong>Report</strong>ing InitiativeGolden Safety LeagueGross Ton KilometresSouth Africa’s King Code of CorporateGovernanceNCTNEAPNGPNMPPORTIAPECTNgqura Container TerminalNational Employment Action PlanNew Growth PathNew Multi-Product PipelineOR Tambo Internationl AirportPort Elizabeth Container TerminalPFMA Public Finance Management Act No 1of 1999PSPPWDRRio + 20RBCTROTARTGSDSOCSRSTATSTSSWHTEUPrivate Sector ParticipationPeople with disabilitiesZARUnited Nations Conference on SustainableDevelopmentRichards Bay Coal Terminalreturn on total average assetsRubber-tyred gantry craneSupplier Developmentstate-owned company<strong>Sustainability</strong> <strong>Report</strong>ship turnaround timeship-to-shoremoves per ship working hourtwenty-foot equivalent unitMDGMillenium Development GoalsTSDBF<strong>Transnet</strong> Second Defined Benefit FundMDSMarket Demand StrategyWFPWorkforce Planmtmillion tonsWIREWomen in Rail Engineering Programme88
Corporate informationExecutive DirectorsB Molefe (Group Chief Executive), A Singh (Acting Chief Financial Officer).Non-executive DirectorsME Mkwanazi (Chairman), NK Choubey#, MA Fanucchi, Y Forbes, HD Gazendam, NBP Gcaba,BD Mkhwanazi, T Mnyaka, N Moola, MP Moyo, NR Ntshingila, IM Sharma, IB Skosana,E Tshabalala, DLJ Tshepe.# Indian.Mr MP Malungani resigned from the Board of Directors with effect from 1 April <strong>2012</strong>.Group Company SecretaryMs ANC Ceba47th Floor, Carlton Centre,150 Commissioner Street, Johannesburg, 2001.PO Box 72501, Parkview, 2122, South Africa.AuditorsDeloitte & Touche, Deloitte Place, The Woodlands Office Park, Woodlands Drive, Sandton.<strong>Transnet</strong> SOC LtdIncorporated in the Republic of South Africa.Registration number 1990/000900/30.www.transnet.net