Health Equity Quiz (pdf) - Unnatural Causes
Health Equity Quiz (pdf) - Unnatural Causes
Health Equity Quiz (pdf) - Unnatural Causes

Create successful ePaper yourself
Turn your PDF publications into a flip-book with our unique Google optimized e-Paper software.
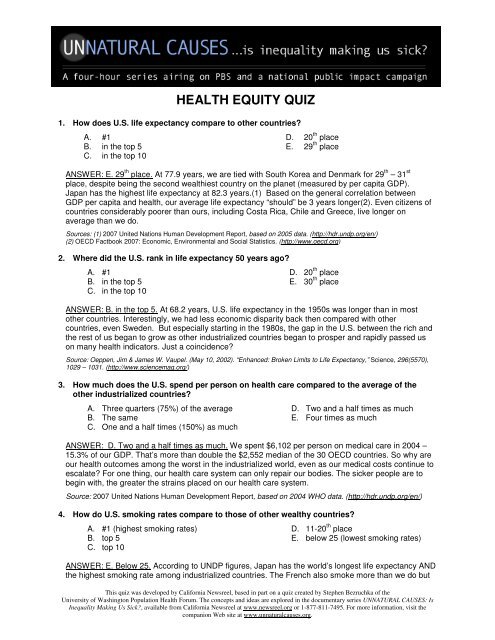
live longer. The Germans drink more and live longer. But the U.S. has the greatest income gapbetween the rich and the rest of us – and the worst health.Source: 2007 United Nations Human Development Report, based on 2005 data (http://hdr.undp.org/en/)5. What is the greatest difference in life expectancy observed between U.S. counties?A. 4 yearsB. 7 yearsC. 15 yearsD. 22 yearsE. 33 yearsANSWER: C. 15 years. Our zip code is a strong indicator of our health. A recent study of “EightAmericas” (comparing different groups within the country) found a 14.7 year gap in life expectancies atbirth between the longest and shortest-lived counties.(1) These differences become even starkerbetween subgroups – e.g., Asian American women in Bergen County, New Jersey, live 33 years longerthan Native American men in South Dakota. <strong>Health</strong> expert Sir Michael Marmot noted that on a subwayride from southeast Washington, D.C. (an impoverished African American neighborhood) toMontgomery County, Maryland (an affluent white suburb), life expectancy of the surroundingcommunities rises about a year and a half for every mile traveled–amounting to a 20-year gap.(2)Sources: (1) Murray, C.J.L. et al. (2006). “Eight Americas: Investigating Mortality Disparities across Races, Counties, and Race-Counties in the United States.” PLoS Med 3(9): e260. doi:10.1371/journal.pmed.0030260(2) Marmot, Michael. (2004). Status Syndrome. New York: Henry Holt and Company.6. Between 1980 and 2000, how did the life expectancy gap between the least deprived and mostdeprived counties in the U.S. change?A. Narrowed by 1%B. Narrowed by 12%C. Remained the sameD. Widened by 28%E. Widened by 60%ANSWER: E. Widened by 60%. As economic inequality grew after 1980, so did the life expectancy gapbetween the rich and the rest of us. In contrast, a recent study shows that premature death and infantmortality gaps narrowed between 1966 and 1980.Source: Krieger, Nancy, et al. (2008) “The Fall and Rise of US Inequities in Premature Mortality: 1960–2002.”PLoS Med 5(2): e46. doi:10.1371/journal.pmed.00500467. On average, how many more supermarkets are there in predominantly white neighborhoodscompared to predominantly Black and Latino neighborhoods?A. about the sameB. 1.5 times as manyC. 2 times as manyD. 4 times as manyE. 6 times as manyANSWER: D. 4 times as many. Predominantly Black and Latino neighborhoods have more fast-foodfranchises and liquor stores, yet often lack stores that offer fresh, affordable fruits and vegetables.Residents tend to rely more on public transportation, further compounding problems of access. A 2005Chicago study found that people living in such “food deserts” died early in greater numbers and hadmore diabetes, obesity and high blood pressure.Source: Mari Gallagher Research & Consulting Group. (2006) Good Food: Examining the Impact of Food Deserts on Public<strong>Health</strong> in Chicago. Report commissioned by LaSalle Bank. (http://www.lasallebank.com/about/stranded.html)8. The predominantly white neighborhoods in west Los Angeles contain approximately 31.8acres of park space per 1,000 residents. How many acres of park space exist per 1,000residents in the predominantly Black and Latino neighborhoods of south central L.A.?A. 28.7 acresB. 17.2 acresC. 14.6 acresD. 5.8 acresE. 1.7 acres© California Newsreel www.unnaturalcauses.org Page 2
ANSWER: E. 1.7 acres. That’s almost 19 times more green space in white neighborhoods than Blackand Latino neighborhoods! More parks means cleaner air, room to exercise and play, a place forcommunity members to gather, not to mention higher property values and increased desirability.Source: Pincetl, Stephanie et al. (March 2003). Toward a Sustainable Los Angeles: A ‘Nature’s Services’ Approach. Report fromthe University of Southern California Center for Sustainable Cities.(http://www.usc.edu/dept/geography/ESPE/documents/report_haynes.<strong>pdf</strong>)9. How much does chronic illness cost the U.S. each year in lost work productivity?A. $105 millionB. $601 millionC. $2.2 billionD. $153 billionE. $1.1 trillionANSWER: E. $1.1 trillion. According to a 2007 study by the Milken Institute, the financial burden ofchronic illnesses such as heart disease and diabetes goes far beyond actual medical expenses ($277billion in 2003). Our poor health takes a even greater toll on economic productivity in the form of extrasick days, reduced performance by ailing workers and other losses not directly related to medical care.Source: DeVol, Ross & Armen Bedroussian. (October 2007). Unhealthy America: The Economic Burden of Chronic Disease.Report from The Milken Institute. (http://www.chronicdiseaseimpact.com)10. African American men in Harlem have a shorter life expectancy from age five than which ofthe following groups?A. JapaneseB. BangladeshisC. CubansD. Algerians living in ParisE. All of the aboveANSWER: E. All of the above. Even males in Bangladesh, one of the poorest countries in the world,have a better chance of reaching age 65 than African American males in Harlem. The biggest killers inpoor African American communities are not drugs or bullets but chronic diseases like stroke, diabetesand heart disease. Former Surgeon General Dr. David Satcher and colleagues calculated that 83,000African American “excess” deaths could have been prevented in 2002 if Black-white differences inmortality were eliminated.Sources: (1) McCord C., & H.P. Freeman. (1990). “Excess Mortality in Harlem.” New England Journal of Medicine, 322(3), 173-177. (http://content.nejm.org/cgi/content/abstract/322/3/173)(2) Satcher, D. et al. (2005). “What If We Were Equal? A Comparison of the Black-White Mortality Gap in 1960 and 2000.” <strong>Health</strong>Affairs, 24(2), 459-464. (http://content.healthaffairs.org/cgi/content/abstract/24/2/459)11. On average, which of the following is the best predictor of one’s health?A. whether or not you smokeB. what you eatC. whether or not you are wealthyD. whether or not you have health insuranceE. how often you exerciseANSWER: C. Whether or not you are wealthy. The single strongest predictor of health is our position onthe class pyramid. Those at the top have the most power and resources, and on average live longerand healthier lives. Those on the bottom are exposed to many health threats over which they have littleor no control – insecure and low-paying jobs, mounting debt, poor child care, poor quality housing, lessaccess to healthy food, unreliable transportation, and noisy and violent living conditions – that increasetheir risk of chronic disease and early death. Even among smokers, poor smokers face a highermortality risk than rich smokers. Those of us in the middle are still worse off than those at the top.Source: Adler, N.E. et al. (2007). Reaching for a <strong>Health</strong>ier Life: Facts on Socioeconomic Status and <strong>Health</strong> in the U.S. Reportfrom the Macarthur Foundation Research Network on Socioeconomic Status and <strong>Health</strong>.(http://www.macses.ucsf.edu/News/Reaching%20for%20a%20<strong>Health</strong>ier%20Life.<strong>pdf</strong>)© California Newsreel www.unnaturalcauses.org Page 3
12. Children living in poverty are how many times more likely to have poor health, compared withchildren living in high-income households?A. 2 timesB. 4 timesC. 5 timesD. 7 timesE. 10 timesANSWER: D. 7 times. There’s a continuous health-wealth gradient: on average, the wealthier you are,the better your health, from the top all the way to the bottom. But childhood poverty has an even greaterimpact because children are the most vulnerable. For example, substandard housing conditions cantrigger asthma and other respiratory problems; lack of access to fresh, nutritious food stunts growth,affects learning and contributes to obesity; an unsafe neighborhood breeds violence, raises stresshormones and limits opportunities for exercise; and poor schools limit job prospects and futuresocioeconomic success. The effects of childhood poverty are cumulative, lasting into adulthood andeven the next generation.Source: Overcoming Obstacles to <strong>Health</strong>. (2008). Report from the Robert Wood Johnson Foundation Commission to Build a<strong>Health</strong>ier America. (http://www.commissiononhealth.org/Report.aspx?Publication=26244)13. Generally speaking, which group has the best overall health in the U.S.?A. Recent Latino immigrantsB. Non-Hispanic whitesC. Native-born LatinosD. Native-born Asian AmericansANSWER: A. Recent Latino immigrants. Several studies suggest that recent Latino immigrants havebetter health outcomes than other U.S. populations despite being, on average, poorer. However, thelonger they live here, the worse they fare. This phenomenon is often called the “Latino paradox.” Fiveyears after arrival, Latino immigrants’ health begins to erode; within a generation, Latinos lose theiradvantage and experience the higher-than-average disease rates comparable to other low-incomepopulations.Sources: (1) Advance Data from Vital and <strong>Health</strong> Statistics. (March 1, 2006). Centers for Disease Control.(2) Markides and Coreil. (May-June 1986). “The <strong>Health</strong> of Hispanics in Southwestern United States: an Epidemiologic Paradox.”Public <strong>Health</strong> Reports.(3) Burnam et al. (March 1987). "Acculturation and Lifetime Prevalence of Psychiatric Disorders among Mexican Americans inLos Angeles." Journal of <strong>Health</strong> and Social Behavior.(4) Evans, J. (1987). “Introduction: Migration and <strong>Health</strong>.” International Migration Review.14. Chronic stress increases the risk of all of the following except:A. hypertensionB. obesityC. sickle cell anemiaD. pre-term birthE. diabetesANSWER: C. Sickle cell anemia. Sickle cell anemia is a genetically inherited disease. Chronic stress isa risk factor for all the other conditions. Like gunning a car, the stress response, even if low level, canwear down our systems over time and increase our susceptibility to disease. The lower we are in theclass and racial hierarchy, the greater our exposures to stressors that threaten our health, and the lessaccess we have to resources that help us cope.Source: Marmot, Michael. (2004). The Status Syndrome. New York: Henry Holt.15. During the 20 th century, U.S. life expectancy increased 30 years. Which of the following wasthe most important factor behind the increase?A. Social reforms (like wage andlabor laws, housing codes, etc.) andincreased prosperityB. New drugs (like penicillin)C. The development of the modern hospital systemD. Migration from rural areas to citiesE. More exercise and smoking cessationANSWER: A. Social reforms. While researchers debate the relative importance of one factor versusanother, most agree that better wages, housing, job security and working conditions, civil rights laws,© California Newsreel www.unnaturalcauses.org Page 4
sanitation and other protections that enlarged the middle class were central to expanding averageAmerican life expectancy. Death rates from tuberculosis, for example, fell by 70% even before the drugfor TB was discovered in 1948.Sources: (1) Vital Statistics Rates in the U.S. 1900-1940, U.S. Department of Commerce Report (dropped 76.4%).(2) Vital Statistics Rates in the U.S. 1900-1968, U.S. Department of Commerce Report 1900-1968, US Public <strong>Health</strong> Service,Vital Statistics of the United States, 1968, vol 2, part A, 1969-1970, unpublished data, provided to Sally Soliai by Karen DeniseThompson from the Census Bureau, Oct 18 th , 2006;(3) McKinlay, John and Sonja, “The Questionable Contribution of Medical Measures to the Decline of Mortality in the UnitedStates in the Twentieth Century,” Millbank Memorial Fund Quarterly. <strong>Health</strong> and Society (55:3) 1977.16. True or False? The gap between white and African American infant mortality rates is greatertoday than it was in 1950.A. True B. FalseANSWER: A. True. The total number of infant deaths among both African American and whiteAmericans has fallen since 1950. But today the infant mortality rate for African Americans is two and ahalf times that of white Americans, a greater gap than 60 years ago. In fact, the rate among AfricanAmerican mothers with college and professional degrees is higher than among white mothers whohaven’t finished high school. The only time the health gap between African Americans and whiteAmericans narrowed in both relative and absolute terms was after the Civil Rights victories of the1960s. But the gap began widening again in the 1980s.Sources: (1) Vital Statistics of the United States. (2002.) Centers for Disease Control and Prevention.(2) David, R. & J. Collins. (1997). “Differing Birth Weight among Infants of U.S.-Born Blacks, African-Born Blacks, and U.S.-bornWhites,” The New England Journal of Medicine, 337(17).(3) Randall, V. (2006). Dying While Black. Dayton, OH: Seven Principles Press.(4) Cooper et al. (1981) “Improved Mortality among U.S. Blacks, 1968-1978: the Role of Antiracist Struggle.” International Journalof <strong>Health</strong> Services, 11(4).17. Citizens of other industrialized countries have longer life expectancies and better health thanwe do because:A. They spend more on medical careB. They are more egalitarianC. They smoke lessD. They eat betterE. They have universal health care coverageANSWER: B. They are more egalitarian. On average, the smaller a country’s Gini coefficient (ameasure of income inequality), the better its health. The U.S. spends more than twice the average percapita among developed nations on health care, yet has the worst economic inequality in theindustrialized world and the worst health outcomes. Although universal health care coverage isimportant, its impact on health is less than the social conditions that make people sick in the first place.Social policies like living wage jobs, paid sick and family leave, guaranteed paid vacations, anduniversal preschool can shorten the ladder of inequality and offer protections from health threats tothose on lower rungs.18. The child poverty rate in Norway is 3.4%, France 7.5%, Hungary 8.8% and Greece 12.4%. Whatis it in the U.S?A. 4.1%B. 8.6%C. 12.8%D. 21.2%E. 32.4%ANSWER D. 21.2%. The U.S. has by far the most relative child poverty in the industrialized world.(“Relative poverty” is defined as households with income below 50 % of the national median income.)No one else even comes close. Interestingly, the French child poverty rate is 27.7% before taxes andtransfers, but falls to 7.5% after accounting for social programs. In Sweden, social spending drops thechild poverty rate from 18% to 4.2%. But the U.S. spends the least on social programs and as a resultour child poverty rate falls only a little, from 26.6% to 21.2%.Source: “Child Poverty in Rich Countries” (2005.) Innocenti Report Card No. 6. Report of the UNICEF Innocenti ResearchCentre, Florence, Italy. (http://www.unicef-irc.org/)© California Newsreel www.unnaturalcauses.org Page 5
19. Ireland, Sweden, France, Spain, Portugal and the other western European nations all mandateby law paid holidays and vacations of four to six weeks. How many days of paid vacation aremandated by law in the United States?A. NoneB. 5C. 10D. 12E. 18ANSWER: A. None. The United States is the only country in the industrialized world that does notguarantee paid days off by law. U.S. employers have the freedom to offer paid vacation or not. As aresult, one in four American workers receives NO paid holidays or vacations.20. On average, how does the number of hours that Americans work each year compare to otherOECD countries?A. About the sameB. 40 hours lessC. 40 hours moreD. 100 hours moreE. 200 hours moreANSWER: E. 200 hours more. Americans now work more hours than even the Japanese (1,824 hoursper year vs. 1,789). That’s the equivalent of working five more weeks per year. Combine that withcommutes that are twice as long as 20 years ago, lack of parental leave, and lack of sick leave and it’sno wonder that Americans have less time with their families and tend to be more socially isolated.Source: Mishel, Lawrence, Jared Bernstein and Sylvia Allegretto. (2007). State of Working America 2006-2007. Economic PolicyInstitute. Work hours fact sheet: http://www.stateofworkingamerica.org/news/SWA06Facts-Work_Hours.<strong>pdf</strong> (accessed March 20,2008)21. How many days of paid sick leave are U.S. workers guaranteed by law?A. NoneB. One dayC. Six daysD. Ten daysE. Fourteen daysANSWER: A. None. The United States is the only industrialized country not to require that employersoffer paid sick leave by law. Nearly half of all private sector employees (47%) have no paid sick leave.If sick, they must choose between staying home and losing a day’s pay. California is the only U.S. statethat offers any paid family leave, and in 2007, San Francisco became the first city in the country toadopt a paid sick leave law.Source: U.S. Bureau of Labor Statistics, 2001.22. The top 1% of American families owns more wealth than the bottom:A. 10% combinedB. 30% combinedC. 50% combinedD. 76% combinedE. 90% combinedANSWER: A. 90% combined. American economic inequality is greater today than at any time since the1920s. This represents a reversal from the mid-1970s when inequality was at its lowest level. Between1979 and 2005, the top five percent of American families saw their real incomes increase 81 percent.During the same period, the lowest 20 percent saw their real incomes decline 1 percent.Sources: (1) Arthur Kinneckell, Federal Reserve Board of Governors, "Currents and Undercurrents: Changes in the Distribution ofWealth, 1989-2004," January 30, 2006, http://www.federalreserve.gov/pubs/feds/2006/200613/200613pap.<strong>pdf</strong>(2) U.S. Census Bureau: Historical Income Data, 1947-2005. http://www.census.gov/hhes/www/income/histinc/histinctb.html© California Newsreel www.unnaturalcauses.org Page 6