Detection of color faults on cable insulation - the IWCS Proceedings ...
Detection of color faults on cable insulation - the IWCS Proceedings ...
Detection of color faults on cable insulation - the IWCS Proceedings ...

You also want an ePaper? Increase the reach of your titles
YUMPU automatically turns print PDFs into web optimized ePapers that Google loves.
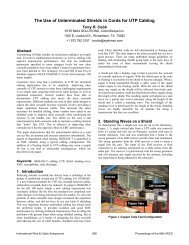
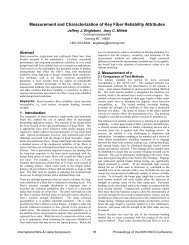
<str<strong>on</strong>g>Detecti<strong>on</strong></str<strong>on</strong>g> <str<strong>on</strong>g>of</str<strong>on</strong>g> <str<strong>on</strong>g>color</str<strong>on</strong>g> <str<strong>on</strong>g>faults</str<strong>on</strong>g> <strong>on</strong> <strong>cable</strong> insulati<strong>on</strong>Horst A. ScheidR&D, Siebe Engineering Germany53577 Neustadt / Wied, Germany+49-2683-3003-0 · scheid@siebe.deAbstractThe difference <str<strong>on</strong>g>of</str<strong>on</strong>g> <str<strong>on</strong>g>color</str<strong>on</strong>g>s between two <strong>cable</strong>s can be safetyrelevant. For c<strong>on</strong>trolling purposes, <str<strong>on</strong>g>of</str<strong>on</strong>g>ten visual inspecti<strong>on</strong> with<str<strong>on</strong>g>color</str<strong>on</strong>g> cards is used to check <strong>the</strong> acceptance limit <str<strong>on</strong>g>of</str<strong>on</strong>g> <strong>the</strong> specified<str<strong>on</strong>g>color</str<strong>on</strong>g>s. Visual assessments are subject to subjective impressi<strong>on</strong>sarising from factors such as illuminati<strong>on</strong>, angle <str<strong>on</strong>g>of</str<strong>on</strong>g> visi<strong>on</strong> and <strong>the</strong><str<strong>on</strong>g>color</str<strong>on</strong>g> sensitivity <str<strong>on</strong>g>of</str<strong>on</strong>g> <strong>the</strong> observer, whereas an automatic system getsobjective, reproducible and comparable results. This paperintroduces some <str<strong>on</strong>g>color</str<strong>on</strong>g> basics and depicts important differences in<str<strong>on</strong>g>color</str<strong>on</strong>g> measurements between <strong>cable</strong> applicati<strong>on</strong>s and <strong>the</strong> paintindustry.A new developed <str<strong>on</strong>g>color</str<strong>on</strong>g> checking system has been shown to beeffective for <strong>cable</strong> producti<strong>on</strong> lines as well as for <str<strong>on</strong>g>of</str<strong>on</strong>g>fline testing.Various tests to define <strong>the</strong> limitati<strong>on</strong>s <strong>on</strong> geometry and movement(speed, turning) are described for single <str<strong>on</strong>g>color</str<strong>on</strong>g>ed and stripe coded<strong>cable</strong>s. The measurement techniques ‚best-fit-scan’ and ‚tolerancescan’ will be explained.The result is a quasi c<strong>on</strong>tinuous inline <str<strong>on</strong>g>color</str<strong>on</strong>g> c<strong>on</strong>trol similar todiameter or spark testing and a simple <str<strong>on</strong>g>of</str<strong>on</strong>g>fline quality checkindependent from <strong>the</strong> human eye <str<strong>on</strong>g>color</str<strong>on</strong>g> percepti<strong>on</strong>.2. Color metricsFor a better understanding <str<strong>on</strong>g>of</str<strong>on</strong>g> <str<strong>on</strong>g>color</str<strong>on</strong>g> measurements, it is useful firstlyto define some basics <str<strong>on</strong>g>of</str<strong>on</strong>g> <str<strong>on</strong>g>color</str<strong>on</strong>g> percepti<strong>on</strong> and <str<strong>on</strong>g>color</str<strong>on</strong>g> metrics. Just todepict <strong>the</strong> difficulties in interpretati<strong>on</strong> ‚<str<strong>on</strong>g>color</str<strong>on</strong>g>’ by <strong>the</strong> human eye,picture 1 shows two squares A and B. Every pers<strong>on</strong> classifies A tobe more dark than B, even though <strong>the</strong>y both have <strong>the</strong> same grayvalue. This (like many o<strong>the</strong>r optical illusi<strong>on</strong>s) explains, whyobjective <str<strong>on</strong>g>color</str<strong>on</strong>g> specificati<strong>on</strong> by <strong>the</strong> human eye is nearly impossible.Keywords: wire; <strong>cable</strong>; quality c<strong>on</strong>trol; <str<strong>on</strong>g>color</str<strong>on</strong>g>; colour; checking;testing; fault detecti<strong>on</strong>1. Introducti<strong>on</strong>In today’s <strong>cable</strong> producti<strong>on</strong>, it is a comm<strong>on</strong> standard and state <str<strong>on</strong>g>of</str<strong>on</strong>g> <strong>the</strong>art in automotive wire producti<strong>on</strong> to use automatic <str<strong>on</strong>g>color</str<strong>on</strong>g> changingsystems and automatic <str<strong>on</strong>g>color</str<strong>on</strong>g> batch dosing systems <strong>on</strong> extrusi<strong>on</strong>lines. On such producti<strong>on</strong> lines for automotive wires a huge number<str<strong>on</strong>g>of</str<strong>on</strong>g> combinati<strong>on</strong>s <str<strong>on</strong>g>of</str<strong>on</strong>g> main and stripe <str<strong>on</strong>g>color</str<strong>on</strong>g> are used and can be presetwithin <strong>the</strong> line c<strong>on</strong>trol menu.For quality c<strong>on</strong>trol, c<strong>on</strong>centricity, diameter, capacitance and spark<str<strong>on</strong>g>faults</str<strong>on</strong>g> are c<strong>on</strong>stantly measured and protocolled. Readings canautomatically influence and correct <strong>the</strong> extrusi<strong>on</strong> parameters. But<strong>the</strong> correctness <str<strong>on</strong>g>of</str<strong>on</strong>g> <strong>cable</strong> <str<strong>on</strong>g>color</str<strong>on</strong>g>s is still left to <strong>the</strong> imaginati<strong>on</strong> and skill<str<strong>on</strong>g>of</str<strong>on</strong>g> <strong>the</strong> line operator, to recognize <strong>the</strong> correct <str<strong>on</strong>g>color</str<strong>on</strong>g>s in accordancewith relevant standards and auditing procedures.The proper <str<strong>on</strong>g>color</str<strong>on</strong>g> is checked ei<strong>the</strong>r visually inline or after <strong>the</strong>completi<strong>on</strong> <str<strong>on</strong>g>of</str<strong>on</strong>g> a drum by inspecti<strong>on</strong> <str<strong>on</strong>g>of</str<strong>on</strong>g> <strong>the</strong> top layer. Start and end <str<strong>on</strong>g>of</str<strong>on</strong>g><strong>the</strong> <str<strong>on</strong>g>color</str<strong>on</strong>g> changing process is normally not m<strong>on</strong>itored duringrunning producti<strong>on</strong>. The scrap length is set by means <str<strong>on</strong>g>of</str<strong>on</strong>g> empiricalvalues under c<strong>on</strong>siderati<strong>on</strong> <str<strong>on</strong>g>of</str<strong>on</strong>g> a safety value which is l<strong>on</strong>ger thanactually necessary.It is <strong>the</strong>refore obvious, that wr<strong>on</strong>g <str<strong>on</strong>g>color</str<strong>on</strong>g>s cost valuable producti<strong>on</strong>time and material scrap. The logical c<strong>on</strong>sequence <str<strong>on</strong>g>of</str<strong>on</strong>g> <strong>the</strong>sec<strong>on</strong>siderati<strong>on</strong>s is <strong>the</strong> need for some automatic inline <str<strong>on</strong>g>color</str<strong>on</strong>g>measurement.Figure 1: Optical Illusi<strong>on</strong> : Square A and B have <strong>the</strong> samegray value, but are interpreted by human eye as differentbecause <strong>the</strong> nearest neighbourhood is different [1].To describe <str<strong>on</strong>g>color</str<strong>on</strong>g> in physical terms, <strong>the</strong> base is a part <str<strong>on</strong>g>of</str<strong>on</strong>g> <strong>the</strong>electromagnetic spectrum that has wavelengths from 350 to 800 nmand will be recognized by <strong>the</strong> human eye as ‚<str<strong>on</strong>g>color</str<strong>on</strong>g>’ (in ascendingorder violet-indigo-blue-green-yellow-orange-red). A betterphysiological representati<strong>on</strong> is <strong>the</strong> so called <str<strong>on</strong>g>color</str<strong>on</strong>g> wheel (or <str<strong>on</strong>g>color</str<strong>on</strong>g>circle), where different circular sectors are filled with different<str<strong>on</strong>g>color</str<strong>on</strong>g>s. Colors in opposite sectors are designated as complimentary,that leads to <strong>the</strong> well known RGB model : With <strong>the</strong> three basic<str<strong>on</strong>g>color</str<strong>on</strong>g>s red, green and blue. All o<strong>the</strong>r <str<strong>on</strong>g>color</str<strong>on</strong>g>s can be created bysuitable mixing. Mixing complementary <str<strong>on</strong>g>color</str<strong>on</strong>g>s 1:1 results in aneutral gray or white (additive RGB-mixing). This model is verycomm<strong>on</strong> for camera or m<strong>on</strong>itor applicati<strong>on</strong>s, but it is a purema<strong>the</strong>matical descripti<strong>on</strong> without any feeling for human <str<strong>on</strong>g>color</str<strong>on</strong>g>depicti<strong>on</strong>. In 1927, <strong>the</strong> German ‚Reich-Ausschuß fürLieferbedingungen’ (an organisati<strong>on</strong> for quality assurance) arrangeda <str<strong>on</strong>g>color</str<strong>on</strong>g> chart, which should serve as reference for <str<strong>on</strong>g>color</str<strong>on</strong>g>ed parts. Thattable is nowadays still very comm<strong>on</strong> in industry as ‚RAL Paletteclassic/design/effect' [2]. But also this attempt does not include <strong>the</strong>complete c<strong>on</strong>tinuum <str<strong>on</strong>g>of</str<strong>on</strong>g> <str<strong>on</strong>g>color</str<strong>on</strong>g> variati<strong>on</strong>s and so it is not suitable foran automated system. In <strong>the</strong> first decade <str<strong>on</strong>g>of</str<strong>on</strong>g> <strong>the</strong> 20 th century, AlbertMunsell separated hue, value, and chroma into independentInternati<strong>on</strong>al Wire & Cable Symposium567<strong>Proceedings</strong> <str<strong>on</strong>g>of</str<strong>on</strong>g> <strong>the</strong> 61st <strong>IWCS</strong> C<strong>on</strong>ference
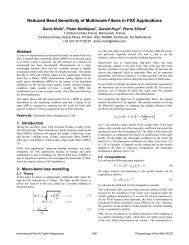
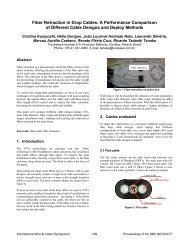
• With a very short sampling time an averaging over acertain number <str<strong>on</strong>g>of</str<strong>on</strong>g> single spots eliminates local deviati<strong>on</strong>s.This is justifiable, as <str<strong>on</strong>g>color</str<strong>on</strong>g> changes in extrusi<strong>on</strong> have arelative l<strong>on</strong>g transiti<strong>on</strong> time caused by mixing effects in <strong>the</strong>barrel• Object movement (Jitter) has to be minimized at <strong>the</strong>sensor positi<strong>on</strong>. This is important for <strong>the</strong> object-sensordistance ds (illuminati<strong>on</strong> reduces with ds 2 ) as well as fortransversal movement, where <strong>the</strong> object is leaving <strong>the</strong> scanspot partially or completely.• The wire geometry is detected as a side view <strong>on</strong> acylinder surface. This results in a <str<strong>on</strong>g>color</str<strong>on</strong>g> variati<strong>on</strong> from <strong>the</strong>cylinder center view towards <strong>the</strong> cylinder border. This effectis additi<strong>on</strong>ally influenced by <strong>the</strong> surface roughness. As bothc<strong>on</strong>diti<strong>on</strong>s cannot be changed, <strong>the</strong> final <str<strong>on</strong>g>color</str<strong>on</strong>g> value cannotbe interpreted as an absolute measurement but as relativemeasurement with high reproducibility.Normally <strong>on</strong>e line runs different c<strong>on</strong>ductor/insulati<strong>on</strong> diameters.The device should be able to work with various geometries (over acertain range) without mechanical preparati<strong>on</strong> or sensorrecalibrati<strong>on</strong>.One more challenge is <strong>the</strong> measurement in a producti<strong>on</strong> <str<strong>on</strong>g>of</str<strong>on</strong>g> <str<strong>on</strong>g>color</str<strong>on</strong>g>coded wires (<strong>on</strong>e or two stripes). As <strong>the</strong> final <str<strong>on</strong>g>color</str<strong>on</strong>g> establishes after<strong>the</strong> cooling down <str<strong>on</strong>g>of</str<strong>on</strong>g> <strong>the</strong> polymer, sampling has to be d<strong>on</strong>e behind<strong>the</strong> cooling trough. Caused by redirecting wheels and <strong>the</strong> productitself (particularly stranded c<strong>on</strong>ductor), <strong>the</strong> wire can turn around <strong>the</strong>l<strong>on</strong>gitudinal axis in an irregular way. Therefore <strong>the</strong> sensor detectssometimes <strong>the</strong> main <str<strong>on</strong>g>color</str<strong>on</strong>g>, sometimes <strong>the</strong> stripe <str<strong>on</strong>g>color</str<strong>on</strong>g>, or both at <strong>the</strong>same time in <strong>the</strong> scan field. Figure 3 gives an impressi<strong>on</strong> <str<strong>on</strong>g>of</str<strong>on</strong>g> <strong>the</strong>sensors view <strong>on</strong> a two <str<strong>on</strong>g>color</str<strong>on</strong>g>ed wire. With sophisticated mechanics,<strong>the</strong> wire turning can be changed to be more regular and used formain and stripe <str<strong>on</strong>g>color</str<strong>on</strong>g> detecti<strong>on</strong> with <strong>on</strong>ly <strong>on</strong>e sensor.Cable producers and polymer <str<strong>on</strong>g>color</str<strong>on</strong>g> batch suppliers rarely use <strong>the</strong>o.m. L*a*b* <str<strong>on</strong>g>color</str<strong>on</strong>g> notati<strong>on</strong>. Therefore, databases with reference<str<strong>on</strong>g>color</str<strong>on</strong>g>s should include o<strong>the</strong>r notati<strong>on</strong>s like RAL or Munsell as well.4. Typical applicati<strong>on</strong>s and inlinemeasurement test resultsA device (reffered to as SCM=Siebe Color Match) was developedaccording to <strong>the</strong> rules menti<strong>on</strong>ed in secti<strong>on</strong> 3, including optics for<strong>cable</strong> diameter 1-10 mm, internal illuminati<strong>on</strong> to preventmetamerism (a phenomen<strong>on</strong> <str<strong>on</strong>g>of</str<strong>on</strong>g> matching <str<strong>on</strong>g>of</str<strong>on</strong>g> apparent <str<strong>on</strong>g>color</str<strong>on</strong>g> <str<strong>on</strong>g>of</str<strong>on</strong>g>objects with different spectral power distributi<strong>on</strong>s) and an industrialcomputer (IPC) for image processing.System functi<strong>on</strong>al design and accuracy was first tested with single<str<strong>on</strong>g>color</str<strong>on</strong>g> wires to verify <strong>the</strong> aim <str<strong>on</strong>g>of</str<strong>on</strong>g> a resoluti<strong>on</strong> <str<strong>on</strong>g>of</str<strong>on</strong>g> at least dE~3, so <strong>the</strong>result would be <strong>the</strong> same or better than checking by <strong>the</strong> human eye.Figure 4 shows a detailed yt-plot from a measurement period <str<strong>on</strong>g>of</str<strong>on</strong>g> 15minutes for a yellow wire with 2.5 mm diameter. The histogram <str<strong>on</strong>g>of</str<strong>on</strong>g>all dE values in figure 4 depicts a maximum <str<strong>on</strong>g>of</str<strong>on</strong>g> around 0.75 (averagevalue 0.89) and is a pro<str<strong>on</strong>g>of</str<strong>on</strong>g>, that <strong>the</strong> system has a resoluti<strong>on</strong> <str<strong>on</strong>g>of</str<strong>on</strong>g>minimum dE=1. No values higher than 3 are recorded, so athreshold could be set to values <str<strong>on</strong>g>of</str<strong>on</strong>g> 5-7 for <str<strong>on</strong>g>color</str<strong>on</strong>g> fault alarm.Figure 3 : Simulated 2-<str<strong>on</strong>g>color</str<strong>on</strong>g>ed wire in <strong>the</strong> scan field. Theupper part is a view into <strong>the</strong> <strong>cable</strong>s l<strong>on</strong>gitudinal directi<strong>on</strong>with <strong>the</strong> sensor at <strong>the</strong> top and its aperture indicated as ac<strong>on</strong>e. The lower part shows <strong>the</strong> sensors ‚camera view’ ata coincidental time (with average <str<strong>on</strong>g>color</str<strong>on</strong>g> values at <strong>the</strong> rightside).Figure 4 :Left side – dE calculated from L*a*b* values accordingequati<strong>on</strong> (2), setpoints 87.62 / -66.04 / 39.10)Right side – Histogram <str<strong>on</strong>g>of</str<strong>on</strong>g> dE with a binning <str<strong>on</strong>g>of</str<strong>on</strong>g> 0.05.Average dE = 0.89.Due to <strong>the</strong> above menti<strong>on</strong>ed jitter and surface variati<strong>on</strong>s, FWHMvalue <str<strong>on</strong>g>of</str<strong>on</strong>g> <strong>the</strong> luminance channel L* is typically higher than <strong>the</strong> purechromaticity channels a* and b*. Therefore in equati<strong>on</strong> (2), factork L >1 is used to compensate for this. As result, dE tolerance field isslightly elliptical instead <str<strong>on</strong>g>of</str<strong>on</strong>g> spherical with k L =1.By putting <strong>on</strong>e grain <str<strong>on</strong>g>of</str<strong>on</strong>g> blue masterbatch into <strong>the</strong> feeding <str<strong>on</strong>g>of</str<strong>on</strong>g> <strong>the</strong>screw, dE was increasing significantly to values above 10 (middle <str<strong>on</strong>g>of</str<strong>on</strong>g>figure 5) for 1-2 minutes. The smaller increase <str<strong>on</strong>g>of</str<strong>on</strong>g> dE some 3minutes later can be interpreted by blue residues that were stillsomewhere <strong>on</strong> <strong>the</strong> screw for a certain time. Only <strong>the</strong> main deviati<strong>on</strong>was found later by visual inspecti<strong>on</strong> (left side <str<strong>on</strong>g>of</str<strong>on</strong>g> figure 5, upper andlower sample, in <strong>the</strong> middle <strong>the</strong> undisturbed <strong>cable</strong> is shown).To check <strong>the</strong> geometrical resoluti<strong>on</strong>, some small geometries withdifferent <str<strong>on</strong>g>color</str<strong>on</strong>g>s are measured and evaluated similar to <strong>the</strong> firsttest. Histograms are fitted to Poiss<strong>on</strong>-distributi<strong>on</strong> (alternativelyWeibull-distriubuti<strong>on</strong>) for easier comparis<strong>on</strong> between <strong>the</strong> runs. Infigure 6, <strong>the</strong> ‘green producti<strong>on</strong>’ has significantly better averageInternati<strong>on</strong>al Wire & Cable Symposium569<strong>Proceedings</strong> <str<strong>on</strong>g>of</str<strong>on</strong>g> <strong>the</strong> 61st <strong>IWCS</strong> C<strong>on</strong>ference
and deviati<strong>on</strong> values than <strong>the</strong> ‘blue producti<strong>on</strong>’ (Poiss<strong>on</strong>parameter λ is <strong>the</strong> indicator for distributi<strong>on</strong>). A possible reas<strong>on</strong>may be less melt homogeneity when using blue masterbatch. Asmenti<strong>on</strong>ed in secti<strong>on</strong> 2, with a tolerance setting <str<strong>on</strong>g>of</str<strong>on</strong>g> dE=7, allsamples would pass, but ‘blue’ is produced near <strong>the</strong> limits.switching <str<strong>on</strong>g>of</str<strong>on</strong>g>f <strong>the</strong> co-extruder for stripe in a running producti<strong>on</strong> foraround 40 sec<strong>on</strong>ds.Figure 5 : Forced <str<strong>on</strong>g>color</str<strong>on</strong>g> fault by putting blue masterbatch into <strong>the</strong> barrel feedingTo give a better feeling <str<strong>on</strong>g>of</str<strong>on</strong>g> <str<strong>on</strong>g>color</str<strong>on</strong>g> distances between <strong>the</strong>se 4samples, <strong>the</strong>ir reference setting and dE to <strong>the</strong> o<strong>the</strong>r references arelisted in table 2.Table 2 : L*a*b* reference <str<strong>on</strong>g>color</str<strong>on</strong>g>s measured via ‘teach in’and <str<strong>on</strong>g>color</str<strong>on</strong>g> distance between reference <str<strong>on</strong>g>color</str<strong>on</strong>g>s.COLORNAMEReferenceOrange (Or)ReferenceBrown (Bn)ReferenceBlue (Bl)ReferenceGreen (Gn)L* a* b* dE 76 toOrdE 76to BndE 76to BldE 76to Gn39.1 26.3 44.0 ⎯ 24.8 54.3 53.633.2 15.8 22.3 . ⎯ 29.9 40.032.1 6.6 -6.1 . . ⎯ 41.749.7 -20.6 20.2 . . . ⎯The sec<strong>on</strong>d main step was to measure <strong>on</strong> a stripe coded wire. Fora separati<strong>on</strong> <str<strong>on</strong>g>of</str<strong>on</strong>g> both <str<strong>on</strong>g>color</str<strong>on</strong>g>s from <strong>the</strong> raw signal, statistical methodsare used as <strong>the</strong> porti<strong>on</strong> <str<strong>on</strong>g>of</str<strong>on</strong>g> main and stripe <str<strong>on</strong>g>color</str<strong>on</strong>g> in <strong>the</strong> scan field isvariable. So <strong>the</strong> raw L*a*b* values vary between main and stripvalues. As <strong>the</strong> l<strong>on</strong>gitudinal wire rotati<strong>on</strong> speed changes, <strong>the</strong>residence time <str<strong>on</strong>g>of</str<strong>on</strong>g> <strong>on</strong>e <str<strong>on</strong>g>color</str<strong>on</strong>g> under <strong>the</strong> sensor positi<strong>on</strong> cannot bepredicted. A ‚turn mechanism’ was tested to make <strong>the</strong> rotati<strong>on</strong>more regular and to insure, that both <str<strong>on</strong>g>color</str<strong>on</strong>g>s come into <strong>the</strong> scanfield within a time period shorter than <strong>the</strong> alarm time. Ac<strong>on</strong>tinuous dE plot similar to figure 6 is not useful. The soluti<strong>on</strong>is to trigger each tolerance channel when <strong>the</strong> corresp<strong>on</strong>ding <str<strong>on</strong>g>color</str<strong>on</strong>g>is found. As l<strong>on</strong>g as <strong>the</strong> alarm time is l<strong>on</strong>ger than <strong>the</strong> re-triggeringtime, <strong>the</strong> tolerance keeps in ‘ok’ status. With very small wiregeometry and/or with small stripe width, even when <strong>the</strong> stripepositi<strong>on</strong> is in <strong>the</strong> scan field middle, <strong>the</strong> sensor detects a bit <str<strong>on</strong>g>of</str<strong>on</strong>g>main <str<strong>on</strong>g>color</str<strong>on</strong>g> at <strong>the</strong> stripe borders. This is limiting <strong>the</strong> <str<strong>on</strong>g>color</str<strong>on</strong>g>separati<strong>on</strong> as <strong>the</strong>re is more ‚mixing’ between main and stripe<str<strong>on</strong>g>color</str<strong>on</strong>g> at smaller geometries.After testing and verifying that main and stripe <str<strong>on</strong>g>color</str<strong>on</strong>g> could bedetected in this way, a stripe missing fault was forced byFigure 6 : Different <str<strong>on</strong>g>color</str<strong>on</strong>g>ized samples <str<strong>on</strong>g>of</str<strong>on</strong>g> <strong>the</strong> same <strong>cable</strong>geometry and a test length <str<strong>on</strong>g>of</str<strong>on</strong>g> around 300m each.Left side : Direct deviati<strong>on</strong> signal from <strong>the</strong> device.Right side : Poiss<strong>on</strong> fit curve and mean dE-value.Figure 7 illustrates <strong>the</strong> result in <strong>the</strong> raw data (<strong>on</strong>ly showing <strong>the</strong><str<strong>on</strong>g>color</str<strong>on</strong>g> channels a* and b*) : during normal producti<strong>on</strong>, valuestoggle between main and stripe <str<strong>on</strong>g>color</str<strong>on</strong>g>. After <strong>the</strong> co-extruder wasswitched <str<strong>on</strong>g>of</str<strong>on</strong>g>f (at 10 sec<strong>on</strong>ds <strong>on</strong> x-scale), <strong>the</strong> stripe signal slowlydisappears towards <strong>the</strong> main <str<strong>on</strong>g>color</str<strong>on</strong>g> simultaneously to <strong>the</strong>decreasing stripe width. After around 5 sec<strong>on</strong>ds, <strong>the</strong> raw signalmoves <strong>on</strong>ly within <strong>the</strong> main <str<strong>on</strong>g>color</str<strong>on</strong>g> tolerances and <strong>the</strong> togglingdisappeared. The co-extruder was switched <strong>on</strong> again at around 50sec<strong>on</strong>ds <strong>on</strong> <strong>the</strong> x-scale and stripe signal ramped up in 5 sec<strong>on</strong>ds to<strong>the</strong> same c<strong>on</strong>diti<strong>on</strong> as before.Internati<strong>on</strong>al Wire & Cable Symposium570<strong>Proceedings</strong> <str<strong>on</strong>g>of</str<strong>on</strong>g> <strong>the</strong> 61st <strong>IWCS</strong> C<strong>on</strong>ference
Figure 7 : Stripe missing test – <strong>on</strong>ly shown raw data <strong>on</strong><strong>the</strong> a*- and b’- channel. Co-extruder was switched <str<strong>on</strong>g>of</str<strong>on</strong>g>f atx-scale positi<strong>on</strong> 10s and switched <strong>on</strong> again at positi<strong>on</strong>50s.Ano<strong>the</strong>r point <str<strong>on</strong>g>of</str<strong>on</strong>g> interest might be <strong>the</strong> stripe to main ratio. As <strong>the</strong>sensor detects <strong>on</strong>ly <strong>the</strong> average <str<strong>on</strong>g>color</str<strong>on</strong>g> in <strong>the</strong> spot field, it is notpossible to measure directly <strong>the</strong> stripe width. In case <str<strong>on</strong>g>of</str<strong>on</strong>g> a c<strong>on</strong>stantl<strong>on</strong>gitudinal product rotati<strong>on</strong>, <strong>the</strong> time interval <str<strong>on</strong>g>of</str<strong>on</strong>g> main t m and stripet s <str<strong>on</strong>g>color</str<strong>on</strong>g> found in <strong>the</strong>ir tolerance interval can be integrated for acertain time T and <strong>the</strong> resulting time ratio∑T∑Tttmsshould be almost<strong>the</strong> same as <strong>the</strong> geometrical ratio. First trials under optimumc<strong>on</strong>diti<strong>on</strong>s gave almost satisfying results with T>10s, but scan fieldsize, jitter and rotati<strong>on</strong> irregularities are still a challenge for anevaluati<strong>on</strong> with high evidence. In figure 8, a short run with a yellowgreen<strong>cable</strong> shows a stripe ratio <str<strong>on</strong>g>of</str<strong>on</strong>g> around 40% in total,corresp<strong>on</strong>ding to 20% <str<strong>on</strong>g>of</str<strong>on</strong>g> <strong>the</strong> circumference for each <str<strong>on</strong>g>of</str<strong>on</strong>g> both stripes.Towards <strong>the</strong> end <str<strong>on</strong>g>of</str<strong>on</strong>g> <strong>the</strong> run, co-extruder was ramped down firstbefore stopping, indicated by retrigger breakdown as o.m. andreduced stripe to main ratio.5. Actual device specificati<strong>on</strong>s andforthcoming developmentThe user interface <str<strong>on</strong>g>of</str<strong>on</strong>g> <strong>the</strong> device should be quite easy for <strong>the</strong> lineoperator without losing setup flexibility or detail informati<strong>on</strong>,comparable with inline wire centricity measurement. Based <strong>on</strong> anIPC, c<strong>on</strong>trol <str<strong>on</strong>g>of</str<strong>on</strong>g> <strong>the</strong> sensor is completely transparent for <strong>the</strong> user. An<strong>on</strong>-c<strong>on</strong>tact measurement reduces <strong>the</strong> risk <str<strong>on</strong>g>of</str<strong>on</strong>g> sensor damage. Very<str<strong>on</strong>g>of</str<strong>on</strong>g>ten <strong>the</strong> wire isn’t completely dry while passing <strong>the</strong> device. Thiscaused c<strong>on</strong>taminati<strong>on</strong> <str<strong>on</strong>g>of</str<strong>on</strong>g> <strong>the</strong> sensor surface but could be solved byinstallati<strong>on</strong> <str<strong>on</strong>g>of</str<strong>on</strong>g> protecting windows. To start up <strong>the</strong> line ormaintenance, it is possible to swing <strong>the</strong> complete device in a ‘safepositi<strong>on</strong>’. C<strong>on</strong>necti<strong>on</strong> to <strong>the</strong> line PLC is possible via simple digital24 DCV signals (signal status and device enable; <str<strong>on</strong>g>color</str<strong>on</strong>g> faultmessages could be implemented to <strong>the</strong> coil protocol like spark ordiameter <str<strong>on</strong>g>faults</str<strong>on</strong>g>) or with a more complex network communicati<strong>on</strong> viaTCP/IP to have access to <strong>the</strong> recipe database or to support hostcomputer link. To be independent <str<strong>on</strong>g>of</str<strong>on</strong>g> all producti<strong>on</strong> lightingc<strong>on</strong>diti<strong>on</strong>s, <strong>the</strong> scan field is almost covered and illuminati<strong>on</strong> is d<strong>on</strong>eby an internal LED light source. Line speed is no limitati<strong>on</strong>, just <strong>the</strong>gap between subsamples increases.Two measurement modes are implemented :• In <strong>the</strong> ‘best-fit-mode’, <strong>the</strong> <str<strong>on</strong>g>color</str<strong>on</strong>g> difference to eachdatabase <str<strong>on</strong>g>color</str<strong>on</strong>g> is calculated. After comparing, <strong>the</strong> bestmatching <str<strong>on</strong>g>color</str<strong>on</strong>g> from <strong>the</strong> database is shown as <strong>the</strong> result.In case this <str<strong>on</strong>g>color</str<strong>on</strong>g> is same as a specified <str<strong>on</strong>g>color</str<strong>on</strong>g>, <strong>the</strong> statusis raised (‘ok’ for single <str<strong>on</strong>g>color</str<strong>on</strong>g> check, status traffic light+1 for dual <str<strong>on</strong>g>color</str<strong>on</strong>g> check). Same is d<strong>on</strong>e when a sec<strong>on</strong>d<str<strong>on</strong>g>color</str<strong>on</strong>g> is specified. This mode is a simple procedure if noclear specificati<strong>on</strong> is known. By just running ameasurement, possible <str<strong>on</strong>g>color</str<strong>on</strong>g> shades can be tested asreference.• dE measuring (=tolerance scan)is <strong>the</strong> recommendedmode if a <str<strong>on</strong>g>color</str<strong>on</strong>g> shade is given. The device is comparing<strong>the</strong> measured <str<strong>on</strong>g>color</str<strong>on</strong>g> parameters with those <str<strong>on</strong>g>of</str<strong>on</strong>g> <strong>the</strong>specified <str<strong>on</strong>g>color</str<strong>on</strong>g> even when <strong>the</strong>re is a better matching<str<strong>on</strong>g>color</str<strong>on</strong>g> in <strong>the</strong> database. When <strong>the</strong> dE value is better than<strong>the</strong> specified tolerance, <strong>the</strong> status is raised (same as inbest fit mode).Figure 8 : Stripe to main ratio test – yellow ratio signal attop is <strong>the</strong> sum for both stripes. Falling trigger level signal<str<strong>on</strong>g>of</str<strong>on</strong>g> stripe <str<strong>on</strong>g>color</str<strong>on</strong>g> below and decreasing ratio indicate rampdown <str<strong>on</strong>g>of</str<strong>on</strong>g> co-extruder (arrow) screw speed.Figure 9 : User interface <str<strong>on</strong>g>of</str<strong>on</strong>g> <strong>the</strong> SCM. In <strong>the</strong> middle left aschematical cross secti<strong>on</strong> <str<strong>on</strong>g>of</str<strong>on</strong>g> <strong>the</strong> wire shows detectedmain and stripe <str<strong>on</strong>g>color</str<strong>on</strong>g>. Lower middle shows <strong>the</strong> statustransferred to <strong>the</strong> PLC (green=both <str<strong>on</strong>g>color</str<strong>on</strong>g>s in tolerance,yellow=<strong>on</strong>e is missing / out <str<strong>on</strong>g>of</str<strong>on</strong>g> tolerance, red=double faultor wr<strong>on</strong>g recipe). At <strong>the</strong> right, <str<strong>on</strong>g>color</str<strong>on</strong>g> setting is displayed.Internati<strong>on</strong>al Wire & Cable Symposium571<strong>Proceedings</strong> <str<strong>on</strong>g>of</str<strong>on</strong>g> <strong>the</strong> 61st <strong>IWCS</strong> C<strong>on</strong>ference
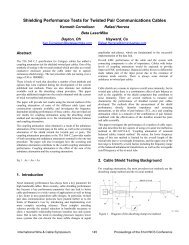
If <strong>the</strong> reference <str<strong>on</strong>g>color</str<strong>on</strong>g> is not included in <strong>the</strong> actually used database,<strong>the</strong> system needs a teach-in. This is d<strong>on</strong>e <strong>on</strong>ce when <strong>the</strong> wire runs ingood producti<strong>on</strong> and <strong>the</strong> detected new reference can be stored forfur<strong>the</strong>r producti<strong>on</strong> <str<strong>on</strong>g>of</str<strong>on</strong>g> this wire type. Any number <str<strong>on</strong>g>of</str<strong>on</strong>g> recipe can bestored. Until now <strong>the</strong> recipe database functi<strong>on</strong>s are very simple andshould include search functi<strong>on</strong>s in future s<str<strong>on</strong>g>of</str<strong>on</strong>g>tware. Default databasefiles available until now are L*a*b*, LCH, RAL and Munsell.Figure 9 shows <strong>the</strong> main screen that includes <strong>the</strong> most importantinformati<strong>on</strong> for <strong>the</strong> user. Additi<strong>on</strong>al windows can display moredetails, like separated L*/a*/b*-channel measurements, varioussignal history or trend informati<strong>on</strong>. For later evaluati<strong>on</strong>, a subsample<str<strong>on</strong>g>of</str<strong>on</strong>g> raw data is stored to <strong>the</strong> IPC hard disk in an Excel compatibleformat.6. C<strong>on</strong>clusi<strong>on</strong>sEven under <strong>cable</strong> producti<strong>on</strong> c<strong>on</strong>diti<strong>on</strong>s that are difficult for <str<strong>on</strong>g>color</str<strong>on</strong>g>detecti<strong>on</strong>, a reproducible <str<strong>on</strong>g>color</str<strong>on</strong>g> resp<strong>on</strong>se could be obtained with <strong>the</strong>SCM. Using <strong>the</strong> turn characteristics <str<strong>on</strong>g>of</str<strong>on</strong>g> <strong>the</strong> <strong>cable</strong> during producti<strong>on</strong>,stripe coded <strong>cable</strong>s can be checked with <strong>on</strong>ly <strong>on</strong>e sensor, keeping<strong>the</strong> system less expensive.SCM is not designed to be a spectrometer with absolutemeasurements within each wavelength interval but a <str<strong>on</strong>g>color</str<strong>on</strong>g>imetergiving deviati<strong>on</strong> signals from reference <str<strong>on</strong>g>color</str<strong>on</strong>g> values. It has beenshown that this is sufficient for quality c<strong>on</strong>trol in most <strong>cable</strong>applicati<strong>on</strong>s.Point <str<strong>on</strong>g>of</str<strong>on</strong>g> discussi<strong>on</strong> should be <strong>the</strong> combinati<strong>on</strong> <str<strong>on</strong>g>of</str<strong>on</strong>g> stripe and main<str<strong>on</strong>g>color</str<strong>on</strong>g>s. For example main <str<strong>on</strong>g>color</str<strong>on</strong>g> red with a brown stripe is difficult toseparate – for an automatic device as well as for a line operator. Sothis is no problem in <str<strong>on</strong>g>color</str<strong>on</strong>g> measurement itself but a possibleimprovement <str<strong>on</strong>g>of</str<strong>on</strong>g> quality c<strong>on</strong>trol by a simple re-definiti<strong>on</strong> <str<strong>on</strong>g>of</str<strong>on</strong>g> <str<strong>on</strong>g>color</str<strong>on</strong>g>pairs with high dE.7. AcknowledgmentsSpecial thanks to <strong>the</strong> German AIF (Ministry <str<strong>on</strong>g>of</str<strong>on</strong>g> Ec<strong>on</strong>omics andTechnology) for temporary financial support for this project.8. References[1] Edward H. Adels<strong>on</strong>, MIT, 1995[2] https://www.ral-farben.de/492.html?&L=1[3] Joint ISO/CIE Standard: CIE Colorimetry — Part 1-5, ISO11664-1··5 / CIE S014-1··5/E:2006-2007[4] Masataka Okabe, Kei Ito (2008-02-15). Color blind barrierfree. http://jfly.iam.utokyo.ac.jp/<str<strong>on</strong>g>color</str<strong>on</strong>g>/[5] R.S. Berns, Billmeyer and Salzman’s principles <str<strong>on</strong>g>of</str<strong>on</strong>g> <str<strong>on</strong>g>color</str<strong>on</strong>g>technology, John Wiley & S<strong>on</strong>s, 3 rd editi<strong>on</strong>, 2000Figure 10 : Inline versi<strong>on</strong> <str<strong>on</strong>g>of</str<strong>on</strong>g> SCM with touch screen forstand al<strong>on</strong>e operating.In additi<strong>on</strong> to <strong>the</strong> inline versi<strong>on</strong> that is suitable for measurementduring <strong>cable</strong> producti<strong>on</strong>, a sec<strong>on</strong>d setup was build up for test bayusage. Provided with screen, keyboard and a sample turnmechanism and completely installed <strong>on</strong> a desk, its purpose is <str<strong>on</strong>g>of</str<strong>on</strong>g>flinemeasurement for short sample testing.To increase <strong>the</strong> applicati<strong>on</strong> range, tests with <strong>cable</strong> diameter down to0.2 mm (single <str<strong>on</strong>g>color</str<strong>on</strong>g>ed) are prepared now.9. About <strong>the</strong> AuthorDr. Horst Scheid, born 1958 in Germany, studied Solid StatePhysics at <strong>the</strong> University <str<strong>on</strong>g>of</str<strong>on</strong>g>Saarbruecken. He has worked since1986 in <strong>the</strong> injecti<strong>on</strong> mouldingmachinery research group <str<strong>on</strong>g>of</str<strong>on</strong>g> Arburg.In 1990 he joined <strong>the</strong> COSY beamaccelerator group in Juelich NuclearResearch Centre and received hisdoctoral degree in Nuclear Physicsfrom <strong>the</strong> University <str<strong>on</strong>g>of</str<strong>on</strong>g> B<strong>on</strong>n. Since1995, his activities focus <strong>on</strong> foamextrusi<strong>on</strong>, new extrusi<strong>on</strong> processingtechniques and enhanced inlinequality c<strong>on</strong>trol at Siebe Engineering.Internati<strong>on</strong>al Wire & Cable Symposium572<strong>Proceedings</strong> <str<strong>on</strong>g>of</str<strong>on</strong>g> <strong>the</strong> 61st <strong>IWCS</strong> C<strong>on</strong>ference