<strong>Franklin</strong> Quotential January 31, 2014<strong>Franklin</strong> Quotential Growth PortfolioEffective July 29, 2013, Quotential Growth Portfolio and Quotential Growth Corporate Class Portfolio were renamed <strong>Franklin</strong> Quotential Growth Portfolio and<strong>Franklin</strong> Quotential Growth Corporate Class Portfolio, respectively.<strong>Franklin</strong> Multi-Asset StrategiesINVESTMENT OBJECTIVE & STRATEGYLong-term capital appreciation by investing primarily ina diversified mix of equity mutual funds, with additionalstability derived from investing in income mutual funds.MORNINGSTAR CATEGORYGlobal Equity BalancedRATINGMorningstar Rating OverallPORTFOLIO MANAGERSBrent SmithStephen LingardFUND FACTS23 Years, Florida, United States20 Years, Toronto, CanadaPrice per Unit $7.29Assets of the Fund $602,846,776 2MonthlyDistributionSeries T8% target annual distribution 1Inception Date 08/19/2002Positions 31Portfolio Turnover Rate (06/30/2013) 31.75%MER (06/30/2013 incl. HST) 2.50%BenchmarkMSCI AC World ($CDN) 45%, S&P/ TSXComposite TRI 35%, DEX Universe Bond 15%,Barclays Multiverse hedged 5%1 Target distributions are not guaranteed and may change at the discretion of <strong>Franklin</strong><strong>Templeton</strong> <strong>Investments</strong>. The portfolio may also pay capital gains in December if required.2 Inclusive of trust and corporate class versions where applicable.RISK CLASSIFICATIONLowLow toMediumMediumMedium toHighHighFUND CODESSERIES CDN$ US$Series A Front 660 662Series A DSC 661 663Series A Low Load 645 644Series F 672 673Series I 679 680Series O 686 687Series R 3071Series T Front 3053Series T DSC 3055Series T Low Load 3054CORPORATE CLASS CDN$ US$Series A Front 1040 1046Series A DSC 1042 1048Series A Low Load 1041 1047Series F 1043 1049Series I 3372 3373Series O 1045 1051Series S 3189Series T Front 3185Series T DSC 3187Series T Low Load 3186MEDIUM- TO LONG-TERM GROWTH POTENTIAL WITH LESS RISK• Enhanced return potential. By investing in U.S., global and international equities, the Portfolio provides broadexposure to a wide range of important capital markets, helping to increase return potential.• Long-term growth potential. With an 80% equity weighting and a 20% income weighting range, the Portfolio isdesigned for growth-oriented investors who want to maintain some income exposure for additional stabilityand diversification.Calendar Year Returns in Canadian Dollars (%)2013 2012 2011 2010 2009 2008 2007 2006 2005 2004Series A 19.52 7.56 -7.63 9.80 27.39 -31.11 -1.32 13.34 8.78 7.73Category Average Return 18.50 9.34 -4.93 8.71 18.37 -23.20 -2.13 12.61 7.95 6.82Source: Morningstar Research Inc.40.00%20.00%0.00%-20.00%-40.00%2013 2012 2011 2010 2009 2008 2007 2006 2005 2004• Series ACompounded Returns and Category Returns in Canadian Dollars (%)• Category Average ReturnYTD 1 Mo 3 Mo 6 Mo 1 Year 3 Years 5 Years 10 years Since Inc^Series A 0.14 0.14 4.19 11.66 16.08 5.83 11.59 3.84 4.48Category Average Return 0.53 0.53 3.84 9.81 15.62 6.94 10.79 4.19 4.85Source: Morningstar Research Inc.HOLDINGSGeographic Weightings (% of Total)^ Fund inception dateUnited States 26.95Canada 24.40Japan 9.12United Kingdom 6.93China 2.37Euro Community 2.16France 1.71Netherlands 1.50Germany 1.46Others 23.40Top Holdings (%)<strong>Franklin</strong> Bissett Bond Fund, Series O 6.78<strong>Franklin</strong> Flex Cap Growth Fund, Series O 6.67<strong>Franklin</strong> Bissett Canadian Equity Fund, Series O 6.52FTIF <strong>Franklin</strong> Mutual European Fund, Series I (Acc) 5.98iShares MSCI Japan ETF 5.64<strong>Franklin</strong> World Growth Fund, Series O 5.62<strong>Templeton</strong> Asian Growth Fund, Series O 4.79<strong>Franklin</strong> U.S. Core Equity Fund, Series O 4.57<strong>Franklin</strong> Mutual Global Discovery Fund, Series O 4.54<strong>Templeton</strong> International Stock Fund, Series O 4.46Asset Class Weightings (%)• Common Stocks 65.80<strong>Investments</strong> in Exchange-• Traded Funds 14.45• Bonds 10.38Short-term securities and all• other assets, net 6.38Other assets (of Underlying• Funds) 2.76• Preferred Stocks 0.18<strong>Investments</strong> in Underlying• Funds 0.05This Portfolio offered in Corporate Class-Series T. With this Portfolio, you can switch seamlessly between Corporate Class-Series A—to maximize tax-deferredcompound growth—and Corporate Class-Series T, to fine-tune cash flow requirements.Did you know? Flexible Series T units of this Portfolio pay monthly Return of Capital distributions of 0-8% of the final NAV of the previous year and split into 12monthly installments. 8% targeted Series T Return of Capital payout rate may change at the discretion of <strong>Franklin</strong> <strong>Templeton</strong> <strong>Investments</strong> Corp.660 FFE 01144 <strong>advisormonthly</strong> FRANKLIN TEMPLETON INVESTMENTS For Dealer Use Only. Not For Distribution to the Public.
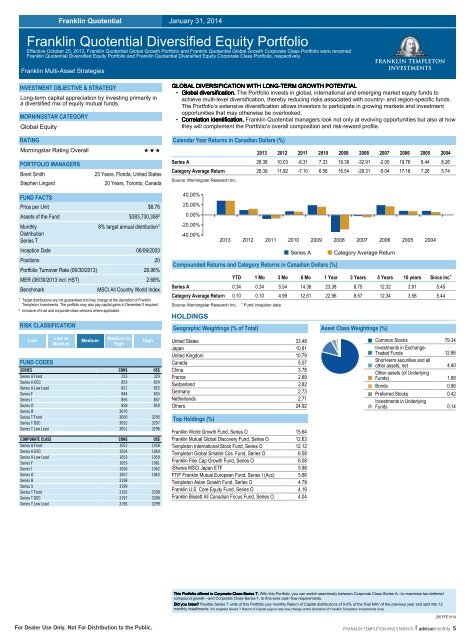
<strong>Franklin</strong> Quotential January 31, 2014<strong>Franklin</strong> Quotential Diversified Equity PortfolioEffective October 25, 2013, <strong>Franklin</strong> Quotential Global Growth Portfolio and <strong>Franklin</strong> Quotential Global Growth Corporate Class Portfolio were renamed<strong>Franklin</strong> Quotential Diversified Equity Portfolio and <strong>Franklin</strong> Quotential Diversified Equity Corporate Class Portfolio, respectively.<strong>Franklin</strong> Multi-Asset StrategiesINVESTMENT OBJECTIVE & STRATEGYLong-term capital appreciation by investing primarily ina diversified mix of equity mutual funds.MORNINGSTAR CATEGORYGlobal EquityGLOBAL DIVERSIFICATION WITH LONG-TERM GROWTH POTENTIAL• Global diversification. The Portfolio invests in global, international and emerging market equity funds toachieve multi-level diversification, thereby reducing risks associated with country- and region-specific funds.The Portfolio’s extensive diversification allows investors to participate in growing markets and investmentopportunities that may otherwise be overlooked.• Correlation identification. <strong>Franklin</strong> Quotential managers look not only at evolving opportunities but also at howthey will complement the Portfolio’s overall composition and risk-reward profile.RATINGMorningstar Rating OverallPORTFOLIO MANAGERSBrent SmithStephen Lingard23 Years, Florida, United States20 Years, Toronto, CanadaCalendar Year Returns in Canadian Dollars (%)2013 2012 2011 2010 2009 2008 2007 2006 2005 2004Series A 28.38 10.03 -8.31 7.33 19.39 -32.91 -2.00 19.76 8.44 8.26Category Average Return 28.39 11.92 -7.10 6.58 16.54 -29.31 -5.04 17.18 7.26 5.74Source: Morningstar Research Inc.FUND FACTSPrice per Unit $8.76Assets of the Fund $383,730,358 2MonthlyDistributionSeries T8% target annual distribution 1Inception Date 06/09/2003Positions 20Portfolio Turnover Rate (06/30/2013) 26.96%MER (06/30/2013 incl. HST) 2.68%BenchmarkMSCI All Country World Index1 Target distributions are not guaranteed and may change at the discretion of <strong>Franklin</strong><strong>Templeton</strong> <strong>Investments</strong>. The portfolio may also pay capital gains in December if required.2 Inclusive of trust and corporate class versions where applicable.RISK CLASSIFICATIONLowFUND CODESLow toMediumMediumMedium toHighHighSERIES CDN$ US$Series A Front 255 324Series A DSC 823 824Series A Low Load 821 822Series F 844 855Series I 856 857Series O 858 859Series R 3070Series T Front 3050 3295Series T DSC 3052 3297Series T Low Load 3051 3296CORPORATE CLASS CDN$ US$Series A Front 1052 1058Series A DSC 1054 1060Series A Low Load 1053 1059Series F 1055 1061Series I 1056 1062Series O 1057 1063Series R 3198Series S 3199Series T Front 3195 3298Series T DSC 3197 3300Series T Low Load 3196 329940.00%20.00%0.00%-20.00%-40.00%2013 2012 2011 2010 2009 2008 2007 2006 2005 2004• Series ACompounded Returns and Category Returns in Canadian Dollars (%)• Category Average ReturnYTD 1 Mo 3 Mo 6 Mo 1 Year 3 Years 5 Years 10 years Since Inc^Series A 0.34 0.34 5.54 14.36 23.38 8.75 12.32 3.91 5.45Category Average Return 0.10 0.10 4.99 12.61 22.96 9.57 12.34 3.58 5.44Source: Morningstar Research Inc.HOLDINGSGeographic Weightings (% of Total)^ Fund inception dateUnited States 33.48Japan 10.81United Kingdom 10.79Canada 5.07China 3.78France 2.89Switzerland 2.82Germany 2.73Netherlands 2.71Others 24.92Top Holdings (%)<strong>Franklin</strong> World Growth Fund, Series O 15.64<strong>Franklin</strong> Mutual Global Discovery Fund, Series O 12.63<strong>Templeton</strong> International Stock Fund, Series O 12.12<strong>Templeton</strong> Global Smaller Cos. Fund, Series O 6.58<strong>Franklin</strong> Flex Cap Growth Fund, Series O 6.08iShares MSCI Japan ETF 5.98FTIF <strong>Franklin</strong> Mutual European Fund, Series I (Acc) 5.86<strong>Templeton</strong> Asian Growth Fund, Series O 4.79<strong>Franklin</strong> U.S. Core Equity Fund, Series O 4.19<strong>Franklin</strong> Bissett All Canadian Focus Fund, Series O 4.04Asset Class Weightings (%)• Common Stocks 79.34<strong>Investments</strong> in Exchange-• Traded Funds 12.86Short-term securities and all• other assets, net 4.40Other assets (of Underlying• Funds) 1.88• Bonds 0.96• Preferred Stocks 0.42<strong>Investments</strong> in Underlying• Funds 0.14This Portfolio offered in Corporate Class-Series T. With this Portfolio, you can switch seamlessly between Corporate Class-Series A—to maximize tax-deferredcompound growth—and Corporate Class-Series T, to fine-tune cash flow requirements.Did you know? Flexible Series T units of this Portfolio pay monthly Return of Capital distributions of 0-8% of the final NAV of the previous year and split into 12monthly installments. 8% targeted Series T Return of Capital payout rate may change at the discretion of <strong>Franklin</strong> <strong>Templeton</strong> <strong>Investments</strong> Corp.255 FFE 0114For Dealer Use Only. Not For Distribution to the Public.FRANKLIN TEMPLETON INVESTMENTS <strong>advisormonthly</strong> 5
- Page 1: advisormonthlyFEBRUARY 2014
- Page 4 and 5: Funds Table of Contents PageWE’RE
- Page 6 and 7: do your clients’portfolios havequ
- Page 8 and 9: Franklin Quotential January 31, 201
- Page 12 and 13: Emerging Markets Equity January 31,
- Page 14 and 15: Canadian Balanced January 31, 2014T
- Page 16 and 17: Global & International Equity Janua
- Page 18 and 19: Emerging Markets Equity January 31,
- Page 20 and 21: Global Fixed Income January 31, 201
- Page 22 and 23: Global Fixed Income January 31, 201
- Page 24 and 25: Global & International Equity Janua
- Page 26 and 27: U.S. Equity January 31, 2014Frankli
- Page 28 and 29: Global Balanced January 31, 2014Fra
- Page 30: Global Fixed Income January 31, 201
- Page 33 and 34: U.S. Equity January 31, 2014Frankli
- Page 35 and 36: Canadian Equity January 31, 2014Fra
- Page 37 and 38: Canadian Balanced January 31, 2014F
- Page 39 and 40: Canadian Dividend January 31, 2014F
- Page 41 and 42: Canadian Dividend January 31, 2014F
- Page 43 and 44: Canadian Fixed Income January 31, 2
- Page 45 and 46: Canadian Equity January 31, 2014Fra
- Page 47 and 48: Canadian Equity January 31, 2014Fra
- Page 49 and 50: U.S. Equity January 31, 2014Frankli
- Page 51 and 52: Global & International Equity Janua
- Page 53 and 54: Yield Class Solutions January 31, 2
- Page 55 and 56: estbuilt ® Portfolio Optimization
- Page 57 and 58: 2-Star Overall Morningstar RatingOV
- Page 59 and 60: GLOBAL THINKING. LOCAL PRESENCE.STE
- Page 61 and 62:
SERIES S SERIES T SERIES T SERIES T
- Page 63 and 64:
SERIES S SERIES T SERIES T SERIES T
- Page 65 and 66:
YEAR-TO- 1 3 6 1 3 5 10 SINCE INCEP
- Page 67 and 68:
GLOBAL THINKING. LOCAL PRESENCE.Cen