r - NIVA
r - NIVA
r - NIVA
Create successful ePaper yourself
Turn your PDF publications into a flip-book with our unique Google optimized e-Paper software.
Why physical models?In the Tungabhadra river, serious conflictsoriginate from the available water resourceswhich are not enough to sustain all the needsthat exist in the region for drinking water,agriculture (irrigation), fishery and industrialproduction. Not only the quantity of theresource is limited compared to the needs, butalso the quality, impaired by non-sustainableuse and less sound management, prevent theavailable water resources to be suitable forselected uses.The river basin is dominated by largeagricultural and urban settlements. The mainsources of pollution are agricultural runoff,untreated/partially treated wastewater fromindustries, urban sewage, and silt from miningactivities, which have greatly degraded thewater quality.Several water works have been built in the lastdecades to increase water storage atcatchment scale (dams, tanks) and to transferwater resources through canals to irrigatedagriculture areas.The complexity of landscape, climate andpollution sources (both point and diffusesources) require modelling tools to be used tohelpunderstand the complex interactions betweenthe various sources and environmentalprocesses.With the modelling tools, as in this case, it ispossible to estimate nutrient and sedimentloads and to quantify the effects on waterquality of downstream river reaches and/orreservoirs, including the identification ofpollution sources along with the requiredsource apportionment that is needed to rankcritical areas.These tools -as a single model or as chainedsequence of different models - can also beused in selecting suitable Best ManagementPractices, ranking of sources and expectedefficiency in nutrient reduction magnitude andcosts in addition to pollution impacts onvarious mitigation measures and scenarios.Modelling approach and dataavailability problems in theTungabhadra basinAs a first stage, a statistical assessment ofwater quality and quantity monitoring datawere performed in order to identify pollutionlevels and events.A detailed continuous semi-lumped model,SWAT, was then used to assess the spatialMonitoring and ModellingMeasured data from monitoring campaigns play a fundamental role in allowing tounderstand the processes acting in a catchment. They are also a prerequisite for allowingmodels of any type (simulation, statistical, et cetera) to be used and draw reliablepredictions from. Furthermore, in order for the model simulations to be trusted, a modelneed to be calibrated and validated through comparing the simulated time series againstmeasured ones.Thus monitoring campaigns must be planned well in advance and are worth the resourcesallocated to them.In this framework, key parameters to be considered include weather, river flow, waterquality, outlets and inlets, crop statistics. In particular the inclusion of ammonia, phosphorus(at least as total P) and sediment should be measured.STRIVER POLICY BRIEF / ISSUE NO. 7 3
Fig. 1 Water Balance maps; SWAT outputStakeholder participation all alongthe model processThe stakeholders were involved in all themajor stages in the entire process (Fig.3):1. during the “scoping” phase in which keyproblem areas are searched and ranked2. in evaluating model outputs in baselineconditions and in developing and agreeingon the “conceptual model” built on thebasis of the simulations3. in developing alternative, feasible,acceptable and consensus-basedscenarios to be evaluated using themodels.Fig. 2 Spatial distribution of Average SedimentYieldacceptable future changes. Scenario topicsparticularly addressed were (i) water demandfor different uses, (ii) land use and croppingpattern, (iii) agronomic practices, (iv)treatment of effluents and urban sewage, (v)sanitation practices in the rural areas, (vi)trend in urbanisation.The qualitative scenarios (in a 10-yearperspective) were then translated into thefollowing quantitative agreed scenarios:‣ Climate change: Hadrm3 model, A2 andB2 emission scenarios; 2070-2090 1‣ Sewage treatment: 80% septic tanks inrural areas; 50 % treatment in urbanareas‣ Change in irrigation: sprinkler system for80% areca nuts‣ “System for Rice Intensification” (SRI 2 ):40% shift upstream of the TB dam and10% downstreamFig. 3. Interactions of stakeholders andscientists at the different stages of themodelling process.Stakeholder-developed scenariosDuring the stakeholder meetings, theparticipants were divided into break-outgroups, each discussing the likely and1 Hadrm3 is a Regional Climate Model (RCM)and has been developed by the Hadley Centrefor Climate Prediction. A2 and B2 are twodifferent emission scenarios.2 System of Rise Intensification is a method ofincreasing rice yield developed in recent yearsbased on keeping soils moist but not saturatedand transplanting young rice seedling in awider way than traditional cropping method,STRIVER POLICY BRIEF / ISSUE NO. 7 5
These were then used as input to the SWATmodelling.‣ a lower groundwater recharge rate isexpected (Fig.4).30Results from the scenario analysisAfter the model was calibrated and validated inthe baseline simulation (R 2 >0.90 NS=0.44), itenabled us to apply the scenarios after havingparameterized them (that is convertingconcepts into numbers used by the model).However uncertainties present in the baselinesimulation are reflected into scenarios output:the scenario on irrigation changes is notcommented here because of uncertaintiesembedded in the cropping pattern andpractices.Some of the results can be summarized as inthe following Tab.1.Baseline A2 diff %Precip mm 829 928 12ET mm 469 539 15Surf.runoff mm 177 219 24Water Yld mm 334 365 9Sediment load t/ha 12.4 28.9 132water inflow reserv mm 261 444 70water outflow reserv mm 141 177 26sed.inflow reserv t/ha 0.6 1.9 253sed.outflow reserv t/ha 0.02 0.02 27Tab. 1 Summary results of the A2 climatechange scenarioThe climate scenario impact results indicatethe following:‣ a doubling in the sediment load;‣ the sediment inflow into the TB dam isexpected to increase three times whilethe sediment outflow will remain more orless stable. This will lead to a greatincrease of the siltation rate and areduced life-time of the dam;Relative Change (%2520151050-5-10Baseline to A2IPCC SRES Scenarios ComparisonPrecipitationSurface RunoffGW RechargeWater YieldAETBaseline to B2Fig.4 Change in water balancecomponents from baseline to A2 and B2The other simulated scenarios lead to thefollowing conclusions.‣ the simulated spread of SRI leads to anexpected 6% saving of the river basinwater yield, accompanied by an overallincrease of around 20% of rice yield;‣ the simulated sewage treatment scenarioshowed that a 50% reduction fromsewage discharge can be expected inboth N and P contribution to the overallriver pollution.Even if the model was calibrated only for thehydrology, scenarios simulations areconsidered reliable since:• climate change simulation are based onhydrology except for erosion;• calculated actual erosion rate is inagreement with measured siltation rate inthe Tungabhadra dam (since monitoredsediment transport is missing);• water saving due to SRI diffusion scenariois based on changes in irrigation and thenmostly on hydrology;• sewage treatment scenario is obtained onsimple point source load calculations.allowing higher yields, less seeds requirementand less water for irrigation.STRIVER POLICY BRIEF / ISSUE NO. 7 6
Management implications‣ It is necessary to put larger efforts inplanning effective monitoring activities:more frequent water quality sampling, alarger selection of parameters to bemeasured, namely phosphorus, ammoniaand suspended solids.‣ The actual high level of erosion andincrease in simulated trend in the futuredue to climate change suggest that erosioncontrol should gain a high priority in nextfuture landscape management policy.‣ Investment in improved sewage treatmentin urban and rural areas will significantlyreduce the nutrient load to the river andcan dramatically decrease the level ofpathogens in surface water.‣ Active policies must be undertaken with adeeper effort to help the diffusion of newtechniques in rice cropping (SRI) thatroved to play a relevant role in savingwater resources.Fig.4 The Tungabhadra Dam. Public domain. Courtesy of Wikipedia users (http://www.wikipedia.com).STRIVER POLICY BRIEF / ISSUE NO. 7 7
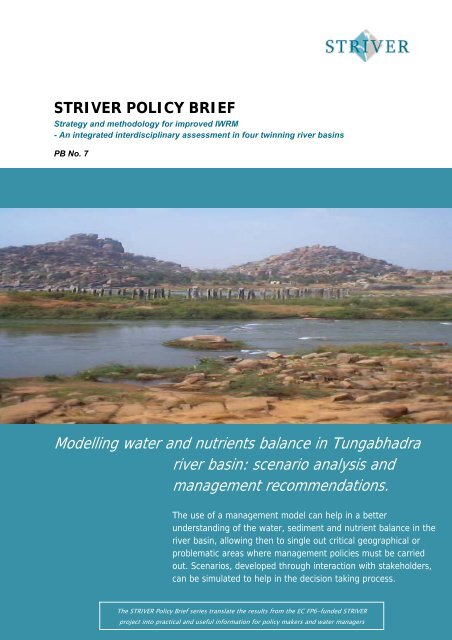
The STRIVER Policy and Technical Brief series translate theresults from the project into practical and useful information forpolicy makers and water managers.The Briefs are also available online: www.striver.noAbout STRIVERSTRIVER- Strategy and methodology for improved IWRM - Anintegrated interdisciplinary assessment in four twinning river basinsis a three year EC funded project 2006-2009 under the 6thframework programme (FP6) coordinated jointly by Bioforsk and<strong>NIVA</strong>. The point of departure for STRIVER is the lack of clearmethodologies and problems in operationalisation of IntegratedWater Resource Management (IWRM) as pointed out by both thescientific and management communities.13 partners from 9countries participate as contractual partners in addition to anexternal advisory board.Title of project:Strategy and methodology for improved IWRM- An integrated interdisciplinary assessment in four twinning riverbasins (STRIVER)Instrument: SUSTDEV-2005-3.II.3.6: Twinning European/thirdcountries river basins.Contract number: 037141Start date of project: July 2006 Duration: 36 monthsProject funded by the European Commission within the SixthFramework Programme (2002-2006)DisclaimerThe information provided and the opinions given in this publicationare not necessarily those of the authors or the EC. The authors andpublisher assume no liability for any loss resulting from the use ofthis report.Frontpage photo: Tungabhadra River at Hampi. Compliments ofHoboTraveler.com (http://www.hobotraveler.com)Editors: Per Stålnacke and Udaya Sekhar Nagothu (Bioforsk)Launch date: 17 November 2008STRIVER POLICY BRIEF / ISSUE NO. 7 8


