Reliability Questionnaire Result by the Difference of the Information ...
Reliability Questionnaire Result by the Difference of the Information ...
Reliability Questionnaire Result by the Difference of the Information ...

Create successful ePaper yourself
Turn your PDF publications into a flip-book with our unique Google optimized e-Paper software.
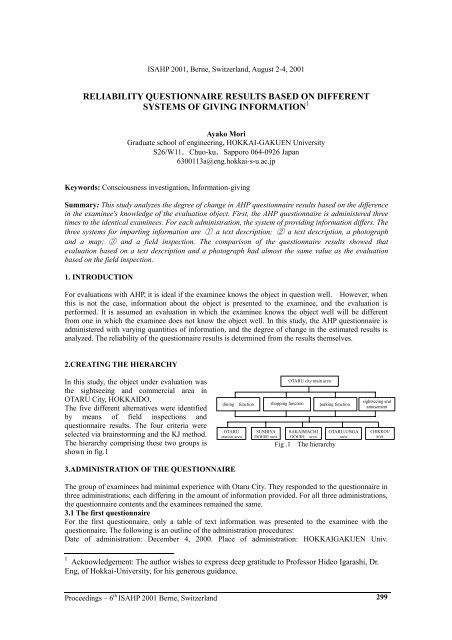
ISAHP 2001, Berne, Switzerland, August 2-4, 2001RELIABILITY QUESTIONNAIRE RESULTS BASED ON DIFFERENTSYSTEMS OF GIVING INFORMATION 1Ayako MoriGraduate school <strong>of</strong> engineering, HOKKAI-GAKUEN UniversityS26/W11,Chuo-ku,Sapporo 064-0926 Japan6300113a@eng.hokkai-s-u.ac.jpKeywords: Consciousness investigation, <strong>Information</strong>-givingSummary: This study analyzes <strong>the</strong> degree <strong>of</strong> change in AHP questionnaire results based on <strong>the</strong> differencein <strong>the</strong> examinee's knowledge <strong>of</strong> <strong>the</strong> evaluation object. First, <strong>the</strong> AHP questionnaire is administered threetimes to <strong>the</strong> identical examinees. For each administration, <strong>the</strong> system <strong>of</strong> providing information differs. Thethree systems for imparting information are 1 a text description; 2 a text description, a photographand a map; 3 and a field inspection. The comparison <strong>of</strong> <strong>the</strong> questionnaire results showed thatevaluation based on a text description and a photograph had almost <strong>the</strong> same value as <strong>the</strong> evaluationbased on <strong>the</strong> field inspection.1. INTRODUCTIONFor evaluations with AHP, it is ideal if <strong>the</strong> examinee knows <strong>the</strong> object in question well. However, whenthis is not <strong>the</strong> case, information about <strong>the</strong> object is presented to <strong>the</strong> examinee, and <strong>the</strong> evaluation isperformed. It is assumed an evaluation in which <strong>the</strong> examinee knows <strong>the</strong> object well will be differentfrom one in which <strong>the</strong> examinee does not know <strong>the</strong> object well. In this study, <strong>the</strong> AHP questionnaire isadministered with varying quantities <strong>of</strong> information, and <strong>the</strong> degree <strong>of</strong> change in <strong>the</strong> estimated results isanalyzed. The reliability <strong>of</strong> <strong>the</strong> questionnaire results is determined from <strong>the</strong> results <strong>the</strong>mselves.2.CREATING THE HIERARCHYIn this study, <strong>the</strong> object under evaluation was<strong>the</strong> sightseeing and commercial area inOTARU City, HOKKAIDO.The five different alternatives were identified<strong>by</strong> means <strong>of</strong> field inspections andquestionnaire results. The four criteria wereselected via brainstorming and <strong>the</strong> KJ method.The hierarchy comprising <strong>the</strong>se two groups isshown in fig.1dining functionOTARUstation areaSUSHIYADOURI areashopping functionOTARU city main areaSAKAIMACHIDOURI areaparking functionFig .1 The hierarchyOTARU-UNGAareasightseeing andamusementCHIKKOUarea3.ADMINISTRATION OF THE QUESTIONNAIREThe group <strong>of</strong> examinees had minimal experience with Otaru City. They responded to <strong>the</strong> questionnaire inthree administrations; each differing in <strong>the</strong> amount <strong>of</strong> information provided. For all three administrations,<strong>the</strong> questionnaire contents and <strong>the</strong> examinees remained <strong>the</strong> same.3.1 The first questionnaireFor <strong>the</strong> first questionnaire, only a table <strong>of</strong> text information was presented to <strong>the</strong> examinee with <strong>the</strong>questionnaire. The following is an outline <strong>of</strong> <strong>the</strong> administration procedures:Date <strong>of</strong> administration: December 4, 2000. Place <strong>of</strong> administration: HOKKAIGAKUEN Univ.1 Acknowledgement: The author wishes to express deep gratitude to Pr<strong>of</strong>essor Hideo Igarashi, Dr.Eng, <strong>of</strong> Hokkai-University, for his generous guidance.Proceedings – 6 th ISAHP 2001 Berne, Switzerland 299
Examinees: 10 people from <strong>the</strong> general population. Reference materials: Written descriptions <strong>of</strong> each area.The outline is shown in table 1.3.2 The second questionnaireImages as well as text were presented to <strong>the</strong>Table 1 Outline <strong>of</strong> text informationexaminee with <strong>the</strong> questionnaire. . Here is1Dining function:number <strong>of</strong> <strong>the</strong> restaurant・type <strong>of</strong>an outline <strong>of</strong> <strong>the</strong> procedures:Date <strong>of</strong> administration: December 5, 2000.Place <strong>of</strong> administration: HOKKAIGAKUENUniv. Examinees: The same as in <strong>the</strong> firstquestionnaire. Reference materials: The samewritten description from <strong>the</strong> first questionnaire,plus a map <strong>of</strong> OTARU city and photographs<strong>of</strong> each <strong>of</strong> <strong>the</strong> five areas were presented. Anexplanation was provided.3.3 The third questionnaire<strong>the</strong> meal・features 2shopping function:type andnumber <strong>of</strong> retail stores 3parking function:Availablespaces times <strong>the</strong> parking multiplier・Average chargefor 1 hour. The OTARU city parking lot list was alsopresented 4Sightseeing and amusement:Facilitiesfor recreation ・ representative facilities <strong>of</strong> <strong>the</strong>The field inspection was conducted <strong>by</strong> <strong>the</strong> 10 examinees, who <strong>the</strong>n filled out <strong>the</strong> questionnaire. Thefollowing are <strong>the</strong> procedures: Date <strong>of</strong> administration: December 6, 2000. Place <strong>of</strong> administration: Eacharea in Otaru City. Examinees: The same as in <strong>the</strong> first and second questionnaires. Reference materials:Field inspection. In addition, materials from <strong>the</strong> second questionnaire (<strong>the</strong> written information and <strong>the</strong>map) were provided to <strong>the</strong> examinees.4.ANALYSIS AND COMPARISON OF THE RESULTS4.1 Comparison <strong>of</strong> <strong>the</strong> total weightsThe comparison <strong>of</strong> <strong>the</strong> total weights <strong>of</strong> eachquestionnaire is shown in fig.2. The rankings for <strong>the</strong>second and third questionnaires are <strong>the</strong> same. However,<strong>the</strong> rankings in <strong>the</strong> first and third questionnaires aredifferent.4.2Correlation coefficient <strong>of</strong> every examineeThe correlation coefficients <strong>of</strong> total weights <strong>of</strong> eachexaminee are shown in fig.3. The following facts wereproven from fig.3. 1 <strong>the</strong> correlation coefficients <strong>of</strong><strong>the</strong> first and third questionnaires had maximum andminimum values <strong>of</strong> 0.990 and 0.510, respectively; 2<strong>the</strong> correlation coefficients <strong>of</strong> <strong>the</strong> second and thirdquestionnaires had maximum and minimum values <strong>of</strong>0.995 and 0.750, respectively;3 for nine <strong>of</strong> <strong>the</strong> 10examinees, <strong>the</strong> second correlation coefficient is higherthan <strong>the</strong> first.It was demonstrated that even when an examinee doesnot know <strong>the</strong> evaluation object very well,questionnaire results based on written and visualinformation are close to those based on <strong>the</strong> fieldinspection.5.CONCLUSION10.50OTARU stationareaSUSHIYADOURIareaSAKAIMACHI OTARU-UNGACHIKKOU areaDOURIarea areafirst 0.259 0.334 0.265 0.271 0.778second 0.261 0.364 0.436 0.420 0.890third 0.251 0.334 0.429 0.388 0.955Fig.2 The comparison <strong>of</strong> <strong>the</strong> total weights1.110.90.80.70.60.50.41 2 3 4 5 6 7 8 9 101tim es and third 0.644 0.897 0.743 0.733 0.990 0.955 0.973 0.543 0.963 0.5102tim es and third 0.844 0.936 0.750 0.838 0.993 0.951 0.995 0.767 0.967 0.995Fig. 3 The correlation coefficients <strong>of</strong> each examinee.The main results <strong>of</strong> this study are: 1 An evaluation based on visual information, such as photographsand maps, closely approximates an evaluation when <strong>the</strong> object is well known; 2 If sufficientinformation is provided, <strong>the</strong> evaluation results are almost consistent, whe<strong>the</strong>r or not <strong>the</strong> examinee hasknowledge <strong>of</strong> <strong>the</strong> object; 3 High reliability can be achieved even when only a moderate amount <strong>of</strong>information is provided.When utilizing <strong>the</strong> results <strong>of</strong> this study, one should pay careful attention to <strong>the</strong> choice <strong>of</strong> photographpresented as visual information. For example, it is normal for <strong>the</strong> evaluation results to change if <strong>the</strong>re is adifference between <strong>the</strong> object's appearance in <strong>the</strong> photograph and <strong>the</strong> actual object seen during <strong>the</strong> fieldvisit. Therefore, it is best if people who know <strong>the</strong> field site well examine and select <strong>the</strong> photograph.Proceedings – 6 th ISAHP 2001 Berne, Switzerland 300