Custom Farm Machinery Rates Report - University of Georgia
Custom Farm Machinery Rates Report - University of Georgia
Custom Farm Machinery Rates Report - University of Georgia
You also want an ePaper? Increase the reach of your titles
YUMPU automatically turns print PDFs into web optimized ePapers that Google loves.
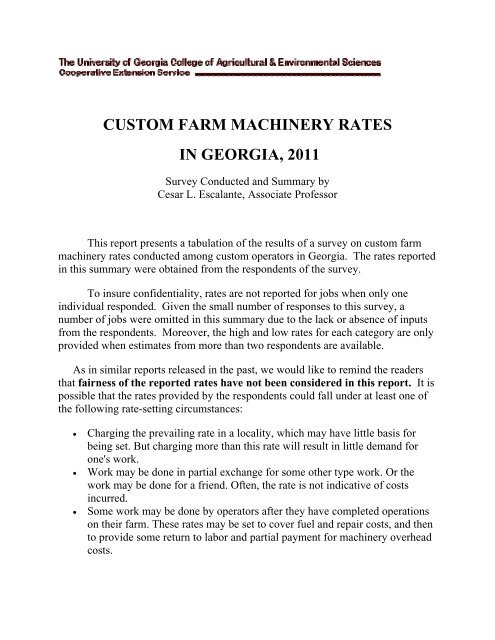
CUSTOM FARM MACHINERY RATESIN GEORGIA, 2011Survey Conducted and Summary byCesar L. Escalante, Associate Pr<strong>of</strong>essorThis report presents a tabulation <strong>of</strong> the results <strong>of</strong> a survey on custom farmmachinery rates conducted among custom operators in <strong>Georgia</strong>. The rates reportedin this summary were obtained from the respondents <strong>of</strong> the survey.To insure confidentiality, rates are not reported for jobs when only oneindividual responded. Given the small number <strong>of</strong> responses to this survey, anumber <strong>of</strong> jobs were omitted in this summary due to the lack or absence <strong>of</strong> inputsfrom the respondents. Moreover, the high and low rates for each category are onlyprovided when estimates from more than two respondents are available.As in similar reports released in the past, we would like to remind the readersthat fairness <strong>of</strong> the reported rates have not been considered in this report. It ispossible that the rates provided by the respondents could fall under at least one <strong>of</strong>the following rate-setting circumstances:• Charging the prevailing rate in a locality, which may have little basis forbeing set. But charging more than this rate will result in little demand forone's work.• Work may be done in partial exchange for some other type work. Or thework may be done for a friend. Often, the rate is not indicative <strong>of</strong> costsincurred.• Some work may be done by operators after they have completed operationson their farm. These rates may be set to cover fuel and repair costs, and thento provide some return to labor and partial payment for machinery overheadcosts.
We also would like to warn the readers that since an interview with therespondents was not possible, we could not determine how different individualsmight have interpreted the questions. In view <strong>of</strong> this concern and the fact that thissurvey has generated only a small sample <strong>of</strong> responses, the rates are reportedstatewide rather than by districts, or by counties.The following tables provide a summary <strong>of</strong> rates provided by the respondentsfor specific activities in different categories <strong>of</strong> farm operations:TILLAGE OPERATIONSOperation Unit High($)Low($)Average($)Moldboard plowing Acre 15.00 12.00 13.50Hour 50.00Chisel plowing Acre 15.00 10.00 12.50Hour 85.00 50.00 67.50Disking Acre 15.00 8.00 10.33Hour 85.00 50.00 67.50V-ripping Acre 15.00Hour 50.00Spike tooth harrowing Acre 10.00Hour 50.00Row cultivating Acre 10.00 8.00 9.00Hour 50.00Field cultivating Acre 15.00Hour 50.00Rotary hoeing Acre 7.50Hour 50.00Subsoil Acre 15.00 12.00 13.50Hour 85.00 50.00 67.50Subsoil and Bed Acre 20.00
PLANTING OPERATIONSOperation Unit High($)Low($)Average($)Planting corn Acre 15.00Planting soybeans Acre 15.00Planting cotton Acre 15.00Planting wheat Acre 12.50Drilling small grain Acre 12.50No-till drilling Acre 40.00 15.00 25.00Hour 55.00Strip-till, planting Acre 20.00Sprig Bermuda, including sprigs Acre 300.00 70.00 143.75Sprig Bermuda, not including sprigs Acre 50.00Seeding alfalfa, clover, etc. Acre 15.00Planting pine trees Acre 50.00CHEMICAL APPLICATION(excluding materials)Operation Unit High($)Low($)Average($)Spraying weeds and pasture Acre 30.00 5.00 12.43Hour 50.00Spraying crops with insecticide Acre 12.00 8.00 10.00Spraying crops with herbicide Acre 12.00 8.00 10.00Spraying cattle Head 1.00 0.70 0.85Spraying pecan trees Tree 1.00Spreading fertilizersBulk dry Acre 8.00Ton 100.00 32.50 66.25Liquid Acre 11.00 6.50 8.50Lime Acre 8.00Ton 20.00 18.00 19.33Side Dressing Acre 8.00 6.50 7.25Anhydrous Ammonia Acre 10.00Manure application, dry Acre 10.00Manure application, liquid Acre 10.00
HARVESTING OPERATIONSOperation Unit High($)Low($)Average($)Corn picking Acre 40.00Combining, hauling not includedCorn, dry land Acre 45.00 38.00 41.00Corn, irrigated Acre 40.00 38.00 39.00Soybeans Acre 45.00 38.00 41.00Wheat Acre 45.00 38.00 41.00Combining, hauling included, soybeans Acre 60.00 35.00 47.50Peanut harvestingDigging Acre 15.00Combining Acre 50.00Digging and combining Acre 65.00Digging, combining, and hauling Acre 90.00Cotton harvestingPicking cotton, hauling not included Acre 75.00 65.00 70.00Picking cotton per pound Pound 0.10Minimum charge Acre 75.00Build module Pound 0.10SILAGE AND HAY MAKINGOperation Unit High($)Low($)Average($)Mowing hay Acre 100.00 6.00 28.14Raking hay Acre 100.00 5.00 21.88Mowing and conditioning hay Acre 30.00 14.00 22.00Pickup baling (conventionalbales), twine Bale 9.00 1.00 3.92Baling with loader or wagon Bale 2.50 0.50 1.50Hauling bales to barn andstoring Bale 0.40Baling giant round bales Bale 15.00 10.00 12.80Mow, bale, haul and storeRegular bales Bale 20.00 9.00 15.50Giant round bales Bale 18.00
HAULING, MACHINERY RENTAL RATES AND OTHEROPERATIONSOperation Unit High($)Low($)Average($)Hauling Crops and LivestockGrains and oilseeds Bushel 0.60 0.18 0.39Grains and soybeans Loaded mile 6.00 3.15 4.58Livestock Loaded mile 3.00 1.25 2.38Hay – round bale, less than 10 miles Loaded mile 5.00 3.00 4.00Hay – square bale, mileage not defined Bale 0.50<strong>Machinery</strong> Rental <strong>Rates</strong>No-till grain drill Hour 100.00 50.00 75.00No-till drill Acre 11.50Mower conditioner Acre 14.00Miscellaneous TasksMowing set aside acres Hour 195.00Bulldozing, D6 or smaller Hour 110.00 50.00 80.00Bulldozing, D7 or larger Hour 225.00 125.00 175.00Bush hogging pastures Acre 120.00 10.00 63.75Post hole digging 85.00Sawing wood, chain saw 25.00
A comparison <strong>of</strong> the previously reported 2008 rates and the new ratescollected in 2011 indicates that the overall change in rates over the 3-year period is20.34%. This growth rate was derived by considering only those rates forjobs/tasks provided by more than 2 respondents in the current survey. Thisoverall growth rate is below the comparative overall growth rate <strong>of</strong> 46.78%calculated for the 2005 and 2008 surveys. The current growth rate, however, ishigher than the other three-year period comparisons. Specifically, the custom ratesobtained in 2005 were only 7.49% higher than the 2002 rates, which, in turn, wereabout 15% higher than the 2000 rates.In the current survey, the different categories <strong>of</strong> custom operations posteddifferent growth trends in the overall growth rates in their respective categories.Silage and hay making operations registered the largest collective average increase<strong>of</strong> 160.39%, followed by hauling/machinery rental/miscellaneous operations at20.31%, planting operations at 13.19%, and harvesting operations at 2.66%.Chemical and tillage operations, however, registered overall reductions in averagerates at -22.71% and -34.14%, respectively.Caution, however, should be observed in the use <strong>of</strong> such information, giventhe following considerations:a) The 2011 sample size, from which these rates were calculated, isrelatively smaller than the samples (responses obtained) used in the2002 and 2005 surveys.b) There is also no way to ascertain whether those that responded in the2011 survey are the same people that provided the rates in the 2008survey as identifiers were not used or encouraged to be used in theresponses received.
Prepared by: Cesar L. Escalante, Associate Pr<strong>of</strong>essorThe <strong>University</strong> <strong>of</strong> <strong>Georgia</strong> College and Agricultural & Environmental Sciences and Ft. ValleyState <strong>University</strong>, and the U.S. Department <strong>of</strong> Agriculture and counties <strong>of</strong> the state cooperating.The Cooperative Extension Service <strong>of</strong>fers educational programs, assistance and materials to allpeople without regard to race, color, national origin, age, sex or disability.An equal opportunity/affirmative action organization committed to a diverse work force.AGECON-11-003August 2011Issued in furtherance <strong>of</strong> Cooperative Extension, Acts <strong>of</strong> May 8 and June 30, 1914, the <strong>University</strong><strong>of</strong> <strong>Georgia</strong>, College <strong>of</strong> Agricultural and Environmental Sciences and Fort Valley State<strong>University</strong>, and the U.S. Department <strong>of</strong> Agriculture Cooperating.Dr. Scott Angle, Dean & DirectorCollege <strong>of</strong> Agricultural & Environmental SciencesTo find out more visit our web page at:http://www.ces.uga.edu/Agriculture/agecon/agecon.html


