2013 Attainment Report - Maryland Department of Transportation ...
2013 Attainment Report - Maryland Department of Transportation ...
2013 Attainment Report - Maryland Department of Transportation ...
- No tags were found...

Create successful ePaper yourself
Turn your PDF publications into a flip-book with our unique Google optimized e-Paper software.
iiTable <strong>of</strong> ContentsMessage from the Secretary <strong>of</strong> <strong>Transportation</strong>_______________ iSummary _______________________________________________ iiiIntroduction & Overview __________________________________ 1Quality <strong>of</strong> Service________________________________________ 13Safety & Security________________________________________ 19System Preservation & Performance_______________________ 25Environmental Stewardship_______________________________ 35Connectivity for Daily Life________________________________ 43Glossary________________________________________________ 51List <strong>of</strong> Performance Measures_____________________________ 52
SummaryBelow are some <strong>of</strong> the performance results over the past year contained in this <strong>2013</strong> <strong>Report</strong>.Goal–Quality <strong>of</strong> Service• Total maintenance expenditures increased back to pre-fiscal year(FY) 2010 levels, allowing SHA to address maintenance that wasdeferred in previous years and to place emphasis on maintenancethat helps to improve water quality consistent with Chesapeake Bayrestoration goals.• On time performance <strong>of</strong> MTA services in FY2012 improved or remainedon-par with FY2011 performance except local bus and light railwhich both decreased by 2%. MTA has invested in Automatic VehicleLocation Systems (AVL) to obtain a more accurate picture <strong>of</strong> local busperformance and to better inform route planning.• Average truck turn-around time at Seagirt Marine Terminal decreased to30 minutes, its lowest time for a pick-up or drop-<strong>of</strong>f since performancetracking started in 2001.• Customer visit time at MVA branch <strong>of</strong>fices decreased for the fifth yearin a row to 27 minutes and customers rating service as “good” or “verygood” at MVA branch <strong>of</strong>fices increased to 91%.• The MAA began construction on a major terminal enhancement projectat BWI Marshall, planned for completion in the summer <strong>of</strong> <strong>2013</strong>. Theproject includes a new security checkpoint and expanded gate andconcourse areas with new services for airport travelers.• The number <strong>of</strong> toll transactions increased by seven million and thepercent <strong>of</strong> toll transactions collected electronically increased to 71%in FY2012 due to the opening <strong>of</strong> the ICC/MD 200 from MD 97 to I-95and a public outreach campaign to encourage use <strong>of</strong> E-ZPass ® .• MDTA’s Vehicle Recovery Technicians (VRT) assisted 35,000 motoristsalong eight toll facilities.Goal–System Preservation & Performance• SHA’s traffic monitoring, traveler information, incident management andtraffic management program, known as the Coordinated Highways ActionResponse Team (CHART), saved <strong>Maryland</strong>ers approximately $1.1 billion invehicle travel costs in CY2011.• As a result <strong>of</strong> an aggressive bridge rehabilitation program, the number <strong>of</strong>SHA bridges that are structurally deficient decreased from 106 bridges inApril 2011 to 97 bridges in April 2012.• Passengers per revenue vehicle mile, a measure <strong>of</strong> MTA service productivity,increased or stayed constant across all MTA modes in FY2012, including a17% increase for local bus.• MTA operating cost per passenger trip, a measure <strong>of</strong> MTA service efficiency,increased for all modes in FY2012 due to rising fuel costs, labor costs andcontract increases, however cost growth remains in line or below historicaltrends.• Use <strong>of</strong> MVA’s Alternative Service Delivery (ASD) methods (e.g., servicesavailable on-line and through MVA Kiosks) increased five percentage pointsfrom FY2011 levels while average cost per transaction continued to steadilydecrease, remaining below MVA’s $14 per transaction target.• When cost per enplaned passenger (CPE) data is adjusted for inflation, theCPE passenger at BWI Marshall decreased slightly in FY2012 to $9.29,while the average cost for comparable nearby airports continues to increase($15.50 in 2012).• MPA doubled its net operating income in FY2012 to $18.5 million due inpart to savings from ongoing public-private partnerships and cargo tonnageand cruise ship passenger volumes that exceeded budgeted expectationsfor FY2012.Goal–Safety & Security• The CY2011 fatality rate <strong>of</strong> 0.87 fatalities per 100 million miles traveledon <strong>Maryland</strong> roadways is equivalent to nine less fatalities on <strong>Maryland</strong>roads in 2011 compared to 2010. The fatality rate in <strong>Maryland</strong> is 20%lower than the estimated CY2011 national rate <strong>of</strong> 1.09.• The number <strong>of</strong> pedestrian fatalities and injuries on all roads in <strong>Maryland</strong>is estimated to remain slightly below the 10-year annual average <strong>of</strong>105 fatalities. In 2011, the SHA established an <strong>of</strong>ficial pedestrian safetytask force, identified 24 high-crash locations across <strong>Maryland</strong> to focusadditional resources, and has adopted an <strong>of</strong>ficial Complete Streetspolicy for all SHA projects, to help address this priority issue.• Based on preliminary data for CY2012, the preventable accident rates onMTA local bus services is anticipated to decrease almost 35% comparedto CY2011. The decrease is attributed to new MTA programs to increaseoperator accountability through re-training and corrective action.• Annual safety inspections by the Federal Aviation Administration at BWIMarshall showed passage <strong>of</strong> inspection and compliance with all federalmandates, and annual safety inspections by the U.S. Coast Guard at allMPA-owned facilities at the Port <strong>of</strong> Baltimore showed compliance orexceeding compliance <strong>of</strong> all federal mandates.iii
Introduction &Overview<strong>Transportation</strong> System HighlightsTravel by Land• <strong>Maryland</strong> Transit Administration (MTA) ridership reached 153 millionin FY2012, including 40.9 million on Locally Operated Transit Systems(LOTS). In addition, <strong>Maryland</strong> ridership on the Washington MetropolitanArea Transit Authority (WMATA) system is comparable from last year, atnearly 124.5 million riders in <strong>Maryland</strong> in 2012.• In FY2012, the Coordinated Highways Action Response Team (CHART)incident management program responded to and cleared more than17,000 incidents and assisted more than 27,000 stranded motorists.• SHA completed seven major bridge and highway projects in FY2012including widening <strong>of</strong> the Baltimore-Washington Parkway (from I-695 toI-195) in Anne Arundel County, upgrades to MD 404 (Shore Highway) inCaroline County and improvements to MD 5 (Branch Avenue) in PrinceGeorge’s County. In addition, SHA completed rehabilitation projects on42 highway segments and 44 bridges in FY2012, totaling over $100million invested in the preservation <strong>of</strong> <strong>Maryland</strong>’s highway system.• The SHA and the MDTA continue to place special emphasis on improvingthe condition <strong>of</strong> bridges, a special area <strong>of</strong> primary focus for the State.Major MDTA bridges including the Chesapeake Bay Bridge (US 50),the Francis Scott Key Bridge (I-695), the Millard E. Tydings Bridge(I-95) and the Governor Harry W. Nice Bridge (US 301) are plannedto undergo major preservation and maintenance activities in theFY<strong>2013</strong>–FY2018 CTP. SHA is planning for numerous bridge projectsincluding the superstructure replacement <strong>of</strong> the MD 193 bridge overI-495, the replacements <strong>of</strong> the Middletown Rd. bridge over I-83 andthe MD 4 bridge over MD 223, as well as multiple ongoing bridgereplacements on I-695, including at MD 144 and MD 372.• Recent multimodal planning efforts have focused on implementingTransit-Oriented Development (TOD) projects at 15 designatedlocations across <strong>Maryland</strong>.• Over 12.1 million Motor Vehicle Administration (MVA) transactionswere processed in FY2012, including eMVA and walk-in transactionsat MVA’s branch <strong>of</strong>fice locations.Each year, the <strong>Maryland</strong> <strong>Department</strong> <strong>of</strong> <strong>Transportation</strong> (MDOT) provides atransparent evaluation <strong>of</strong> the performance <strong>of</strong> the <strong>Maryland</strong> transportationsystem in the form <strong>of</strong> the Annual <strong>Attainment</strong> <strong>Report</strong> on <strong>Transportation</strong> SystemPerformance. The Annual <strong>Attainment</strong> <strong>Report</strong> reviews performance trends forall modes <strong>of</strong> transportation within the state, indicating the progress towardsachieving the goals and objectives in the <strong>Maryland</strong> <strong>Transportation</strong> Plan (MTP)and through the Consolidated <strong>Transportation</strong> Program (CTP).MDOT has published the <strong>Attainment</strong> <strong>Report</strong> annually since 2002, presentingperformance results for <strong>Maryland</strong>’s multimodal transportation system,focusing on – the user’s experience, safety and security, system condition,protection <strong>of</strong> <strong>Maryland</strong>’s natural environment, balanced growth anddevelopment and support <strong>of</strong> economic growth.The <strong>2013</strong> <strong>Attainment</strong> <strong>Report</strong> provides a discussion <strong>of</strong> how MDOT and itsagencies are working together to achieve the goals <strong>of</strong> the MTP. Each chapterprovides a clear accounting <strong>of</strong> the progress that has been made, as well asfuture strategies where additional emphasis might be required for success.The five chapters, consistent with the five goals <strong>of</strong> the MTP, include:Quality <strong>of</strong> Service: Enhance users’ access to, and positive experience with, allMDOT transportation services;Safety & Security: Provide transportation assets that maximize personalsafety and security in all situations;System Preservation & Performance: Protect <strong>Maryland</strong>’s investment inits transportation system to preserve existing assets and maximize the efficientuse <strong>of</strong> resources and infrastructure;Environmental Stewardship: Develop transportation policies and initiativesthat protect the natural, community and historic resources <strong>of</strong> the State and thatencourage development in areas best able to support growth; andConnectivity for Daily Life: Support continued economic growth in thestate through strategic investments.Travel by Air• More than 22 million passengers flew through Baltimore/WashingtonInternational Thurgood Marshall Airport (BWI Marshall) to U.S. andinternational destinations in CY2011.• On average, 680 commercial flights arrive or depart from BWI Marshalleach day.• There are 18 publicly-owned airports and 18 privately-owned airports withpublic use available to <strong>Maryland</strong>ers.• The BWI Marshall Fire and Rescue <strong>Department</strong> dispatched equipment forlocal emergencies 1,306 times in FY2012.Travel by Water• Port foreign cargo tonnage increased to 37.8 million tons in CY2011,which was the third highest tonnage for the whole Port. <strong>Maryland</strong> PortAdministration’s (MPA) general cargo tonnage increased to a record high <strong>of</strong>9.3 million in FY2012.• In CY2012, 100 international cruises embarked and debarked at the MPACruise <strong>Maryland</strong> terminal.1
2<strong>Transportation</strong> Priorities, Policyand InvestmentIntegrating Multimodal <strong>Transportation</strong>MDOT is unique among state departments <strong>of</strong> transportation in that it hasdirect coordination and oversight <strong>of</strong> multiple modes <strong>of</strong> transportation in thestate. This structure allows MDOT to facilitate the strategic development<strong>of</strong> <strong>Maryland</strong>’s intermodal transportation network across the following fivetransportation agencies:• <strong>Maryland</strong> Aviation Administration (MAA) operates BWIMarshall and Martin State Airport, a general aviation/reliever airportnortheast <strong>of</strong> Baltimore;• <strong>Maryland</strong> Port Administration (MPA) promotes the Port <strong>of</strong>Baltimore as a leading hub for cargo and for cruise activity;• <strong>Maryland</strong> Transit Administration (MTA) provides local andregional public transit services on bus and rail, as well as grant fundingand technical assistance to LOTS across <strong>Maryland</strong>;• Motor Vehicle Administration (MVA) is the gateway to<strong>Maryland</strong> transportation infrastructure providing a host <strong>of</strong> services forvehicles and drivers, including registration and licensing; and• State Highway Administration (SHA) manages the State’shighway system, which includes 17,042 lane miles <strong>of</strong> roads and 2,578bridges.In addition, the MDOT Secretary serves as Chairman <strong>of</strong> the:• <strong>Maryland</strong> <strong>Transportation</strong> Authority (MDTA), which owns,operates and maintains the State’s eight toll facilities; and• Supports the Washington Metropolitan Area TransitAuthority (WMATA) which operates Metrorail and Metrobusservices that connect Washington, <strong>Maryland</strong> and Virginia.Guiding <strong>Maryland</strong>’s <strong>Transportation</strong> SystemEvery year MDOT publishes the State <strong>Report</strong> on <strong>Transportation</strong> (SRT) thatincludes the MTP, the CTP and the <strong>Attainment</strong> <strong>Report</strong>. These three documentspresent the full range <strong>of</strong> MDOT’s transportation activities, including: settinglong range goals for transportation in <strong>Maryland</strong>; prioritizing, funding, andimplementing a six-year capital program; and, tracking accomplishments andoverall performance <strong>of</strong> the transportation system.The MTP provides a 20-year vision for transportation in <strong>Maryland</strong>. Itprovides goals and objectives to guide how transportation enhances<strong>Maryland</strong>’s economy, the environment, and how it supports quality <strong>of</strong> lifefor <strong>Maryland</strong>ers. The update <strong>of</strong> the MTP is currently being developed. Overthe coming year the development process will include extensive outreach tocitizens, stakeholders groups and other State agencies to gather input on<strong>Maryland</strong>’s transportation vision and goals for the next 20 years.The CTP is the six-year capital budget outlook for all transportationprojects for MDOT’s Modal Administrations and the Authority. This year’sCTP (FY<strong>2013</strong>–FY2018) responds to the goals <strong>of</strong> the 2009 MTP, reflectsthe priorities <strong>of</strong> the O’Malley/Brown Administration, is influenced by theconcerns <strong>of</strong> the public and local governments, and addresses all Federal andState mandates related to transportation.Ensuring Strategic <strong>Transportation</strong> InvestmentsTo ensure that every dollar available for transportation in <strong>Maryland</strong> isefficiently spent, MDOT employs a strategic decision making process,using specific criteria to prioritize programs and projects underconsideration for inclusion in the CTP. This process is used to ensuretransparency and accountability, and to clarify how each major capitalproject is responsive to the goals <strong>of</strong> the MTP and is linked to local andregional Metropolitan Planning Organization (MPO) plans. The processalso ensures that MDOT supports existing project commitments, meetsall Federal and other legal mandates, and optimizes the State’s abilityto maximize Federal revenue opportunities.MDOT works together with residents, local jurisdictions and localand State elected <strong>of</strong>ficials to include projects in the CTP that addresscritical safety issues, preserve existing investments, support localand/or statewide economic development, protect the environment,enhance multimodal transportation services and improve accessibilitythroughout the state. For each major project in the CTP, there is aProject Information Form that describes the project objective, currentstatus, justification, consistency with MTP and Smart Growth goals,and funding by project phase over the six-year program cycle. Thisinformation provides <strong>Maryland</strong>ers with a transparent view <strong>of</strong> allcomponents <strong>of</strong> MDOT’s transportation investments.Promoting Sustainable <strong>Transportation</strong>MDOT recognizes the importance <strong>of</strong> <strong>Maryland</strong>’s sensitive ecologicalsystem through a proactive approach for integrating environmentalprotection, compliance, and sustainability into the policies, planning,and day-to-day operations <strong>of</strong> all the Modal Administrations and theAuthority. In addition to agency-specific environmental initiatives,MDOT coordinates with State, local and Federal partners to ensurethat transportation investments minimize negative impacts toour environment. MDOT achieves this by using the State’s GreenInfrastructure Plan and Chesapeake Bay restoration priorities as aguide for project mitigation activities, such as wetland restoration andtree planting, and for reducing the impact <strong>of</strong> existing infrastructure andservices with new storm water management technologies and energyefficient and low emissions technologies. Together these approacheshelp to reduce the impacts <strong>of</strong> our activities on human health, thenatural environment and the global climate. A selection <strong>of</strong> this year’snew and ongoing initiatives includes:• Implementation <strong>of</strong> Smart, Green & Growing initiatives, designedto create a more sustainable future for <strong>Maryland</strong>, includingadopting Smart Growth policies, improving transit and supportingcommunity revitalization.• Management <strong>of</strong> storm water run<strong>of</strong>f from multimodal transportationinfrastructure to promote healthier, cleaner habitats and reducepollution in the Chesapeake Bay.• Identification and tracking <strong>of</strong> transportation infrastructurevulnerable to the impacts <strong>of</strong> climate change and developingstrategies to address these impacts in cooperation with thedevelopment <strong>of</strong> <strong>Maryland</strong>’s Climate Action Plan.• Promotion <strong>of</strong> lower emission travel modes, technologies, andpractices, including Travel Demand Management (TDM), walking,bicycling, hybrid and electric transit and fleet vehicles, and theexpansion <strong>of</strong> alternative fueling infrastructure, including electricity,at locations such as MDOT headquarters, BWI Marshall and parkand-ridelots across the state.• Participation in the Electric Vehicle Infrastructure Council, createdthrough State legislation in 2011 to develop strategies to facilitatethe successful widespread integration <strong>of</strong> electric vehicles andelectric vehicle infrastructure into the transportation system.Introduction & Overview
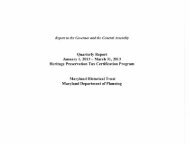
<strong>Maryland</strong>’s Investment in <strong>Transportation</strong>A primary component <strong>of</strong> developing the CTP is establishing funding levels formultimodal transportation investments across the full scope <strong>of</strong> transportationsystem development and preservation activities in <strong>Maryland</strong>. MDOT appliesfiscal resources from the <strong>Transportation</strong> Trust Fund (TTF), a dedicated accountgenerated through taxes, fees, bond proceeds and federal funds, towardsprojects and programs across all MDOT <strong>of</strong>fices and the modal agencies.This integrated fund enables the direct linkage between multimodaltransportation planning and transportation solutions, supporting priorityoperating and capital needs across the state. MDOT works with the availableand forecasted resources <strong>of</strong> the TTF, which are heavily influenced by thestate and national economic conditions, projections <strong>of</strong> State transportationrevenue and the availability <strong>of</strong> federal funding.On June 6, 2012, the President signed into law the Moving Ahead forProgress in the 21st Century (MAP-21) P.L. 112-141 - new legislation thatestablishes federal funding for highway and transit programs and setsnational, statewide and metropolitan transportation planning and policydirection for the next two years. Since MAP-21 did not increase fundinglevels, and did not address the long-term solvency <strong>of</strong> the Federal HighwayTrust Fund, MDOT expects its federal receipts (approximately $580.0 millionfor highways and $170.0 million for transit) to be used for committed capitalprogram projects and for continued system preservation.MDOT carefully manages and applies all available funds to ensure the mostefficient expenditure <strong>of</strong> dollars to serve <strong>Maryland</strong>’s transportation needs, andto support economic success in the state. For example, in the FY<strong>2013</strong>–FY2018 CTP, $921.8 million is programmed in FY<strong>2013</strong> towards systempreservation to fund maintenance <strong>of</strong> current assets, which protects andensures safe operation <strong>of</strong> <strong>Maryland</strong> transportation agencies’ investments.MDOT and its modes also track the “percentage <strong>of</strong> budgeted dollarsexpended” as a way to compare the budget with borrowing levels and toavoid unnecessary borrowing. In FY2012, for example, MDOT expended95% <strong>of</strong> its budgeted dollars, meeting its goal <strong>of</strong> 90%, and MTA spent 99%<strong>of</strong> its estimated FY2012 budget.MDOT’s capital and operating budget allocations, CTP funding levels overthe last decade, the FY<strong>2013</strong>–FY2018 CTP funding sources, capital andoperating budgets by Modal Administration and WMATA are shown in thefollowing pie charts. As MDTA is independently funded through separatesources, its capital and operating budget are shown separately.<strong>Transportation</strong>Trust Fund SourcesFY<strong>2013</strong>-FY2018 CTPIntroduction & OverviewGenerating Jobs for <strong>Maryland</strong>Demand for transportation services, including modernization andexpansion projects that enhance <strong>Maryland</strong>’s highways, publictransportation, and freight facilities, and more, continue to generatejobs for <strong>Maryland</strong> residents.As <strong>of</strong> June 2012, <strong>Maryland</strong> had designated 15 TOD sites. Theseprojects, which create livable communities that support transit, bylocating residences and business adjacent to transit stations, alsogenerate job opportunities. For example, at the White Flint TOD site,in Montgomery County, the new Pike & Rose project will transform24 acres <strong>of</strong> asphalt parking lots and an auto-oriented strip retailcommercial center into a vibrant, walkable community with housing,retail, <strong>of</strong>fice and public spaces. This development is projected togenerate 550 permanent jobs on-site and bring in $3.7 million intax revenue.Construction projects <strong>of</strong> all sizes also put <strong>Maryland</strong> residents towork, including a new $8.1 million dollar project to continue movingforward with access improvements at the Branch Avenue MetroStation in Prince George’s County. This investment puts people towork, relocating utilities required to eventually build a new four-laneaccess roadway to the Metro station.The Port <strong>of</strong> Baltimore alone generates about 14,630 direct jobs tohandle the millions <strong>of</strong> tons <strong>of</strong> waterborne cargo that comes acrossthe Port’s docks every year, while in total, 108,000 jobs in <strong>Maryland</strong>are linked to Port activities.Pursuing and winning federal grants for large-scale transportationimprovements has also produced economic benefits for <strong>Maryland</strong>residents. MDOT was awarded $40.0 million to replace Baltimore’s65-year-old Kirk Division Bus Facility with two sustainable “green”buildings. This project will put <strong>Maryland</strong>ers to work modernizing andreplacing the aging transit facility, and will house more than 350 MTAemployees when completed.Registration & MVA Fees(18%)Vehicle Titling Taxes(21%)Corporate Income Taxes (4%)Motor Fuel Taxes(19%)Operating Revenue (10%)Other (2%)Bonds (8%)Federal-aid (18%)3
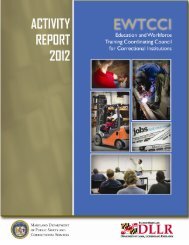
4MDOT Capital Budget (Millions)FY<strong>2013</strong>-FY2018 CTP*WMATA, $1,412.4(14%)SHA, $4,989.3 (49%)MDTA Capital Budget (Millions)FY<strong>2013</strong>-FY2018 CTPSystem Enhancement(including ICC/MD 200), $564.6 (25%)Introduction & OverviewTSO, $303.8(3%)MAA, $658.4(7%)MPA, $825.4 (8%)MVA, $109.3 (1%)System Preservation,$1,699.4 (75%)MTA, $1,827.7 (18%)* The FY<strong>2013</strong>-FY2018 CTP totals about $9.8 billion; $8.9 billion <strong>of</strong> which comesthrough the Trust Fund and $0.9 billion from “Other” fund sources.Total MDOT Capital Budget - $10.13 BillionTotal MDTA Capital Budget(Including ICC) – $2.26 BillionMDOT Operating Budget(Millions) FY<strong>2013</strong>MDTA Operating Budget(Millions) FY<strong>2013</strong>MPA, $46.7(3%)SHA, $215.1(13%)MVA, $171.1 (11%)Division <strong>of</strong> Operations, $103.1 (39.9%)WMATA, $263.9(16%)MTA, $658.5 (41%)Authority Police,$51.0 (19.7%)TSO, $79.5(5%)MAA, $176.5(11%)Total MDOT Operating Budget: $1.61 BillionAuthority PoliceBWI Marshall/Port,$23.9 (9.2%)<strong>Maryland</strong> State Police, $8.6 (3.3%)Administrative/GeneralCosts, $72.0 (27.9%)Total MDTA Operating Budget - $258.7 MillionMDOT Total Capital Program Levels (Billions)2012 Dollars ( Billions)(CPI Adjusted)$12.0$10.0$8.0$6.0$4.0$2.010.39.410.610.59.911.39.1 9.8 10.19.8$0.004-0905-1006-1107-1208-1309-1410-1511-1612-1713-18Consolidated <strong>Transportation</strong> Program
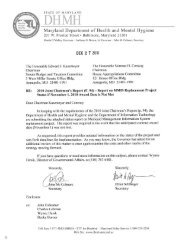
<strong>Transportation</strong> Mobility andAccessibilityAccommodating Travel DemandIn 2011, <strong>Maryland</strong>ers, visitors and freight drivers drove a total <strong>of</strong> 56.1 billionvehicle miles, approximately 100 million less miles than were travelled in2010. Total transit ridership in <strong>Maryland</strong> in FY2012 (July 2011 to June 2012)eclipsed FY2011 by over 2.3 million transit trips (a 2% increase), hitting itshighest level ever.The economic downturn has resulted in driving levels from 2008 through thepresent holding steadily below the 2007 record <strong>of</strong> nearly 57 billion vehiclemiles traveled. Over this same period, transit ridership in <strong>Maryland</strong> hascontinued to grow, from 96.7 million trips in FY2007 to over 112.1 milliontrips in FY2012. The combination <strong>of</strong> higher and more variable gas prices andMDOT programs to expand transit services and rider support programs arepartially responsible for these trends.Growing traveler and freight demand are forecast to increase the number<strong>of</strong> licensed drivers and registered vehicles in <strong>Maryland</strong> by 23% and 40%respectively by 2026. Many <strong>of</strong> these will be new users who will interact withthe MVA to obtain their licenses and permits and to register their vehicles.To manage resources effectively to accommodate this demand, the MVAnow employs Alternative Delivery Services (ADS), such as online registration.Looking forward, MDOT expects that continued population and economicgrowth in <strong>Maryland</strong> will lead to significant growth in travel demand acrossall modes over the next 30 years. <strong>Maryland</strong>’s population in 2011, accordingto the American Community Survey, was 5,828,289, representing a 1%increase from 2010. Evidence supporting the conclusion for long-termgrowth in travel demand is substantiated by projections developed by the<strong>Maryland</strong> <strong>Department</strong> <strong>of</strong> Planning, which show that by 2040, <strong>Maryland</strong>’spopulation will be over 6.8 million, an increase <strong>of</strong> 19% from 5.8 milliontoday. This population growth is attributed in part to projected stronggrowth in jobs in <strong>Maryland</strong>, by over 22% from 2010 to 2040.Where this population and employment growth occurs in <strong>Maryland</strong> willshape the types <strong>of</strong> demand on <strong>Maryland</strong>’s future transportation system,and the requirements to address that demand. The high cost <strong>of</strong> addingnew capacity means that <strong>Maryland</strong> cannot simply build more highway lanemiles or transit corridors to address vehicle miles <strong>of</strong> travel (VMT) growth,but must rather find ways to get the most out <strong>of</strong> the existing network.While this includes strategic capacity additions, SHA, MDTA, and MTA arealso finding ways to increase the effectiveness <strong>of</strong> the existing roadway andtransit network by operations strategies such as improved signal timing andcoordination, faster incident response time, improved traveler informationsystems, priority transit systems and variable pricing on toll facilities, amongothers. Addressing travel demand also means encouraging land use anddevelopment design in a manner that supports transit use, walking, andbicycling and providing options for travelers as an alternative to driving. Abalanced multimodal approach and thoughtful land use can provide forwardthinking solutions to growing demand.Annual Number <strong>of</strong> VehicleMiles Traveled58.0Number <strong>of</strong> Vehicle MilesTraveled ( Billions)57.056.055.054.053.052.051.050.053.854.755.156.656.656.856.155.656.256.156.1Introduction & Overview49.020022003* 2012 data is estimated.200420052006200720082009Calendar Year201020112012*Governor O’Malley and Lieutenant Governor Brown announcingthe opening <strong>of</strong> the Intercounty Connector (MD 200)5
6Introduction & OverviewMVA Transactions (Thousands)2005 2006 2007 2008 2009 2010 2011 2012Registered Vehicles 4,604 4,690 4,752 4,774 4,736 4,816 4,809 4,822Driver’s Licenses Issued 3,846 3,895 3,937 3,995 4,049 4,082 4,083 4,102Motorcycle Licenses 221 230 237 244 252 257 217 224Commercial Driver’s Licenses 153 160 164 167 168 170 173 177MVA Transactions Per Year 11,991 12,562 12,542 12,388 12,263 11,011 11,917 12,139Induced TravelWhen transportation conditions are improved to help accommodategrowing travel demand and reduce congestion, one result that can occuris an additional increase in trips or travel distance – known as inducedtravel. While induced travel can be an indication <strong>of</strong> economic growth andincrease in new travel options, it also may lead to increased air pollution,energy consumption and noise. It also means that the expected benefits<strong>of</strong> capacity improvements, as measured by congestion relief and traveltime savings, may not be sustainable. Because <strong>of</strong> these potential negativeimpacts, MDOT and its partners are proactively managing induced travelthrough a number <strong>of</strong> approaches.For example, MDOT works with other State and local partners to promoteSmart Growth policies aimed at focusing growth in existing developed areas,or in targeted new growth areas (such as TOD). This approach managesinduced travel by helping to build communities that are naturally moresupportive <strong>of</strong> residents and employees completing trips using alternativemodes. MDOT is an active partner with other State and local agencies inTOD, including ongoing construction at the Twinbrook TOD in MontgomeryCounty (Phase II), Reisterstown Plaza TOD in Baltimore City and Owings MillsTown Center TOD in Baltimore County; completion <strong>of</strong> a TOD Master Plan forAberdeen in Harford County; and continuing coordination with developmentteams who have initiated design work and the permitting process acrossmultiple other sites in <strong>Maryland</strong>.
Balancing the Multimodal ApproachEffective management <strong>of</strong> <strong>Maryland</strong>’s transportation system requires abalanced multimodal and multidisciplinary approach to expand mobilityand improve transportation safety for all <strong>Maryland</strong>ers. MDOT promotes thecollaboration <strong>of</strong> pr<strong>of</strong>essionals across many disciplines and reaches out to<strong>Maryland</strong>ers from all areas <strong>of</strong> the state to identify the greatest transportationchallenges and develop cost effective solutions to address them.MDOT continues to direct funding to programs that encourage walkingand bicycling and includes accommodation for pedestrians and bicyclists inroadway and transit projects whenever possible. While non-motorized travelcurrently accounts for a small fraction <strong>of</strong> total trips, that amount is growingand is an important component <strong>of</strong> the transportation system. Well-designedand safe pedestrian and bicycle facilities are relatively inexpensive, haveminimal environmental impact and support public health. The $151.0 millionprogrammed for bicycle and pedestrian projects in the FY<strong>2013</strong>–FY2018CTP and the introduction <strong>of</strong> the new <strong>Maryland</strong> Bikeshare and Bikewaysprograms highlight <strong>Maryland</strong>’s ongoing commitment to improving bicycleand pedestrian mobility.MDOT, through its support <strong>of</strong> multiple transit modes, helps expand mobilityfor all <strong>Maryland</strong>ers. The MTA operates Local and Commuter Buses, LightRail, Baltimore Metro Subway, MARC Train Service and a comprehensiveParatransit (Mobility) system. MTA also manages the Taxi Access system, anddirects funding and statewide assistance to LOTS in each <strong>of</strong> <strong>Maryland</strong>’s 23counties, Baltimore City, Annapolis and Ocean City, providing approximately$69.6 million in Federal and State grants in 2012. Through a regionalcompact, MDOT also supports WMATA, which provides transit service for<strong>Maryland</strong>ers living and working in the Washington, DC region.MDOT applies a balanced, multimodal approach to the multiyearimplementation <strong>of</strong> the State’s Base Realignment and Closure (BRAC)Action Plan. In FY2012, approximately $20 million was expended and inFY<strong>2013</strong>, approximately $98 million is expected to be spent on directlyrelatedBRAC projects. Elements programmed in the FY<strong>2013</strong>–FY2018 CTPthat specifically address BRAC activities include intersection improvements,transit improvements, park-and-ride lot expansions, operations andmaintenance efforts and system preservation projects. Under the BRACIntersection Improvement Program, SHA analyzed projected near-term trafficimpacts at 117 heavily impacted intersections and identified 19 intersectionsfor improvement. MDOT and MTA are also collaborating with the U.S.<strong>Department</strong> <strong>of</strong> Defense and local <strong>of</strong>ficials to advance and expand successfulTDM programs to support the growth <strong>of</strong> military installations due to BRAC.MDOT’s BRAC strategy works in concert with its commitment to TOD and SmartGrowth. For example, the City <strong>of</strong> Aberdeen’s TOD Master Plan, developedwith the assistance <strong>of</strong> MDOT, MTA and SHA, provides the opportunity toleverage the value <strong>of</strong> the land and redevelopment opportunities around theMARC/Amtrak station to address growth and change as a result <strong>of</strong> BRACactivities relocating to Aberdeen Proving Grounds.Introduction & Overview7
Transit Ridership–MTA Direct-Operated Services (Thousands)8Local BusLight Rail75,00050,00025,000030,00015,000066,73620037,387200363,79320045,818200463,24120054,875200563,52620065,401200664,27220077,122200766,68420087,963200869,84620098,712200969,31520108,158201072,52020118,655201173,57920128,5402012Introduction & OverviewBaltimoreMetro30,00015,000013,196 12,426 12,863 12,919 13,226 13,955 13,567 13,3642003 2004 2005 2006 2007 2008 2009 2010Transit Ridership–Contracted Services and LOTS (Thousands)MARCContractedCommuterBus10,0005,000010,0005,00006,33620032,56320036,72720042,70420046,88420052,95420057,27520063,1932006Fiscal Year7,50520073,36620077,89820083,71620088,08120093,97220098,09620103,859201014,58820118,23320114,0972011*15,36420128,45220124,2902012MobilityParatransit& Taxi Access10,0005,000056420035422004720200596520061,24020071,38520081,45020091,48520101,66020111,9002012Lots60,00030,00034,10834,74537,75240,69442,06642,11845,635**45,700**40,243**40,908**020032004200520062007 2008Fiscal Year2009201020112012WMATA–<strong>Maryland</strong>-Only Transit Ridership*** (Rail, Bus, MetroAccess)(Thousands)WMATA160,000120,00080,00040,0000110,384 112,220 115,1392003 2004 2005* 2011 data was revised from the 2012 <strong>Report</strong>.** Data is estimated.120,5342006121,6882007125,9392008Fiscal Year128,655*** <strong>Maryland</strong>-only WMATA Ridership is an estimate: <strong>Maryland</strong> Metrorail ridership is calculated based on the 2007 rail passenger survey; <strong>Maryland</strong> Metrobus ridership is derivedfrom ridership counts by line as <strong>of</strong> September, 2011; and <strong>Maryland</strong> MetroAccess ridership is from fiscal year 2011 actual ridership counts.2009123,5882010123,1772011124,4512012
Providing Commuting ChoicesCommuters consider many criteria when choosing their travel mode to work,time and cost being the major factors. In 2011, based on data from the U.S.Census Bureau’s American Community Survey, <strong>Maryland</strong>ers experienced anaverage commute time <strong>of</strong> 32.2 minutes, representing the longest averagecommute to work time in the nation. Many <strong>Maryland</strong>ers continue tocommute by driving alone due to personal needs, business requirements,or lack <strong>of</strong> other convenient travel options. In 2011, 73.3% <strong>of</strong> <strong>Maryland</strong>commuters drove alone. This share is well below the national average andplaces <strong>Maryland</strong> in the top 10 states with the lowest average drive alone towork mode share.<strong>Maryland</strong> commuters shift commute preferences towards options other thandriving alone as new opportunities are made available and as the cost <strong>of</strong>commuting by vehicle continues to be highly variable. MDOT works withMPOs, local governments, and other private and not-for-pr<strong>of</strong>it partners todeploy a variety <strong>of</strong> TDM strategies that support alternatives to driving alonesuch as traveler information, ridesharing, teleworking and variable pricinginfrastructure programs. These activities are paying dividends – in 2011,<strong>Maryland</strong> commuters chose transit more frequently than commuters in anyother state, with an average 9.2% transit commute to work share.As part <strong>of</strong> Governor O’Malley’s Cycle <strong>Maryland</strong> initiative, in FY2012, MDOTkicked <strong>of</strong>f the <strong>Maryland</strong> Bikeways Program and <strong>Maryland</strong> Bikeshare Program.The Bikeways Program supports planning, design and construction <strong>of</strong> projectsthat create and improve bicycle connections in <strong>Maryland</strong> to key destinationslike work, school and shopping. The Bikeshare Program provides grants tohelp <strong>Maryland</strong> communities plan, establish or expand Bikeshare programs.Grants from these two programs in FY2012 totaled over $7.8 million,providing funding for over 50 Bikeways and Bikeshare grant recipients.MDOT is supporting planning and engineering on high-priority transit projectsincluding the Red Line in Baltimore, and the Purple Line in Montgomery andPrince George’s Counties, and implementation <strong>of</strong> the MARC Growth andInvestment Plan. MDOT continues to work with State, local, and privatepartners to support TOD planning and joint-development projects across 15designated TOD sites in the Baltimore and Washington D.C. regions.Introduction & Overview9
10Mode Split for <strong>Maryland</strong> CommutersCommute Mode Share (American Communities Survey, U.S. Census)80.0%78.0%76.0%74.0%72.0%70.0%68.0%66.0%18.0%16.0%14.0%12.0%10.0%8.0%6.0%4.0%2.0%0.0%DriveAloneDrive AloneCarpoolTransitWork at HomeWalkOtherBicycle2003 2004 2005 2006 2007 2008 2009 2010 201175.2% 74.3% 73.6% 72.8% 74.3% 73.2% 73.4% 73.0% 73.3%Carpool 10.5% 10.3% 10.9% 10.7% 10.2% 10.8% 10.0% 10.7% 10.1%Transit 8.1% 8.3% 8.5% 8.8% 8.4% 8.5% 8.8% 8.6% 9.2%Work atHome3.1% 3.6% 3.7% 3.6% 3.6% 3.8% 4.1% 4.3% 4.1%Walk 2.0% 2.1% 2.1% 2.6% 2.6% 2.3% 2.6% 2.3% 2.3%Other 0.9% 1.2% 1.1% 1.1% 0.7% 1.0% 0.7% 0.7% 0.9%Bicycle 0.2% 0.1% 0.2% 0.3% 0.2% 0.3% 0.4% 0.2% 0.3%Key Activities & Accomplishments2001 Frederick MARC Extension,to Commuter Choice <strong>Maryland</strong>,2005 Bicycle & Pedestrian AccessMaster Plan2006 MTA Light Rail Doubletrack2007 MARC Growth & Investment Plan,SHA Bike & Pedestrian DesignGuidelines2008 Southern <strong>Maryland</strong> CommuterBus Initiative, BRAC Action Plan2009 ARRA - LOTS, MTA, & WMATAProjects, Ongoing Park-and-RideLot Expansion2010 Guaranteed Ride Home Expansion,<strong>Maryland</strong> TOD Designation, MTACharm Card2011 ICC Commuter Bus, MARCPenn Line Service, MARC Rail Carand Locomotive Replacement2012 <strong>Maryland</strong> Bikeways and BikeshareprogramsIntroduction & Overview
Air Travel in <strong>Maryland</strong>Since its opening in 1950, BWI Marshall has provided <strong>Maryland</strong>ers access tolocations throughout the U.S. as well as the rest <strong>of</strong> the world. The MAA, theoperator <strong>of</strong> BWI Marshall, works hard to create and maintain its “easy-come,easy-go” reputation. On an average day, airlines serving BWI Marshallprovide <strong>Maryland</strong>ers with access to 67 domestic non-stop destinationsand nine international non-stop destinations. In 2012, several new airlinesstarted or announced new air service for BWI Marshall, including CondorAirlines to Frankfurt, Germany, and Spirit Airlines to Dallas/Fort Worth andFort Lauderdale.BWI Marshall served more than 22 million passengers in 2011, a growth rate<strong>of</strong> more than 2% from 2010, ranking it the 22nd busiest airport in the UnitedStates. In 2012, BWI Marshall is on track to break its annual passengerrecord, after setting an all-time monthly record for passengers in July. July2012 was the busiest month in the history <strong>of</strong> BWI Marshall, and 2011 wasthe busiest year.BWI Marshall supports the <strong>Maryland</strong> economy through passenger andfreight services – moving more than 22 million people and 118,788 tons in2011. Based on 2010 data, BWI Marshall’s economic impacts for <strong>Maryland</strong>include nearly 94,000 jobs, $3.6 billion in personal income, $5.6 billion inbusiness revenue, and over $2.0 billion in local purchases.Across <strong>Maryland</strong>, the MAA fosters the vitality <strong>of</strong> aviation and promotessafe and efficient operations, opportunities for economic growth andenvironmental stewardship. MAA owns and operates Martin State Airport,a general aviation reliever facility and a support facility for the <strong>Maryland</strong>Air National Guard and <strong>Maryland</strong> State Police. The MAA also develops andregulates aviation activities at the 36 public airports throughout the state,which are supported by State funds totaling approximately $34.8 millionsince 2002 (excluding federal funds and local airport funds).Total Annual Commercial Passengers atBWI Marshall AirportTotal Passengers ( Millions)24.022.020.018.016.019.7200320.32004* 2012 data is estimated19.7200520.7200621.0200720.5200821.0200921.92010Calendar Year22.4201122.82012*Introduction & OverviewWaterborne Travel in <strong>Maryland</strong>For more than 300 years, the Port <strong>of</strong> Baltimore has been a vital economicactivity center in <strong>Maryland</strong>. The Port continues to generate revenue throughtraditional streams including passenger cruises and cargo movement, andthrough recent innovations, such as the Seagirt Marine Terminal Public –Private Partnership (P3) with Ports America. This P3 will save the State <strong>of</strong><strong>Maryland</strong> hundreds <strong>of</strong> millions <strong>of</strong> dollars it otherwise would have had toinvest in capital improvements and other necessary infrastructure at Seagirt.The Port <strong>of</strong> Baltimore’s contributions to the economy <strong>of</strong> <strong>Maryland</strong>, the Mid-Atlantic, and nation, are significant. A 2011 study found that approximately40,040 jobs in <strong>Maryland</strong> are generated by Port activity; <strong>of</strong> those, 14,630 aredirect jobs. There are another 25,410 induced and indirect jobs generatedby Port activity. There are over 68,000 jobs related, but not completelydependent on Port activity; they are with companies that chose to importor export cargo through the Port, but have other options if the Port was notavailable to them. In total, there are over 108,000 jobs linked to the Port. ThePort is responsible for $3.0 billion in annual personal wages and salary, and$304.0 million in state and local tax revenues.The Port <strong>of</strong> Baltimore has competitive advantage over other east coastports – it is the closest port to Chicago and other Midwest markets; hasdirect access to both CSX and Norfolk Southern rail corridors and the I-95,I-81, and I-70 interstate corridors; and now includes one <strong>of</strong> only two 50-foot deep berths on the east coast at the Seagirt Marine Terminal, allowingit to accommodate Post-Panamax container ships once the Panama Canalexpansion is complete in 2015.In 2011, the Port <strong>of</strong> Baltimore saw a 15% increase in cargo from 2010,which marked the greatest increase <strong>of</strong> growth by any major U.S. port. ThePort’s public and private marine terminals saw 37.8 million tons <strong>of</strong> foreigncargo cross their docks in 2011, up from 32.8 million tons in 2010. The totaldollar value amount <strong>of</strong> that cargo was more than $51.4 billion, the Port’shighest dollar value ever and a 24% increase from 2010. Other records thePort established in 2011 include exporting 24 million tons <strong>of</strong> cargo, including19.2 million tons <strong>of</strong> coal. The Port also shipped 551,000 auto units (highestin the U.S.).More record-breaking performance continued in 2011, as 251,889 peoplesailed on 105 cruises from Baltimore, both <strong>of</strong> which are all-time records forthe Port. Baltimore is ranked fifth among East Coast ports and 11th in the U.S.for most cruise passengers. Cruising from the Port <strong>of</strong> Baltimore contributesan estimated $90.0 million to <strong>Maryland</strong>’s economy, and approximately 220direct jobs in <strong>Maryland</strong> are generated by cruise activity.11
12Improving the Movement <strong>of</strong> Goods—<strong>Maryland</strong> Freight ActivityMDOT is aggressively working to implement multimodal freight solutions, improvefreight logistics and expand multimodal transportation options throughoutthe state. Chokepoints and aging transportation infrastructure impede goodsmovement within <strong>Maryland</strong> and along the entire eastern seaboard. With freightactivity projected to double by 2030, the multimodal transportation system willcome under increasing pressure. The 2009 <strong>Maryland</strong> Statewide Freight Planoutlines policies and investments critical to addressing current and projectedgoods movement challenges. MDOT and its modes/authority are committed toimplementing key elements <strong>of</strong> this plan. Within the <strong>Attainment</strong> <strong>Report</strong>, there areseven measures that are related directly to the State’s freight goals established inthe Plan that address the quality and efficiency <strong>of</strong> freight movement in <strong>Maryland</strong>.Performance MeasuresMTP GOAL 2012 AR Freight Related Measures PageQuality <strong>of</strong>ServiceSafety &SecuritySystemPreservation &PerformanceConnectivityfor Daily Life(MPA)–Average truck turn-around timeat Seagirt Marine Terminal(SHA)–Percentage <strong>of</strong> the <strong>Maryland</strong>SHA network in overall preferredmaintenance condition(MVA/SHA/MDTA)–Annual number <strong>of</strong>traffic fatalities and personal injuries onall roads in <strong>Maryland</strong>(SHA & MDTA)–Number <strong>of</strong> bridges andpercent that are structurally deficient(SHA & MDTA)–Percent <strong>of</strong> roadwaymiles with acceptable ride quality(MPA)–Port <strong>of</strong> Baltimore foreign cargoand MPA general cargo tonnage(SHA & MDTA)–Percent <strong>of</strong> freeway lanemilesand arterial lane-miles with averageannual volumes at or above congested levelsOriginating and Terminating Freightin <strong>Maryland</strong>*METHOD FORMOVING FREIGHTTOTAL VALUE(Millions)Air** $3,206 118,788Other*** $47,933 12,826Rail $6,923 24,139Truck $259,822 305,148Water17142026264944TOTAL TONNAGE(Thousands)$51,391**** foreign: 37,844*****domestic: 13,500******All Freight $369,275 512,245* Source: U.S. <strong>Department</strong> <strong>of</strong> <strong>Transportation</strong> Freight Analysis Framework (FAF3)Version 3. Other, Rail, and Truck value and tonnage data is estimated based on FAF3data. The data is adjusted yearly to account for previous year actual data and a 2%annual growth rate consistent with the Federal Highway Administration’s FreightSummary 2008. The 2% growth rate reflects a conservative estimate <strong>of</strong> domestic andinternational freight growth given current economic conditions.** Source: BWI Marshall report to Airports Council International (2011).*** Freight consists largely <strong>of</strong> postal and courier shipments weighing less than100 pounds and other intermodal combinations.**** Value <strong>of</strong> international cargo only.***** Source is MPA-compiled data for 2011.****** Source: MPA and U.S. Army Corps <strong>of</strong> Engineers (2010).Collaboration with Freight Public and Private PartnersMDOT is leading efforts to improve the efficiency and effectiveness <strong>of</strong>freight movement throughout the state. For example, MPA’s privatepartner’s installed four supersized cranes at Seagirt Marine Terminal,ensuring that the Port <strong>of</strong> Baltimore can service the Post Panamaxcontainer ships <strong>of</strong> the future. Due to <strong>Maryland</strong>’s prominent locationat the crossroads <strong>of</strong> several major freight corridors, eliminatingfreight transportation bottlenecks in <strong>Maryland</strong> can provide significanttransportation and economic benefits to the Mid-Atlantic region.Through partnerships with neighboring states, freight stakeholders, andnonpr<strong>of</strong>its, and through leadership in groups such as the I-95 CorridorCoalition, MDOT is participating in the development <strong>of</strong> multistatesolutions to these issues. Additionally, MDOT recognizes the sharedinfrastructure nature <strong>of</strong> passenger and freight operations. MDOT remainsdiligent in its coordination <strong>of</strong> passenger and freight efforts for all modes.Key Freight Initiatives Improving <strong>Maryland</strong>’sEconomic CompetitivenessMDOT is actively working with CSX to plan and develop a new freightrail-to-truck transfer facility, the Baltimore Rail Intermodal Facility. MDOT isalso a partner in CSX’s National Gateway initiative, a partnership betweenthe Federal government, six states, the District <strong>of</strong> Columbia and the railroadto create a double-stack rail network. These projects will improve freightrail connectivity and capacity through the Mid-Atlantic region.• MDOT and MTA are undertaking a large-scale short line rail project tosustain rail movement along the Eastern Shore agricultural corridor. Thestabilization effort will support soybean and grain exports.• MDOT chairs the Freight Subcommittee on the Amtrak NortheastCorridor Commission, helping to ensure both Norfolk Southernand CSX have access to the corridor to accommodate the growth infreight rail.• <strong>Maryland</strong> will continue to implement the truck safety programs andenforcement initiatives that have produced improved truck safety.<strong>Maryland</strong> consistently ranks in the top 10 states for commercial vehicleinspections. State <strong>of</strong>ficials will continue to reach out to the truckingcommunity and the traveling public to educate about truck safety.• <strong>Maryland</strong> will continue to advance truck parking capacity expansionthroughout the state. <strong>Maryland</strong> recently received a $2.6 million federalgrant to construct 40 new truck parking spaces at the southboundwelcome center on I-95 in Howard County to address a severe shortage<strong>of</strong> commercial vehicle parking along this portion <strong>of</strong> the I-95 corridor.• The MDTA Police Commercial Vehicle Safety Unit (CVSU) will continueits aggressive commercial vehicle inspection and enforcement program.During FY2012, 25,904 commercial vehicle inspections were performedresulting in 3,839 commercial vehicle operators and 4,684 overweightvehicles being placed out <strong>of</strong> service. This enforcement helps tosafeguard the general public, as well as prevent damage to roadwaysfrom excessive vehicle weights or unsecured cargo.• MDTA Police CVSU continued to partner with Federal, State andlocal agencies to perform joint inspection and enforcementoperations. The unit’s efforts continued to address concerns regardingcommercial vehicles using local roadways to avoid inspection andweight enforcement.• Virtual weigh stations will be installed at key locations statewide, suchas one recently completed on I-83. Virtual weigh stations are real-timeautomated tools capable <strong>of</strong> capturing the speed, identity and weight<strong>of</strong> a commercial vehicle moving at highway speeds. This increasesthe State’s ability to monitor for safety and ensure properly weightedvehicles on <strong>Maryland</strong>’s road network.Introduction & Overview
Goal:Quality <strong>of</strong> ServiceKey InitiativesMDOT: Continue coordination with other State agencies through theGovernor’s FastTrack Program to expedite mixed-use, Transit-OrientedDevelopment (TOD) projects, such as the Pike and Rose TOD at WhiteFlint Metrorail Station in Montgomery County.Objectives• Enhance customer experience and service• Provide reliable and predictable travel time acrossmodal options for people and goods• Facilitate coordination and collaboration with agencypartners and stakeholdersMAA:MPA:Deliver a major terminal enhancement project at Baltimore/WashingtonInternational Thurgood Marshall Airport (BWI Marshall) to improve andmodernize the BWI Marshall passenger terminal facility.Expand cruise <strong>of</strong>ferings at the Port <strong>of</strong> Baltimore, such as the newlyrenovated Royal Caribbean Grandeur <strong>of</strong> the Seas which will return backto the Port <strong>of</strong> Baltimore in <strong>2013</strong>. The ship is currently undergoing a$48 million revitalization that will include many <strong>of</strong> the company’s mostinnovative features that are available on its two largest class ships.For people living in, traveling through, and doing business in <strong>Maryland</strong>, quality<strong>of</strong> service means access to transportation infrastructure and services that helpthem reach their travel destinations conveniently, comfortably and on time.Quality <strong>of</strong> service is important to <strong>Maryland</strong>ers, as a reliable, well-maintained andefficiently-operated transportation system contributes to a strong economy anda high quality <strong>of</strong> life by reducing delay, <strong>of</strong>fering diverse transportation options,and providing up-to-date information about the <strong>Maryland</strong> transportation system.To deliver the quality <strong>of</strong> service that <strong>Maryland</strong>ers expect, MDOT and its modalagencies keep pace with the age <strong>of</strong> instant information and informationtechnologies by <strong>of</strong>fering many real-time information services to assist travelersin planning where and when to travel and by what mode. These essentialinformation services include initiatives such as the <strong>Maryland</strong> 511 travelerinformation system that encourages travelers to “Know Before You Go.” Thesystem provides travel information via the web or phone on State-maintainedroadways, including travel time, incident or work zone lane closures weatherreports, and connections to transit, airport, and tourism information. SHA alsoprovides motorist information signs along highways to alert drivers to real-timetravel conditions. The MTA works to improve the timeliness <strong>of</strong> transit service aswell as transit information – several <strong>of</strong> MTA’s transit rider services and tools havebeen adapted to work seamlessly with mobile devices, including the MTA TripPlanner, Service Status, Service Alerts and Elevator/Escalator Outages. This year,MTA will test and implement its real time passenger information system. TheMVA <strong>of</strong>fers an ever-increasing number <strong>of</strong> online MVA services, including onlineState Identification (ID) card renewal.Quality <strong>of</strong> service also means providing the best value for each transportationinvestment. To achieve this end, MDOT applies a strategic decision makingprocess and carefully selects transportation projects and invests in programs toensure that public dollars are invested in an efficient and cost effective manner.MTA:MDTA:MVA:SHA:Continue expanding the use <strong>of</strong> Automatic Vehicle Locator (AVL)technology to provide MTA’s customers with real time arrivalinformation and assist MTA in better monitoring on time performance.Through an innovative Public Private Partnership (P3) agreement,reconstruction and improvements have begun to the two aging travelplazas (the <strong>Maryland</strong> and Chesapeake Houses) along I-95 in northeast<strong>Maryland</strong>. Project estimated completion, summer 2014.Continue to improve online services, such as MVA’s FastTrack Licensing,that allows <strong>Maryland</strong>ers to quickly and easily conduct a number <strong>of</strong>motor vehicle services for all vehicles that are associated with a driver’slicense number.Continue to enhance the accuracy and timeliness <strong>of</strong> traveler informationthrough “My 511 Direct” traveler services and the CoordinatedHighways Action Response Team (CHART) website.Performance MeasuresMonitoringAgencyMAAMPAPerformanceMeasurePercent <strong>of</strong> BWI Marshall customersrating the airport “good” or “excellent”on key servicesAverage truck turn-around time atSeagirt Marine TerminalPageMTA Percent <strong>of</strong> service provided on time 15MTA Customer satisfaction rating 16MDTAOverall customer satisfaction <strong>of</strong>E-ZPass® customers171718MDTAMVAPercent <strong>of</strong> toll transactions collectedelectronicallyBranch <strong>of</strong>fice customer visit time versuscustomer satisfaction rating1816SHA <strong>Maryland</strong> driver satisfaction rating 14SHAPercentage <strong>of</strong> the <strong>Maryland</strong>SHA network in overall preferredmaintenance condition1413
SHA: <strong>Maryland</strong> DriverSatisfaction RatingCustomer Satisfaction Surveys help determine if SHA servicesare better than average in the eyes <strong>of</strong> its customers. SHA strivesto achieve a “B” grade, which is equivalent to a four out <strong>of</strong>five rating.Calendar Year* 2006 2008 2010 2012Rating 3.93 3.90 3.94 3.92TARGET: 4 out <strong>of</strong> 5* Survey administered biennially.Why Did Performance Change?• Launched “My 511 Direct” 511 traveler services which sends personalizedinformation via text and email regarding both travel time estimates and incidentreport alerts• Focused customer communication on extensive road closures and traffic impactsusing the CHART webpage, highway message signs and press releases• Added live traffic feeds from partner agencies for public viewing on the CHARTwebsite• Partnered with State Farm Insurance to increase patrols on highways andenhance roadside assistance• Streamlined Customer Care Management System online form and web links tosupport customer feedback• Created a Design Council to enhance communications among engineering andconstruction areas, resulting in better internal SHA communicationsWhat Are Future Performance Strategies?• Implement the Customer “Bill <strong>of</strong> Rights” as an internal customerservice standard• Develop tools and mechanisms to follow up with SHA customers, includingan online customer care management system survey• Enhance website and use <strong>of</strong> social media to communicate with customers14Goal: Quality <strong>of</strong> ServiceSHA: Percentage <strong>of</strong> the <strong>Maryland</strong> SHA Networkin Overall Preferred Maintenance ConditionThe overall condition <strong>of</strong> the network reflects how well asset management strategies, improvedoperations and technology have sustained the quality and safety <strong>of</strong> existing highways.Percent <strong>of</strong> Network100.0%80.0%60.0%40.0%20.0%TARGET: Achieve 84% annually85.3% 87.1% 85.1% 81.7% 86.9% 85.8% 82.2% 85.1%2005 . 2006 2007 2008 2009 2010 2011 2012Calendar YearWhy Did Performance Change?• Total maintenance expenditures are closer to the average historicalamounts after two consecutive years <strong>of</strong> expenditures approximately$9 million below average• Additional money became available in FY2012, providing anopportunity to address previously deferred maintenance activitiesusing a combination <strong>of</strong> contract forces and SHA personnel• Emphasis was placed on maintenance activities that help improvewater quality, such as ditching, cleaning drainage facilities andshoulder edge repair• SHA received approval for federal funding for Federal FY<strong>2013</strong> forthe line striping asset management programWhat Are Future Performance Strategies?• Continue to maintain the statewide overall level <strong>of</strong> service while workingon individual assets that fall below the desired maintenance condition inspecific areas• Perform maintenance on safety-related activities such as signs, line striping,pavement markings and guardrail repair as a top priority• Seek federal funding for additional maintenance activities• Continue efforts with Federal Highway Administration (FHWA) funding <strong>of</strong>the line striping asset management program by advertising and awardingcontracts• Continue to focus attention on maintenance activities that improve waterquality as part <strong>of</strong> the Clean Water Act
MTA: Percent <strong>of</strong> Service Provided On TimeOn time performance is an important indicator <strong>of</strong> service quality and efficiency, andcorrelates highly with system usage and customer satisfaction.LOCAL Bus100%90%80%70%60%50%60% 79% 74% 71% 71%2004 2005 2006 2007 200873%200987%2010TARGET: 83%by <strong>2013</strong>85%201183%2012Why Did Performance Change?• All MTA modes (except Local Bus and Light Rail) eitherimproved or maintained on time performance (OTP) within0.5% <strong>of</strong> FY2011 values• Invested in Local Bus AVL system to obtain a more accuratepicture <strong>of</strong> Local Bus performance, allowing for better decisionmaking and service monitoring• Mobility Paratransit OTP increased by 1% due to ongoingefforts to improve service efficiency and effectiveness whilestill meeting a rapidly increasing service demand• Light Rail experienced several challenges including serviceinterruption from severe storms and major constructionprojectsWhat Are Future Performance Strategies?Light Rail100%90%80%70%60%50%100%200399%200499%200599%200699%200798%200899%200997%2010TARGET: 99%by <strong>2013</strong>98%*201196%2012• Use better data systems to find and troubleshootperformance issues to enable the MTA to target and resolveOTP issues for the Local Bus system• Enhance the use <strong>of</strong> AVL and Automatic Passenger Counter(APC) technologies to improve OTP through better scheduledesign and better operational supervision• Continue to schedule major track maintenance activitiesduring periods <strong>of</strong> low ridership, minimizing the effect <strong>of</strong> thiswork on riders100%• Address absenteeism and operator unavailability issues toimprove OTP as well as service efficiencyBaltimoreMetro90%80%70%60%50%97%200395%200492%200593%200695%200797%200898%200995%2010TARGET: 98%by <strong>2013</strong>97%201197%2012• Continue aggressive monitoring <strong>of</strong> MARC-contractedoperations and pursue infrastructure and scheduleimprovements that will benefit MARC riders• MTA has programmed $113 million in funding from jointcapital improvement agreements between MTA, Amtrak andCSX in the FY<strong>2013</strong>–FY2018 Consolidated <strong>Transportation</strong>Plan (CTP) to upgrade signal systems and passengeramenities on the MARC Camden, Brunswick and Penn lines100%90%• MTA is overhauling its Light Rail cars to improve fleetreliability and service efficiency (the FY<strong>2013</strong>–FY2018 CTPincludes $187.9 million to perform a mid-life overhaul <strong>of</strong> theLight Rail fleet)MARC80%70%60%50%90% 88% 89% 91% 89% 87%2003 2004 2005 2006 2007 200887%200989%2010TARGET: 95%by <strong>2013</strong>94%*201194%2012Quality <strong>of</strong> ServiceMoBILITYParatransit &Taxi Access100%90%80%70%60%50%80%200490% 91% 90% 91%92%2005 2006 2007 2008 2009Fiscal Year* 2011 data for Light Rail and MARC was revised from the 2012 <strong>Report</strong>.91%2010TARGET: 90%by <strong>2013</strong>89%201190%201215
MAA: Percent <strong>of</strong> BWI Marshall CustomersRating the Airport “Good” or “Excellent”on Key Services*Customer surveys provide valuable feedback to agencies regarding servicedelivery, enabling them to continuously respond to customer needs.Percent100%90%80%70%TARGET: 80%88%82%86%85%81%83%83%Why Did Performance Change?• BWI Marshall continues to far exceed its customer satisfaction goals• Continued to ensure that the airport’s cleanliness is maintained in acost effective manner• Continued to provide directional signage to make navigating the BWIMarshall easy• Maintained BWI Marshall’s excellent parking productWhat Are Future Performance Strategies?• Continue to manage the BWI Marshall cleaning contracts to ensurethat the cleanliness <strong>of</strong> the terminal building, restrooms and otherfacilities meet the expectations <strong>of</strong> passengers at BWI Marshall• Supplement current retail with recognized local and national chains inthe terminal60%74%79%81%89%88%92%91%50%20042005 2006 2008 2009**Fiscal Year*20112012Percent <strong>of</strong> “good” or“excellent” passenger ratingPercent <strong>of</strong> passengerslikely to fly from BWIMarshall on their next trip* Surveys not administered in 2007 and 2010.**The 2009 rating only reflects first quarter 2009 data, not the full fiscal year.Quality <strong>of</strong> Service17MPA: Average Truck Turn-Around Time atSeagirt Marine TerminalTruck turn-around time is a gross measure <strong>of</strong> the efficiency and operations <strong>of</strong> theSeagirt Marine Terminal. Reductions in turn-around times improve throughputcapacity and result in incremental environmental benefits.Truck Turn-Around Time (Minutes)60.050.040.030.020.010.00.056.936.9200352.3SINGLE MOVESTARGET: 30 min.35.458.037.957.239.858.939.557.039.02004 2005 2006 2007 2008 2009Fiscal YearSingle moves (either a drop or pickup)54.430.556.230.92010DOUBLE MOVESTARGET: 60 min.54.839.5201156.030.22012Double moves (drop and pickup)Why Did Performance Change?• Equipment and technology enhancements were implemented,thereby improving gate velocity and processing efficiencies• Change in chassis pool usage allows drivers to use their chassismultiple times in lieu <strong>of</strong> dropping and picking a chassis everytime they enter the terminal• More drivers are making dual moves versus single moves, whichprovides better overall efficiencies• Fully implemented the <strong>Transportation</strong> Worker IdentificationCredential (TWIC) program to balance security and commerceWhat Are Future Performance Strategies?• Continue cost/benefit based evaluation and possibleimplementation <strong>of</strong> additional process enhancing technologiesto further improve gate and terminal performance• Evaluate business processes to ensure gate and terminalprocesses are not adversely impacted by existing and proposedcommercial improvements
18MDTA: Overall Customer Satisfaction <strong>of</strong>E-ZPass® CustomersThis measure tracks the satisfaction <strong>of</strong> E-ZPass ® private account holders.Fiscal Year* 2007 2010 2012Percent Satisfied 87% 86% 83%Why Did Performance Change?• Implemented comprehensive customer survey program to allow forcontinual customer feedback and enhance MDTA’s ability to respond toidentified issues• Implemented a program to close accounts that remained inactive for 18months or greater – closing approximately 65,000 inactive accounts• The MDTA approved and implemented the largest toll increase in its historyin 2011, with additional increases approved for July 1, <strong>2013</strong>Quality <strong>of</strong> ServiceTARGET: 87% (Baseline year = 2007)* Survey not implemented in 2008, 2009 and 2011.What Are Future Performance Strategies?• Expand retail sales <strong>of</strong> E-ZPass ® and “On-The-Go” opening new retail outlets• Maintain a vacancy rate <strong>of</strong> 7.0% or below to ensure employees are presentto meet the needs <strong>of</strong> customers• Begin to use in-house resources in <strong>2013</strong> for online customer satisfactionsurveys• Expand surveys to all agency customers – not just E-ZPass ® private accountholders – using web and social media• Continue to use email, statement messages, web and social media tocommunicate with E-ZPass ® account holders on E-ZPass ® matters,construction projects, traffic management, etc• Continue large employer and community visits/events with E-ZPass ®Outreach Team for the Intercounty Connector (ICC)/MD 200 and I-95 ExpressToll Lanes (ETLs)• Consider customers’ suggestions for improvements as fiscal constraints allowMDTA: Percent <strong>of</strong> Toll Transactions CollectedElectronically*Electronic toll collection systems expedite the toll collection process, reduce delays at toll plazas,decrease emissions, and are available at all eight toll facilities across the state.Toll Transactions(Millions)130.0125.0120.0115.0110.0105.0100.0LONG-TERM TARGET: 78%41%44%51%55%114.8 117.1 117.5 118.6 120.1 120.02003 2004 2005 2006 2007 2008* Toll collections are paid as cash, ticket, or electronic transaction.** The methodology for toll transactions collected electronically was modified; data beginning in 2009 hasbeen revised to reflect the new methodology.59%60%SHORT-TERM TARGET: 76%60%117.12009**62%117.12010fiscal YearTotal toll transactionsPercent <strong>of</strong> electronic tolltransactions63%120.9201171%128.02012100%80%60%40%20%0%Percent <strong>of</strong> ElectronicToll TransactionsWhy Did Performance Change?• Opened the ICC/MD 200 Section B & C(MD 97 to I-95)• Conducted a public outreach campaignsto encourage use <strong>of</strong> E-ZPass ®• Electronic toll transactions, includingE-ZPass ® transactions, continued toincrease in volume and in the percentage<strong>of</strong> total transactions• Initiated conversion <strong>of</strong> the Hatem BridgeAutomatic Vehicle Identification (AVI)decal program to E-ZPass ® programsWhat Are Future PerformanceStrategies?• Expand retail sales <strong>of</strong> E-ZPass ® “On-The-Go” through new retail outlets• Complete conversion <strong>of</strong> the Hatem BridgeAVI decal program to E-ZPass ®
Goal:Safety & SecurityObjectives• Reduce the number and rate <strong>of</strong> transportation-relatedfatalities and injuries• Secure transportation assets for the movement <strong>of</strong>people and goods• Coordinate and refine emergency response plansand activitiesThe safe travel <strong>of</strong> <strong>Maryland</strong> residents and visitors, by all modes <strong>of</strong> transportation, is atop priority for MDOT. To lower fatalities on the roadways, law enforcement, highwaysafety <strong>of</strong>ficials, emergency medical responders and champions in the communityjoined together to support the Towards Zero Deaths campaign. This effort is intendedto change drivers’ perception <strong>of</strong> safety, spreading the message that even one deathon <strong>Maryland</strong> roadways is too many. <strong>Maryland</strong> has also been recognized by theLeague <strong>of</strong> American Bicyclists for their bicycle safety efforts, ranking number eightin the nation and number three in the Northeast as a Bicycle Friendly State. Thepassage and enforcement <strong>of</strong> bicycle-friendly laws, making it safe and comfortablefor people <strong>of</strong> all ages to ride in <strong>Maryland</strong>, has helped the State earn this distinction.Pedestrian safety is also a key priority. For example, MDOT will use results from athree-year pilot program using newly designed sidewalk markings to safely guidepedestrians along the Coastal Highway in Ocean City to further enhance safety. Thiscity becomes the second most populated in the state during the summer months.A number <strong>of</strong> Transit-Oriented Development (TOD) projects are also underway in thestate, creating communities that have the potential to ensure personal security andsafety with amenities such as lighting, wider sidewalks and bicycle lanes.<strong>Maryland</strong>’s transportation facilities, such as the Port <strong>of</strong> Baltimore, State highways,public transportation systems and BWI Marshall are critical to the secure movement<strong>of</strong> people and goods in the state. For the fourth consecutive year, the Port <strong>of</strong>Baltimore has received an excellent security assessment from the Coast Guardreview, mainly due to more effective security risk mitigation strategies and thededication <strong>of</strong> the operations and port security departments. BWI Marshall has takensteps to accommodate passenger growth without compromising safety and security,initiating a major terminal enhancement project, which includes a new, expandedsecurity checkpoint, with the latest screening equipment, and a secure connectorbetween Concourses B and C. The MDTA Police were honored with the Commissionon Accreditation for Law Enforcement Agencies (CALEA) TRI-ARC Excellence Award,recognizing, amongst other accomplishments, their ability to strengthen crimeprevention and control capabilities on <strong>Maryland</strong>’s highways.Key InitiativesMDOT: Increase attention on bicycle safety by partnering with Bike <strong>Maryland</strong> toupdate, publish, and distribute “Bike Baltimore” maps, host workshopson bicycle safety, and organize outreach events by law enforcement.MAA: Continue replacement <strong>of</strong> all integrated life-safety and security systemsat BWI Marshall ensuring the use <strong>of</strong> new technologies meeting federalregulations that integrate all emergency, monitoring and security systems.MPA: Continue to provide excellent security services on all MPA terminals,enhance security awareness through information analysis anddissemination with public and private institutions, and deploy newcost-effective risk management methodologies for the protection <strong>of</strong>facility assets.MTA: Annually participate in and host emergency preparedness exerciseswith Federal, State and local <strong>of</strong>ficials to improve intelligence sharing,prevention, response and/or recovery from emergency situations.MDTA: MDTA Police will continue to develop new safety programs and activelylead and participate in organized safety events including Child SafetySeat Checks, Smooth Operator, Click It or Ticket and the <strong>Maryland</strong>SafeZones Automated Speed Enforcement program.MVA: The <strong>Maryland</strong> Highway Safety Office (MHSO) migrated to the MVAand has been joined with Driver Safety Services to more effectivelycollaborate in on-going highway safety programs for high risk userssuch as older and younger drivers and motorcycle operators. Continuedcollaboration with the SHA will include combined pedestrian andbicycle safety initiatives as well as the coordination <strong>of</strong> local highwaysafety programs through the MHSO’s Regional Traffic Safety Programshoused in local SHA District Offices.SHA: Continue to enhance driver, cyclist, and pedestrian safety throughprojects that improve roadways, enhance lighting, increase pedestriancomfort and safety, and provide better access to transit throughongoing implementation <strong>of</strong> the Community Safety and EnhancementProgram, Sidewalk Program and Pedestrian Access to Transit Program.Performance MeasuresMonitoringAgencyPerformanceMeasurePageMAA BWI Marshall crime rate 23MAAMAAMPAMTANumber <strong>of</strong> repeat discrepancies in theannual Federal Aviation Administration’sFederal Aviation Regulation inspectionRate <strong>of</strong> airfield ramp incidents andaccidents per 1,000 operationsMPA compliance with the Maritime<strong>Transportation</strong> Security Act <strong>of</strong> 2002Customer perceptions <strong>of</strong> safety on theMTA system24232422MTA Preventable accidents per 100,000vehicle miles22MVAPercent <strong>of</strong> Homeland Security REAL IDAct benchmarks achieved24MVA/SHANumber <strong>of</strong> bicycle and pedestrianfatalities and injuries on all <strong>Maryland</strong> roads2119MVA/SHA &MDTAAnnual number <strong>of</strong> traffic fatalitiesand personal injuries on all roads in<strong>Maryland</strong>20
20MVA/SHA/MDTA: Annual Number <strong>of</strong> TrafficFatalities and Personal Injuries on AllRoads in <strong>Maryland</strong>In line with international trends, <strong>Maryland</strong> uses reductions in the actual numbers <strong>of</strong>traffic fatalities and injuries as desired safety outcomes. Injury and fatality data helpto assess the effectiveness <strong>of</strong> the <strong>Maryland</strong> Strategic Highway Safety Plan (SHSP)and to identify tendencies and trends that assist in implementing a wide variety <strong>of</strong>countermeasures.Goal: Safety & SecurityAnnual Number <strong>of</strong> Traffic Fatalities on All Roads in <strong>Maryland</strong>Rate Per 100 Million MilesTraveledAnnual Number <strong>of</strong> Personal Injuries on All Roads in <strong>Maryland</strong>Rate Per 100 Million MilesTraveled3.503.002.502.001.501.000.500.00140.0120.0100.080.060.040.020.00.06611.232002110.720026511.192003106.320036431.172004104.26141.08200597.794.72004 2005 2006 2007 2008 2009Calendar YearPersonal injury rate per 100 millionmiles traveled on all roads in <strong>Maryland</strong>* 2011 data is preliminary and is subject to change.Calendar YearTraffic fatality rate per 100 millionmiles traveled on all roads in <strong>Maryland</strong>* 2011 data is preliminary and is subject to change.6511.15200691.185.8Annual number <strong>of</strong> traffic fatalitieson all roads in <strong>Maryland</strong>TARGET: < 40,000 injuriesper year by 201559,517 58,11857,40955,28753,61551,72948,148 47,38044,487 44,5406151.0820075921.052008TARGET: < 475 fatalitiesper year by 20155500.99200985.24960.88201079.220104870.872011*79.52011*Annual number <strong>of</strong> personalinjuries on all roads in <strong>Maryland</strong>700650600100,00090,00080,00070,00060,00050,00040,00030,00020,00010,0000550500450Number <strong>of</strong> FatalitiesNumber <strong>of</strong> InjuriesWhy Did Performance Change?• Implemented new guidelines for installation <strong>of</strong> rumble strips toreduce roadway departure and head-on crashes• Implemented pedestrian roadway safety audits to improve a datadrivenapproach to the selection, prioritization and programming<strong>of</strong> pedestrian safety enhancement projects• Enhanced preventative measures through appropriate, targeted,systematic interventions based on detailed, root-cause analysis• Implemented Facility Inspection Program Strategic Plan,integrated facility management s<strong>of</strong>tware, and completion <strong>of</strong> acomprehensive inspection manual specific to MDTA• The MVA’s MHSO collaborated in sophisticated strategicplanning with local partners and stakeholders, for example,coordinated enforcement and educational outreach efforts incritical aspects <strong>of</strong> highway safety such as occupant protection,impaired driving, aggressive driving and speed management• MHSO engagement <strong>of</strong> law enforcement to be more active inhighway safety included collaboration with top law enforcementexecutives across the state as well as training in effective trafficenforcement for <strong>of</strong>ficers at all organizational levels• SafeZones automated speed enforcement program resulted infewer aggressive drivers/speeders in work zones and contributedto the lowest number <strong>of</strong> work zone crash fatalities and injuries inmore than 10 yearsWhat Are Future Performance Strategies?• Implement the new SHSP for the years 2011 to 2015 thatinvolves a multi-agency, multi-jurisdictional approach to continueto reduce fatalities and injuries along <strong>Maryland</strong>’s highways• Focus on six critical safety areas including: pedestrian safety,distracted driving, occupant protection, impaired driving,infrastructure, and aggressive driving; also focus on geographiclocations where crashes are most prevalent• Conduct 10 road safety audits annually with preference athigh-priority crash areas and continue to identify deficiencies andneeded safety enhancements• Continue to have all District Offices review fatal crash assessmentand other safety reports and annually set performance targets toreduce numbers <strong>of</strong> crashes in over-represented categories• Develop action plans in each District to address wet weatherrelated crash locations• Develop and implement a comprehensive communications andmarketing plan that addresses high-priority traffic safety issues• Pilot test projects to implement Safety Edge technology to reduceroad-departure incidents• Increase the number <strong>of</strong> virtual weigh stations in order to increasecompliance with Federal Motor Carrier Safety Regulations and<strong>Maryland</strong> size and weight laws
Goal: Safety & SecurityMVA/SHA: Number <strong>of</strong> Bicycle and PedestrianFatalities and Injuries on All <strong>Maryland</strong> Roads<strong>Maryland</strong> uses reductions in the actual numbers <strong>of</strong> bicycle and pedestrian fatalities andinjuries as desired safety outcomes. Injury and fatality data help to assess the effectiveness <strong>of</strong>the <strong>Maryland</strong> SHSP and to identify tendencies and trends that assist in implementing a widevariety <strong>of</strong> countermeasures.Number <strong>of</strong> Bicycle Fatalities and Injuries on All <strong>Maryland</strong> RoadsNumber <strong>of</strong> Bicycle InjuriesNumber <strong>of</strong> Pedestrian Fatalities and Injuries on All <strong>Maryland</strong> RoadsNumber <strong>of</strong> Pedestrian Injuries8007006005004003002001000Target: < 542 injuriesper year by 2015772220026641200311652* 2009 injuries data revised from 2012 <strong>Report</strong>.** 2011 data are preliminary.3,0002,5002,0001,5001,0005000Target: < 2,050 injuriesper year by 20151012,56620021182,72420032004 2005 2006 2007 2008Calendar YearNumber <strong>of</strong> bicycle injurieson all roads in <strong>Maryland</strong>952,4812004629Calendar YearNumber <strong>of</strong> pedestrian injurieson all roads in <strong>Maryland</strong>71012,6252005* 2009 and 2010 injuries data revised from 2012 <strong>Report</strong>.** 2011 data are preliminary.7648932,59420067710636 619 5591102,52620072009*Number <strong>of</strong> bicycle fatalitieson all roads in <strong>Maryland</strong>1152,4692008Number <strong>of</strong> pedestrian fatalitieson all roads in <strong>Maryland</strong>TARGET: < 3 fatalitiesper year by 20158601201055742011**TARGET: < 92 fatalitiesper year by 20151112,3482009*1012,3392010*1042,1722011**16128401501251007550250Number <strong>of</strong> Bicycle FatalitiesNumber <strong>of</strong> Pedestrian FatalitiesWhy Did Performance Change?• Established an <strong>of</strong>ficial pedestrian safety committee/task force within SHA to develop a strategic approachto improve pedestrian safety around the state• Implemented two StreetSmart pedestrian safetycampaigns, which use marketing techniques to raiseawareness <strong>of</strong> pedestrian safety• Identified 24 high-crash locations across the stateto focus additional engineering, enforcement andeducation efforts to improve pedestrian safety• Implemented innovative engineering techniques toimprove pedestrian safety in Ocean City and in variouslocations in Montgomery County• Adopted an <strong>of</strong>ficial Complete Streets policy for all SHAprojects and issued a new bicycle policy that mandatesresurfacing projects to construct bicycle lanes,whenever possible, and for all projects to mark bicyclelanes if the space is available• Established an <strong>of</strong>ficial SHA bicycle committee toimprove bicycle guidance and policies that pertain toSHA roadwaysWhat Are Future PerformanceStrategies?• Work with the local county public works departmentsto determine high pedestrian risk areas around thestate to proactively address potential pedestriansafety issues• Conduct a pedestrian roadway safety audit on the topeight high pedestrian crash locations and work to fundthe resulting audit recommendations• Utilize social media to establish a more progressiveform <strong>of</strong> communication between the bicyclingcommunity and SHA• Coordinate education and enforcement efforts withengineering efforts to more effectively improvepedestrian and vehicular behaviors in high crashlocations• Investigate innovative funding strategies for theimplementation <strong>of</strong> pedestrian safety and implementstrategies from the SHSP to enhance pedestrian safety21
22MTA: Customer Perceptions <strong>of</strong> Safety on theMTA SystemA positive perception <strong>of</strong> personal safety is correlated with higher ridership andstronger commitment to transit as a mode <strong>of</strong> travel.LOCALBusLightRailBaltimoreMetro5.04.03.02.01.05.04.03.02.01.05.04.03.02.01.02.720072.720072.82.82008 20103.02008 20103.23.4 3.43.33.43.4TARGET: 3.520112007 2008 2010 2011* 2012**Year(1=Poor and 5=Excellent)2009 survey not administered.*2011 data was revised from the 2012 <strong>Report</strong>.**All 2012 data are estimated. Final 2012 data will be available in the spring <strong>of</strong> <strong>2013</strong>.3.32012**TARGET: 3.53.12011*3.02012**TARGET: 3.53.33.3MARCContractedCommuterBus1.05.04.03.02.05.04.03.02.01.03.320073.720073.43.92008 20104.14.12008 2010TARGET: 4.03.83.82011* 2012**TARGET: 4.24.120114.12012**Why Did Performance Change?• As MTA’s crime rate continues to fall, customers continue t<strong>of</strong>eel safe• Utilized the Police Cadet program to improve the visibility <strong>of</strong>MTA’s Police Forces• Used Closed Circuit TV (CCTV) and other security measures toensure the safety <strong>of</strong> customers at Baltimore Metro stations andon the bus fleet• Continued safety and security programs, such as the ZoneEnforced Uniform Sweeps (ZEUS) and CompStatWhat Are Future Performance Strategies?• Continue to utilize the Police Cadet program to improve thevisibility <strong>of</strong> MTA’s Police Forces, make traveling safer and give<strong>Maryland</strong> youth a point <strong>of</strong> entry into transit law enforcement• Utilize CCTV and other security measures to ensure the safety<strong>of</strong> customers• Target and prevent criminal activity through both covert andovert police operations, efficiently and effectively launchedthrough the CompStat process• In the FY<strong>2013</strong>–FY2018 Consolidated <strong>Transportation</strong> Plan(CTP), MTA has programmed over $41 million in <strong>Department</strong><strong>of</strong> Homeland Security grants to enhance law enforcementresources on the MTA systemGoal: Safety & SecurityMTA: Preventable Accidents Per 100,000Vehicle MilesMTA has developed a baseline from which to reduce preventable accidents, increaseefficiency and provide a safer ride to customers.CALENDAR YEAR 2007 2008 2009 2010 2011 2012* TARGETAccident RateLocal Bus 2.50 2.50 2.93 2.86 3.10 2.12Light Rail n/a n/a 0.06 0.31 0.16 0.19Baltimore Metro n/a n/a 0.20 0.17 0.05 0.03Paratransit/Taxi Accessn/a n/a 1.14 0.00 2.31 2.07(Baseline year = 2008)* 2012 data are estimated and will be finalized in next year’s <strong>Report</strong>.2.0 byCY<strong>2013</strong>0.15 byCY<strong>2013</strong>0.03 byCY<strong>2013</strong>2.0 byCY<strong>2013</strong>Why Did Performance Change?• All MTA modes except Light Rail have experienceda decrease in preventable accident rates (based onestimated 2012 data)• Significant decreases in the Local Bus accident rate aredue to ongoing efforts to increase operator accountabilitythrough re-training and corrective action• Paratransit accidents are slightly higher over the past fouryears due to a change in how accidents are captured(including accidents from contracted service providers)What Are Future Performance Strategies?• Continue accountability efforts to ensure that operatorswith multiple preventable accidents receive appropriatere-training and corrective action• Utilize efficient and effective training methodologies,including the bus simulator, operator re-certificationprograms, and safe operation awards, to give operators theskills they need to perform their duties safely• Review accidents with the aid <strong>of</strong> geographic informationsystems (GIS) to determine patterns (i.e. operators, times<strong>of</strong> day, locations) and develop corrective action to furtherreduce accident risks
MAA: Rate <strong>of</strong> Airfield Ramp Incidents andAccidents Per 1,000 OperationsThis measure provides an indication <strong>of</strong> the safety and security <strong>of</strong> operations-relatedactivity at BWI Marshall.Accidents & Incidents(Per 1,000 Operations)0.2600.2400.2200.2000.1800.1600.1400.1200.1000.0800.060TARGET: Airfield Ramp Incident/Accidentrate
24MAA: Number <strong>of</strong> Repeat Discrepancies in the AnnualFederal Aviation Administration’s Federal AviationRegulation InspectionThe passing <strong>of</strong> Federal Acquisition Regulation (FAR) Part 139, which governs the certification andoperation <strong>of</strong> U.S. commercial airports, is requisite for the airport to remain open and operational.Each year, MAA works closely with the FAA to ensure that BWI Marshall remains in compliance withthe provisions <strong>of</strong> FAR Part 139 and maintains its FAA-issued operating certificate. Compliance isdetermined by annual inspections conducted by the FAA. Work orders are generated when Letters <strong>of</strong>Correction are issued and are given high priority with urgent resolution. BWI Marshall successfullycompleted the 2012 FAA safety and certification inspection with zero repeat discrepancies. MAA willcontinue to address all discrepancies in accordance with the federally prescribed timeline.What Are Future PerformanceStrategies?• Work closely with FAA to ensure that BWIMarshall passes its annual safety andcertification inspection• Focus activities on achieving a 100%compliance with safety and certificationrequirements• Comply with FAA Runway Safety Areastandards by December 2015 ($301.1 millionprogrammed in the FY<strong>2013</strong>–FY2018 CTP forRunway Safety Area / Pavement ManagementProgram improvements)Goal: Safety & SecurityMPA: MPA Compliance with the Maritime<strong>Transportation</strong> Security Act <strong>of</strong> 2002The MPA is required to maintain and execute a Facility Security Assessment and Plan. MPAterminals can be closed by the U.S. Coast Guard if found not in compliance with the Maritime<strong>Transportation</strong> Security Act (MTSA) <strong>of</strong> 2002.As required by the MTSA <strong>of</strong> 2002, all MPA terminals’ Facility Security Assessment and FacilitySecurity Plans currently meet MTSA requirements and have been approved by the U.S. Coast Guard.The U.S. Coast Guard will issue an order to cease operations if an MPA facility is not in compliance.Closure <strong>of</strong> a public terminal has never occurred at MPA. In MPA’s most recent U.S. Coast Guardannual inspection, MPA met or exceeded all aspects <strong>of</strong> the inspection. MPA will continue to assessits security plans and make adjustments or additions where appropriate to assets, personnel,equipment and technology in order to maintain security at all State-owned facilities.MVA: Percent <strong>of</strong> Homeland Security REAL ID ActBenchmarks AchievedThe Federal REAL Identity Act provisions for secure licensing and IDs (REAL ID) <strong>of</strong> 2005 sets newstandards for issuing driver licenses and identification cards, and is intended to improve the integrityand security <strong>of</strong> State-issued driver licenses and identification cards. On January 15, 2008, GovernorMartin O’Malley directed MDOT to create a State driver’s license that fully complies with the FederalREAL ID regulations released by the <strong>Department</strong> <strong>of</strong> Homeland Security. The REAL ID compliantlicense in <strong>Maryland</strong> requires an individual to provide pro<strong>of</strong> <strong>of</strong> lawful presence in the United States,as legislatively required by Congress under the REAL ID Act <strong>of</strong> 2005. The REAL ID process has beenphased in over time to enable states to achieve the required 39 Federal benchmarks in order to bein Full Compliance with REAL ID. As <strong>of</strong> August 2012, the MVA has achieved an 85% Full Compliancerate, meaning 33 <strong>of</strong> the 39 benchmarks have been successfully accomplished. The MVA continuesto implement technical and program enhancements as they become available by the Federalgovernment, in partnership with American Association <strong>of</strong> Motor Vehicle Administrators (AAMVA), inan effort to achieve full compliance in <strong>2013</strong>.What Are Future PerformanceStrategies?• Continue the Roll on Roll <strong>of</strong>f Cargo (RoRo)Quality Cargo Handling Action Team (QCHAT)to make improvements for all parties• Develop new Dundalk gate procedures toincrease volumes <strong>of</strong> privately-owned vehicles(POVs) as it relates to <strong>Transportation</strong> WorkerIdentification Credential (TWIC) escorts• Construct new cargo gate using proventechnologies for South Locust Point to improvesecurity, capacity and processing times• Complete construction <strong>of</strong> capital projects toimprove security at State-owned terminals toinclude Security Emergency Operations Center,Access Control Center, Vehicle InspectionStations and Security Booths ($12.4 million forthe Terminal Security Program in the FY<strong>2013</strong>–FY2018 CTP)What Are Future Performance Strategies?• Staff and support the REAL ID Executive Committee to provide direction and enact policies to ensure<strong>Maryland</strong>’s compliance with the Federal REAL ID Act• Proactively develop and implement policies, procedures and technologies to achieve completion <strong>of</strong> the39 Federal REAL ID benchmarks• Administer and support legislation and regulations that require individuals to provide pro<strong>of</strong> <strong>of</strong> lawfulpresence in the U.S.• Execute Federal and State funds to enhance the integrity and security <strong>of</strong> State-issued driver licenses andidentification cards• Continue to implement technical and program enhancements as they become available by the Federalgovernment, in partnership with the AAMVA
Goal:System Preservation& PerformanceObjectives• Preserve and maintain the existing transportationnetwork• Maximize operational performance and efficiency <strong>of</strong>existing systems<strong>Maryland</strong>’s existing transportation infrastructure was developed throughthe cumulative investments <strong>of</strong> generations <strong>of</strong> taxpayers. The transportationnetwork provides for the mobility <strong>of</strong> people and goods and is indispensable tothe state’s economy. <strong>Maryland</strong> prioritizes investments that extend the usefullife <strong>of</strong> existing transportation system facilities. Preserving and maintainingthe multimodal transportation network is one <strong>of</strong> the State’s highest prioritiesas evidenced by the $928 million MDOT will provide for system preservationprojects and programs in FY<strong>2013</strong>.The SHA and the MDTA continue to place special emphasis on improving thecondition <strong>of</strong> bridges, a special area <strong>of</strong> focus for the State. Both agencies manageaggressive programs to keep bridges safe and are rehabilitating and/or replacingstructurally deficient bridges throughout <strong>Maryland</strong>. Major bridges as well asmany other smaller, yet critically important bridges across the state are plannedto undergo preservation and maintenance activities in the FY<strong>2013</strong>–FY2018Consolidated <strong>Transportation</strong> Program (CTP).With growth in traffic volumes outpacing the ability to expand capacity throughconstruction <strong>of</strong> new highway lanes, <strong>Maryland</strong> is continuing to find ways toget more out <strong>of</strong> the existing transportation system. MDOT’s transportationagencies continue to implement operations strategies and deploy Intelligent<strong>Transportation</strong> System (ITS) technologies to improve system efficiency. Forexample, SHA’s Coordinated Highways Action Response Team (CHART) isinvesting $98.5 million in the FY<strong>2013</strong>–FY2018 CTP to improve the provision<strong>of</strong> real-time traffic and incident information to travelers and to reduce incidentresponse times. MTA is aggressively rehabilitating both Baltimore Metro andLight Rail vehicles to improve performance reliability and enhance customercomfort.Key InitiativesMDOT: Continue to facilitate the award and implementation tracking <strong>of</strong>federal and state grant funding allocations to improve and maintainvarious multimodal transportation assets throughout the state.MAA: MPA:Continue to undertake a major airfield improvement program topreserve existing airfield capacity at BWI Marshall by addressingpavement rehabilitation needs and new Federal Aviation Administration(FAA) runway safety area standards.Continue to position the Port <strong>of</strong> Baltimore as the preferred destinationon the Mid-Atlantic Coast for the largest container ships in this market,including the recent completion <strong>of</strong> the 50-foot deep berth at SeagirtMarine Terminal and addition <strong>of</strong> four Super-Post Panamax cranes.MDTA: Continue to fund and schedule completion <strong>of</strong> high-priority systempreservation projects and expand the current system preservationprogram to include preventative maintenance activities which willprolong the life <strong>of</strong> the existing infrastructure.MTA:MVA:SHA:Continue system maintenance <strong>of</strong> Light Rail grade crossings and BaltimoreMetro track infrastructure repairs to maintain safe, reliable operation.Continue to invest in information technology, including the ProjectCore enterprise system which will modernize, standardize and integratecore MVA business systems, and the Alternative Service Delivery (ASD)systems, to maintain cost-efficiencies.Continue programs to reduce the number <strong>of</strong> SHA-owned bridges thatare structurally deficient through intensive maintenance, repair andrehabilitation efforts, and maintain the percent <strong>of</strong> bridges on the SHAportion <strong>of</strong> the National Highway System (NHS) that will allow all legallyloaded vehicles to safely traverse. By April 2012, SHA had reduced thetotal number <strong>of</strong> SHA-owned structurally deficient bridges to 97 total, 42<strong>of</strong> those on the NHS, out <strong>of</strong> 2,578 statewide (1,182 along the NHS).Performance MeasuresMonitoringAgencyPerformanceMeasurePageMAA Airline cost per enplaned passenger (CPE) 32MAAMPANon-airline revenue per enplanedpassenger (RPE)Adequate dredge material placementcapacity remaining for Harbor and Baymaintenance and new work dredgingMPA Revenue versus operating expense 343233MTA Operating cost per passenger trip 29MTA Operating cost per revenue vehicle mile 30MTA Passengers per revenue vehicle mile 28MVA Cost per transaction 31MVAAlternative service delivery transactionsas percent <strong>of</strong> total transactions31SHAUser cost savings for the travelingpublic due to incident management27SHA & MDTAPercent <strong>of</strong> roadway miles withacceptable ride quality2625SHA & MDTANumber <strong>of</strong> bridges and percent that arestructurally deficient26
26SHA & MDTA: Percent <strong>of</strong> Roadway Mileswith Acceptable Ride QualityThe traveling public has identified acceptable ride quality (i.e., the smoothness orroughness <strong>of</strong> the pavement) as a priority. Ride quality facilitates mobility, efficiencyand safe movement <strong>of</strong> people and goods within <strong>Maryland</strong>.Percent <strong>of</strong> Roadway Mileage100%90%80%70%60%50%TARGET: 86% Short Term (<strong>2013</strong>)83%200282%200382%200483%84%86%86%2005 2006 2007 2008Calendar YearTARGET: 84% Long Term (2015)87%200986%201086%2011Why Did Performance Change?• Overhauled and enhanced the MDTA inspectionprogram to better identify, report and address inspectionfindings and continued implementation <strong>of</strong> thecomprehensive Facility Inspection Program Strategic Plan• Implemented integrated facility management s<strong>of</strong>twareand a comprehensive inspection manual specific toMDTA• Significantly increased the use <strong>of</strong> pavement preservationtreatments compared to previous years• Continued identification <strong>of</strong> cost-effective projects onhigh-demand highwaysWhat Are Future Performance Strategies?• Expand the current system preservation program toinclude preventative maintenance activities whichwill prolong the life <strong>of</strong> the existing infrastructure• Continue to fund and schedule completion <strong>of</strong> highprioritysystem preservation projects• Target low-friction locations• Continue to expand use <strong>of</strong> recycled materials suchas concrete and asphalt in roadway projects in aresponsible manner and increase the use <strong>of</strong> moredurable materials in high demand highways• Continue to implement FHWA and SHA pavementpreservation programs that will strategically utilizesystem preservation activitiesGoal: System Preservation & PerformanceSHA & MDTA: Number <strong>of</strong> Bridges andPercent That Are Structurally DeficientThe structurally deficient rating is an early warning sign for engineers to initiate therehabilitation or replacement process and to use when prioritizing and recommendingsystem preservation funding. The rating applies to three main elements <strong>of</strong> a bridge:1) deck (riding surface); 2) superstructure (main supporting element <strong>of</strong> the deck); and3) substructure (supports to hold up the superstructure and deck). These elements arerated on a scale from zero (closed to traffic) to nine (relatively new). If any <strong>of</strong> the threeelements is rated as a four or less, the bridge is categorized as structurally deficient byFederal standards. This does not mean that the bridge is unsafe; if a bridge becomesunsafe, it is closed.Calendar Year 2006 2007 2008 2009 2010 2011 2012Number deficient 145 132 133 117 111 110 101Percent deficient 5.2% 4.7% 4.7% 4.1% 3.9% 3.9% 3.5%TARGET: 105 total bridges by <strong>2013</strong>Why Did Performance Change?• SHA continued an aggressive bridge maintenance andrehabilitation program which keeps up to 12 constructioncrews working full time, year-round• Addressed bridges that were deficient and minimized thenumber <strong>of</strong> bridges that may become deficient• Created plans to replace deficient structures that cannotbe corrected by remedial work• Efficiently utilized all bridge funding received in a timelymanner• MDTA implemented an aggressive system preservationand maintenance inspection programWhat Are Future Performance Strategies?• Commence engineering activities on structurally deficientbridges or potential structurally deficient candidates, tobuild an inventory <strong>of</strong> contract documents for shovel-readyprojects, which can take advantage <strong>of</strong> additional funding• Perform immediate inspections and structural evaluationson water crossings after significant storm events• Program over $228 million in funding ( FY<strong>2013</strong>–FY2018CTP) to maintain and repair bridges on MDTA- operatedfacilities throughout <strong>Maryland</strong>• Expand the current system preservation program to includepreventative maintenance activities• Continue to fund and schedule completion <strong>of</strong> high-prioritysystem preservation projects, such as underwater repairsat Hatem and Tydings Bridges, multi-facility structuralsteel painting projects and cable rewrapping anddehumidification on the Bay Bridge• Continue to fund, design and perform high-prioritystructural repairs based on annual inspection report findings
SHA: User Cost Savings for the Traveling PublicDue to Incident ManagementThe total user cost savings to motorists and commercial traffic (from reduced delay)reflects the tangible benefits <strong>of</strong> the CHART incident management program.Dollars (Millions)$1,600$1,400$1,200$1,000$800$600$400$200$0$5272003$5182004$8642005$1,092$1,120$9802006 2007 2008 2009Calendar YearTARGET: Annual savings <strong>of</strong> $1,000 million$1,006$1,3752010*$1,0972011$1,0002012**Why Did Performance Change?• Helped reduce delay by an estimated 33.56 millionvehicle-hours• Deployed 12 new Closed Circuit TV (CCTV) cameras,bringing the statewide total to 155• Responded to and cleared more than 17,000 incidentsand assisted more than 27,000 stranded motorists• Increased camera video feed interoperability withother regional agencies to allow for access to morethan 600 camera sites in <strong>Maryland</strong>• Completed several enhancements to the <strong>Maryland</strong>511 traveler information system, including drive timecalculations, email/text alerts and arterial traffic flowreports for the Eastern Shore• Added four new patrols on highways as a result<strong>of</strong> CHART’s partnership with State Farm InsuranceCompanyWhat Are Future PerformanceStrategies?• Expand the CHART patrol coverage to reduce roadwaydelays and achieve additional user cost savings• Explore cost-effective uses <strong>of</strong> limited resources throughlocal, regional and State incident managementcoordination and collaboration• Continue to explore agency partnerships for thesharing <strong>of</strong> camera information• Provide dynamic message boards to aid in thereduction <strong>of</strong> travel time, reduce congestion andprovide critical information for the traveling public($8.0 million programmed through FY<strong>2013</strong> in theFY<strong>2013</strong>–FY2018 CTP)Target: $1,000 million for <strong>2013</strong>.* 2010 data point was revised from the 2012 <strong>Report</strong>.** 2012 data is estimated.Goal: System Preservation & Performance27
28MTA: Passengers Per Revenue Vehicle MilePassengers per revenue vehicle mile, or service productivity, is a function <strong>of</strong> the frequency<strong>of</strong> service and total ridership, which are typically related. Growth in service productivity maybe restricted on certain modes by existing and planned service levels and capacity. Revenuevehicle miles are the miles traveled by transit vehicles while carrying paying passengers. Milestraveled to the first pick-up point, for example, are not considered to be in revenue service.passengers per revenue vehicle mileLOCAL BusLight RailBaltimoreMetroMARC5.04.03.02.01.00.05.04.03.02.01.00.05.04.03.02.01.00.05.02.50.04.220032.620032.920031.320034.220042.920042.720041.420043.720053.520052.720051.420053.920062.920062.820061.520064.020072.420072.820071.520074.320082.820082.720081.520084.420093.220092.620091.620093.520102.620103.020101.620103.620112.82011*3.02011*1.52011*4.220123.120123.020121.52012Why Did Performance Change?• More passengers are utilizing available transitservices as ridership continues to increase, therebyincreasing the number <strong>of</strong> riders served for everymile <strong>of</strong> bus service• Modified scheduled transit service to increasecapacity in high-demand areas• Purchased higher-capacity vehicles, includingarticulated buses and bi-level MARC cars• Continued efforts <strong>of</strong> the Bus Service AllocationTaskforce to determine patterns in Local Busridership and re-allocated or increased service tomeet those demands• Passengers per mile has increased on Local Busby 17% in FY2012 and ridership growth onCommuter Bus made significant progress withclose to 200,000 additional passenger tripsWhat Are Future PerformanceStrategies?• Continue to modify scheduled transit service toincrease capacity in high-demand areas• Continue purchases <strong>of</strong> higher-capacity vehicles,including articulated buses and bi-level MARC cars• Continue efforts <strong>of</strong> the Bus Service AllocationTaskforce to determine patterns in Local Busridership and re-allocate or increase service to meetthose demands• Expand capacity on the MARC system throughthe procurement <strong>of</strong> new rail cars ($153 millionprogrammed in FY<strong>2013</strong>–FY2018 CTP to procurenew rail cars and rehab existing rail cars)Goal: System Preservation & PerformanceContractedCommuterBus5.02.50.00.6 0.7 0.8 0.8 0.8 0.8 0.9 0.82003 2004 2005 2006 2007 2008 2009 2010Fiscal Year0.920111.02012*2011 data points were revised from the 2012 <strong>Report</strong> for Light Rail, Baltimore Metro and MARC.
MTA: Operating Cost Per Passenger TripTogether, the operating cost per passenger trip and operating cost per revenue vehicle mile arekey industry performance measures and show MTA’s ability to effectively and efficiently provideservice to passengers on various modes <strong>of</strong> travel.operating cost per passenger trip (2012 Dollars)LOCAL BusLightRailBaltimoreMetroMARCContractedCommuterBusParatransit&TaxiAccess$45.00$30.00$15.00$0.00$45.00$30.00$15.00$0.00$45.00$30.00$15.00$0.00$45.00$30.00$15.00$0.00$45.00$30.00$15.00$0.00$50.00$45.00$30.00$15.00$0.00$2.882003$5.972003$3.882003$11.592003$10.892003$31.492003$2.572004$6.772004$4.012004$12.032004$11.442004$39.312004$3.132005$8.252005$3.702005$11.692005$12.022005$45.892005$3.022006$6.942006$3.772006$11.432006$11.542006$46.062006$3.072007$6.562007$4.272007$11.392007$11.482007$43.662007$3.202008$5.032008$4.222008$12.682008$11.772008$42.062008Fiscal Year$3.152009$4.662009$4.212009$13.702009$10.662009$43.302009$4.092010$5.052010$4.202010$13.922010$10.852010$37.772010$4.082011$4.562011$4.092011$11.482011$6.472011$39.382011$4.152012$4.642012$4.172012$11.692012$6.582012$40.002012Why Did Performance Change?• Cost per trip increased by 1.8% (or $0.10 per trip)due to rising fuel costs, contract increases, generalinflation and labor agreements• Local Bus continues to be MTA’s most efficient wayto move passengers, with cost growth well in line orbelow historical trends• Light Rail’s cost per trip this year was higher thanlast, the costs are still well within or below historicaltrends• Controlled system costs while maintaining highlevels <strong>of</strong> service quality• Aggressively managed and audited <strong>of</strong> contractedservice providers to ensure 100% accuracy ininvoices and claims• MARC and Commuter Bus cost per trip increasedthis year, but increasing ridership and bettercontractual management have minimized costgrowth, which stayed below historical levelsWhat Are Future PerformanceStrategies?• Continue efforts to control system costs whilemaintaining high levels <strong>of</strong> service quality• Continue aggressive management and auditing<strong>of</strong> contracted service providers to ensure 100%accuracy in invoices and claims• Provide maximum transit capacity possible in areaswith the highest demand potential to provideincreased passenger trips without major systemexpansionsGoal: System Preservation & PerformanceTarget: Cost per passenger for Local Bus, Baltimore Metro and Light Rail toincrease at a rate no higher than the Consumer Price Index (CPI)** The CPI provides information about price changes in the national economy.29
30MTA: Operating Cost Per Revenue Vehicle Milecost per revenue vehicle mile (2012 Dollars)LOCAL BusLightRailBALTIMOREMetroMARCContractedCommuterBus$30.00$20.00$10.00$0.00$30.00$20.00$10.00$0.00$30.00$20.00$10.00$0.00$30.00$20.00$10.00$0.00$30.00$20.00$10.00$0.00$12.20 $10.89 $10.51 $11.78 $12.27 $13.652003 2004 2005 2006 2007 2008$15.54 $19.94 $28.66 $20.00 $15.79 $14.212003 2004 2005 2006 2007 2008$11.29 $11.24 $10.12 $10.39 $11.87 $11.332003 2004 2005 2006 2007 2008$15.31 $16.60 $16.30 $16.64 $17.10 $19.542003 2004 2005 2006 2007 2008$6.67 $8.05 $9.30 $8.66 $9.17 $9.802003 2004 2005 2006 2007 2008$13.702009$14.582009$10.882009$21.212009$9.492009$14.122010$12.962010$12.502010$22.482010$9.342010$14.492011$12.592011$12.172011$17.522011$5.942011$14.742012$12.822012$12.382012$17.832012$6.062012Why Did Performance Change?• Cost per mile increased by 1.8% (about $0.21)compared to FY2011• Operating cost increases were mainly driven byfuel, contract increases, general inflation and laboragreements• This rate <strong>of</strong> growth matches historical trendsWhat Are Future PerformanceStrategies?• Continue efforts to control system costs whilemaintaining high levels <strong>of</strong> service quality• Continue aggressive management and auditing<strong>of</strong> contracted service providers to ensure 100%accuracy in invoices and claims• Provide maximum transit capacity possible in areas<strong>of</strong> highest demand potential in order to provideincreased passenger trips without major systemexpansionsGoal: System Preservation & PerformanceParatransit&TaxiAccess$30.00$20.00$10.00$0.00$4.48 $5.83 $6.20 $5.36 $5.10 $5.15 $5.382003 2004 2005 2006 2007 2008 2009$5.392010$5.982011$6.082012Fiscal YearTarget: Cost per passenger for Local Bus, Baltimore Metro and Light Rail toincrease at a rate no higher than the Consumer Price Index (CPI)** The CPI provides information about price changes in the national economy.
MVA: MVA Cost Per Transaction*Cost per transaction is an indication <strong>of</strong> whether MVA business practices and programsare increasingly cost-effective through the employment <strong>of</strong> better technology andoperational practices.2012 Dollars**$20.00$18.00$16.00$14.00$12.00$10.00$8.00$6.00$4.00TARGET: $14.00 by 2012Why Did Performance Change?• MVA provides services for other agencies (e.g., centralcollection unit, E-ZPass ® sales, organ donor program,child support enforcement, insurance enforcement,voter registration, warrants and flags)• Increase in information technology investments andfacility infrastructure• Vehicle Emissions Inspection Program (VEIP) is nowfully operational with the cost per transaction reducedto just over $13• Number <strong>of</strong> transactions is growing slowly whilebudgets remain relatively unchanged, leading to asmall decrease in cost per transactionWhat Are Future Performance Strategies?• Continue to implement a new Strategic BusinessPlan, which highlights measures for attaining processefficiencies and managing costs• Revise the Long Range Plan that highlights visions andgoals for a future MVA that is more customer-oriented,efficient and technically advanced to meet the needs <strong>of</strong>MVA customers$2.00$15.99$15.11$14.44$13.72$14.08$13.41$13.47$14.15$13.58$13.27Goal: System Preservation & Performance$0.0020032004200520062007*Includes all transactions (e.g. licensing, registration, titling).** The historical cost per transaction data are adjusted for inflation.Percent <strong>of</strong> Transactions*50.0%45.0%40.0%35.0%30.0%25.0%20.0%15.0%10.0%5.0%0.0%24.2%200325.4%200427.4%200527.4%20082009Fiscal YearMVA: Alternative Service Delivery (ASD)Transactions as Percent <strong>of</strong> Total TransactionsAlternative services <strong>of</strong>fer the ability to provide fast and convenient service delivery tothe MVA customer. These transactions do not involve a walk-in interaction and requiredevelopment <strong>of</strong> new information technology systems and changes in customer behavior,which may be <strong>of</strong>fset by new legislation and programs that require a walk-in transaction.28.9%29.2%29.8%2006 2007 2008 2009Fiscal Year201031.8%20102011TARGET: 40% by 201233.7%2011201238.7%2012Why Did Performance Change?• Continued to identify and <strong>of</strong>fer new ASD options,including self-service kiosks, central scheduling, emailcollection, website re-design, and creative marketing,increasing customer usage from 33.7% in FY2011 to38.7% in FY2012What Are Future Performance Strategies?• Send vehicle registration renewal notices to customersby email to reduce mailing costs, improve efficiency andenhance customer convenience• Continue to promote and implement ASD services,encouraging Identification (ID) card and driver’s licenserenewals (for individuals less than 40 years <strong>of</strong> age) bymail, kiosks and web• Continue redesigning the MVA website to improvecustomer service31* The number <strong>of</strong> transactions includes the number <strong>of</strong> vehicles tested at VEIP stations, and excludes driver andvehicle Direct Access Records (DARS).
32MAA: Airline Cost Per Enplaned Passenger (CPE)Airline cost and non-airline revenue measures allow BWI Marshall to remain competitive in aregion that is unique because it has four proximate airports.2012 Dollars***$18.00$16.00$14.00$12.00$10.00$8.00$6.00$4.00$2.00$0.00$10.06$7.272005$9.83$7.03$10.16$7.40$10.75$8.29$12.38$9.97$13.93$9.822006 2007 2008 2009 2010 2011Fiscal YearComparable airportsBWI Marshall CPECPE mean amountTARGET: BWI Marshall CPE below the mean CPE <strong>of</strong>comparable airports***2012 comparable airports CPE mean amount is preliminary.** Comparable airports are defined as Washington Reagan National, Washington DullesInternational and Philadelphia International.*** The cost per passenger data are adjusted for inflation.$15.42$9.35$15.49*$9.292012Why Did Performance Change?• The CPE at BWI Marshall continues to be thelowest in the mid-Atlantic region and be wellbelow the mean <strong>of</strong> comparable airports• BWI Marshall continues to compare favorablywith its peer airports on non-airline revenue perenplaned passenger (RPE)What Are Future PerformanceStrategies?• Continue strategies to increase parking revenues• Continue to closely monitor all airport costs to keepBWI Marshall rates competitive with other regionalairports• Continue to review the cost effectiveness <strong>of</strong> capitalprojects before moving forward with design andconstruction• Enhance the existing retail, food and beverageconcession in terminals by adding recognized localand new national conceptsGoal: System Preservation & PerformanceMAA: Non-Airline Revenue Per EnplanedPassenger (RPE)*$14.00$12.00$10.20$10.65$11.47$12.14$10.30$11.36$11.002012 Dollars***$10.00$8.00$6.00$4.00$2.00$9.39$9.91$10.21$10.89$10.77$10.56$10.50$10.13$0.00200520062007 2008 2009 2010Fiscal YearBWI Marshallnon-airline RPE2011Comparable airports nonairlineRPE mean amount2012TARGET: BWI Marshall non-airline RPE to be at or above themean <strong>of</strong> comparable airports*** RPE is based on non-airline revenue (e.g., parking, concessions and ground transportation).** Comparable airports are defined as Washington Reagan National, Washington DullesInternational and Philadelphia International. 2012 data is not available for Comparable airports.*** The cost per passenger data are adjusted for inflation.
Goal: System Preservation & PerformanceMPA: Adequate Dredge Material Placement CapacityRemaining for Harbor and Bay Maintenance and NewWork DredgingMPA is responsible for obtaining dredged material placement sites.Adequate Annual CapacityRemaining for maintenance and newwork dredging (Years)7.06.05.04.03.02.01.00.05.020046.04.0 5.0 3.5 4.0 2.5 3.0 1.5 2.02005 2006 2007 2008 2009Fiscal YearHarbor MaterialTARGET: Bay and Harbor Material Capacity: 20 years0.51.02010* 2011Bay Material*Adequate capacity did not exist for both maintenance and new projects without overloading placement in FY2010.2.020121.0Why Did Performance Change?• Capacity at placement sites is beingconsumed faster than new capacity can bebrought online. In 2012, only maintenancedredging <strong>of</strong> Harbor channels can beaccommodated without overloading existingplacement sites. New dredging work forchannel improvement in the Harbor is notbeing considered at this time• On average, there is 1.0 million cubic yards(mcy)/year <strong>of</strong> Harbor maintenance dredgingand 0.5 mcy/year <strong>of</strong> new work dredging inthe Harbor to make improvements to thechannel system• Supported <strong>Maryland</strong>’s Dredged MaterialManagement Program and the U.S. ArmyCorps <strong>of</strong> Engineers’ Mid-Chesapeake BayIsland feasibility studies• Maintained efforts to ensure deep channelaccess to the PortWhat Are Future PerformanceStrategies?• Continue to develop and package appropriatecommunications materials (e.g. hand-outs, factsheets, talking points) for public disseminationto help illustrate the prioritization process andultimate recommendations for placement sitesand options• Work with the U.S. Army Corps <strong>of</strong> Engineersand elected <strong>of</strong>ficials to ensure the Chesapeake& Delaware (C&D) Canal is properlymaintained to the authorized depth• Continue with a strategic communication planfor the dredge material placement process• Assist, where possible, to reactivate placementsites at Courthouse Point and Peace Creek toprovide additional capacity• Continue to evaluate innovative reuse <strong>of</strong>dredge material• The FY<strong>2013</strong>-2018 CTP includes $427 millionto implement the Governor’s Strategic Plan forDredge Material Management, which will helpmaintain shipping channels• Continue process to resolve scheduling, legaland community enhancement issues forpotential Harbor placement option, i.e. CokePoint Dredged Material Containment Facility(DMCF)Dredging took place in the InnerHarbor to prepare for the War <strong>of</strong> 1812Bicentennial celebration33
34MPA: Revenue Versus Operating ExpenseRevenues are an important measure <strong>of</strong> business activity at the MPA terminals. MPA’s operating expenses are recovered by revenues generated.2012 Dollars (Millions)**$120.0$2.9$3.3$2.9$2.7$5.2$4.9$100.0$80.0$60.0$40.0TARGET: Revenue > Operating Budget$5.8$4.3$4.9$4.2Goal: System Preservation & Performance$20.0$111.4$114.2$112.1$115.4$110.4$113.9$103.8$106.3$105.1$104.8$103.6$107.0$98.3$100.4$72.5$67.1$50.0$40.4$55.9$37.4$0.0200320042005200620072008Fiscal Year20092010***2011***2012***RevenueExpensesExclusions** Exclusions include: MDTA lease payments for Masonville terminal, Certificate <strong>of</strong> Participation (COPs) for M-real facility and MPA operating costs for new/replacement equipment.** The revenue and operating data is adjusted for inflation.***Revenues and Expenses dropped in FY2010 and later due to the public-private partnership agreement with Ports America Chesapeake, in which the MPA no longer operates Seagirt Marine Terminal.Why Did Performance Change?• The MPA nearly doubled its net operating income <strong>of</strong> $18.5 million forFY2012 which included a one-time payment <strong>of</strong> $5.7 million from acustomer whose lease ended without fulfilling their minimum guarantee• MPA’s billable cargo tonnage exceeded prior fiscal year volumes by 10%, aswell as FY2012’s budgeted expectations• Cruise ship passenger volumes exceeded projected expectations for FY2012with 484,750 passengers sailing on 106 cruises• The MPA won an advertising award in the American Association <strong>of</strong> PortAuthorities (AAPA) Communications Awards Program for an ad thathighlighted the construction <strong>of</strong> a new 50-foot deep container berth and theinstallation <strong>of</strong> four super post panama cranes• MPA successfully controlled operating expenditures and maximizedrevenues throughout FY2012What Are Future Performance Strategies?• Attract and retain sufficient cargo volumes to provide future revenue growth• Continue to improve MPA financial systems and reporting techniques• Maintain efficient and effective contract management and internalproject delivery• Continue efforts to increase World Trade Center occupancy• Continue to develop business synergies with public-private partner, PortsAmerica Chesapeake, to maximize container volumes through SeagirtMarine Terminal• Continue promoting the Port as a convenient location for year-roundcruising• Continue the partnership with existing cruise lines and develop newopportunities for additional cruise lines to come to Baltimore
Goal:EnvironmentalStewardshipObjectives• Coordinate land use and transportation planning tobetter promote Smart Growth• Preserve and enhance <strong>Maryland</strong>’s natural, communityand historic resources• Support initiatives that further our commitments toenvironmental quality<strong>Maryland</strong>’s transportation agencies organize internal operation throughenvironmental and energy management systems and prioritize investmentsto promote good stewardship <strong>of</strong> <strong>Maryland</strong>’s environment while keepingour people and our economy moving. Approaches include using recycledmaterials in construction, actively managing stormwater from transportationfacilities, and <strong>of</strong>fering incentives for truck fleet owners to replace older, morepolluting vehicles.MDOT is a critical partner with all State agencies in implementing strategiesthat will reduce pollutant loads in all waters that drain to the ChesapeakeBay. MDOT is working with SHA and MDTA to implement planning processes,develop design criteria, and construct stormwater controls and alternativewater quality improvement strategies in order to meet the U.S. EnvironmentalProtection Agency’s (U.S. EPA) Chesapeake Bay Total Maximum Daily Load(TMDL) requirements by the year 2025.Performance MeasuresMonitoringAgencyPerformanceMeasurePageMDOT <strong>Transportation</strong>-related emissions by region 38MDOTMDOT & MTAMPAMVASHA<strong>Transportation</strong>-related greenhouse gasemissions<strong>Transportation</strong> Emission ReductionMeasures (TERMs)Acres <strong>of</strong> wetlands or wildlife habitatcreated, restored, or improved since2000Compliance rate and number <strong>of</strong> vehiclestested for Vehicle Emissions InspectionProgram (VEIP) versus customer waittimeAcres <strong>of</strong> wetlands restored and miles <strong>of</strong>streams restoredSHA Total fuel usage <strong>of</strong> the light fleet 40SHA & MTA Travel Demand Management 40-413942373837MDOT is an implementation partner in Governor O’Malley’s Smart,Green & Growing initiative. MDOT plays an important role in shapingand implementing many key Smart, Green & Growing initiatives, frompromoting more compact development including Transit-OrientedDevelopment (TOD), to enhancing transit and bike and pedestrian facilities,and providing improved opportunities for ridesharing, teleworking, andother commuter options. MDOT also plays a key role in the State’s mitigation<strong>of</strong> greenhouse gas (GHG) emissions and response to the threats <strong>of</strong> globalclimate change in developing the <strong>Maryland</strong> Climate Action Plan.MTA is continuing to replace its bus fleet with diesel-hybrid vehicles that willreduce overall fuel consumption and emissions. MPA and MAA both haveenvironmental management systems in place to help achieve full compliancewith environmental regulations. MDOT is working with multiple Stateagencies and private stakeholders through the Electric Vehicle InfrastructureCouncil to develop a plan to place <strong>Maryland</strong> in an ideal position to becomea strong market for electric vehicles. MVA’s Vehicle Emissions InspectionProgram (VEIP), conducts regular vehicle emissions inspections and educates<strong>Maryland</strong>ers on maintaining our vehicles for clean air, public health andimproved water quality in the Chesapeake Bay.35
36Key InitiativesMDOT:MAA:MPA:MTA:• Smart, Green & Growing: Implement the Bikeways Programand Bikeshare Program to facilitate bicycling as a transportationoption in support <strong>of</strong> Cycle <strong>Maryland</strong> and the Smart, Green &Growing initiative.• Chesapeake Bay Restoration: Facilitate MDOT ModalAdministration and Authority information sharing on processesand strategies for managing stormwater run<strong>of</strong>f from all MDOTinfrastructure to help meet the Chesapeake Bay pollution budget.• Improve Air Quality: Participate in multi-state discussions ondeveloping a regional network <strong>of</strong> electric vehicle charging stationsand continue to work with the <strong>Maryland</strong> Energy Administrationand the Electric Vehicle Infrastructure Council to plan for and fundthe deployment <strong>of</strong> charging stations.• The <strong>Maryland</strong> Environmental Noise Act: Provides for the protection<strong>of</strong> citizens from the impact <strong>of</strong> transportation-related noise. Theaviation portion <strong>of</strong> the Act requires the MAA to adopt an AirportNoise Zone (ANZ) and Noise Abatement Plan to identify and tryto reduce impacted land use areas around the airport. This isachieved by MAA controlling the development <strong>of</strong> property insidethe ANZ and prohibiting incompatible land uses such as homes,schools nursing homes, etc. The Noise Abatement Plan establishesarrival and departure procedures aimed to reduce impacted landuse areas around the airport.• The Voluntary Residential Property Acquisition Program whichfacilitates the purchase <strong>of</strong> noise impacted residential properties,and the Homeowner Assistance Programs, which fundsnoise mitigation projects for residents, are both part <strong>of</strong> theFederal Aviation Regulation Part 150 Program and are 80%federally-funded.• Stormwater Best Management Practices (BMPs): MAA continuesto focus on stormwater management through the implementation<strong>of</strong> the <strong>Maryland</strong> <strong>Department</strong> <strong>of</strong> the Environment’s StormwaterRegulations <strong>of</strong> 2009 (<strong>Maryland</strong> Stormwater Act <strong>of</strong> 2007) for bothairport and tenant projects at BWI Marshall.• Air Quality: Enhanced the Mid-Atlantic Dray Truck ReplacementProgram, providing $20,000 each toward the cost <strong>of</strong> a newer draytruck that meets or exceeds the 2007 U.S. EPA certified engineemission standard.• Air Quality: Installed four container cranes, which can lift 187,300pounds <strong>of</strong> cargo and are fully electric, emitting no diesel emissions.• Air Quality: Increased the number <strong>of</strong> hybrid diesel electric busesin the MTA fleet with the purchase <strong>of</strong> 57 new buses. Oncepurchased, 40% <strong>of</strong> the bus fleet will be hybrid diesel electricbuses. In the FY<strong>2013</strong>-FY2018 Consolidated <strong>Transportation</strong> Plan(CTP), 63 new hybrid buses are planned for purchase in FY<strong>2013</strong>.• Air Quality: Created three new commuter bus routes to <strong>of</strong>fer atotal <strong>of</strong> five routes along the Intercounty Connector (ICC) corridor,providing <strong>Maryland</strong> residents with an alternative to driving. Thecommuter buses provide access to jobs while reducing gasolineconsumption and negative impacts on the environment.• Energy Consumption: In 2011 a massive project to replace electricfixtures and bulbs with greener, more energy-efficient componentswas undertaken in 54 different MTA locations. MTA continues toupgrade lighting throughout the system, resulting in anticipatedenergy savings <strong>of</strong> over $434,000 per year.MDTA:MVA:SHA:• Manage Stormwater BMPs by inventorying all practices, such asearly coordination on inventory <strong>of</strong> BMPs from mega projects likethe ICC and I-95 Section 100 Express Toll Lanes (ETLs) as well asupcoming Chesapeake Bay restoration retr<strong>of</strong>its.• Maintain Recycling Programs: The combined efforts <strong>of</strong> MDTA<strong>of</strong>fice staff and maintenance/automotive personnel have resultedin the recycling <strong>of</strong> 1,212.03 tons <strong>of</strong> materials in CY2011.• Chesapeake Bay Restoration: To address EPA’s Bay Restorationgoals, MDTA is completing and refining an inventory <strong>of</strong> imperviousareas, investigating innovative approaches to implementstormwater retr<strong>of</strong>its, and designing and constructing stormwaterretr<strong>of</strong>its along MDTA highways.• Environmental Management: MDTA continues the development <strong>of</strong>environmental Standard Operating Procedures for the Division <strong>of</strong>Operations to ensure that environmental issues are managed in aconsistent and cost effective manner throughout the MDTA.• Energy Management: MVA participated in an independentenergy audit that established a baseline <strong>of</strong> energy consumptionat MVA facilities and identified new innovative ideas for energymanagement.• Environmental Management: MVA is implementing a ComplianceFocused Environmental Management System (CFEMS) to betterincorporate environmental considerations into business practices(by 2016).• Improve Air Quality: MVA is continuing to enhance the provision<strong>of</strong> Internet-based services to avoid unnecessary vehicle trips. MVAis also developing new technologies and services to facilitatevehicle emissions testing as well as new regulations to ensurecompliance with State emissions testing mandates.• MVA Facilities Maintenance and Engineering (FME) has takenan aggressive approach <strong>of</strong> reducing its energy, fuel and waterconsumption while simultaneously reducing MVA’s carbonfootprint by utilizing various devices such as T5 light fixtures, lowwater flush toilets, solar light pole, installation <strong>of</strong> sensor flushvalues, sensor / motion wall and ceiling mounted occupancysensors, Variable Frequency Drives (VFD’S), high efficiency motors,fans, and pumps, installation <strong>of</strong> compact florescent lights (CFL’s),and installation <strong>of</strong> LED exit signs, light and bulbs fixtures.• Chesapeake Bay Restoration: SHA made significant progresstowards the <strong>2013</strong> milestone established in the WatershedImplementation Plan by meeting all interim pollutant reductiongoals established for FY2012. SHA continues to develop effectivestrategies and seek implementation project opportunities thatextend the resources required to meet the <strong>2013</strong> milestone goals.• Recycled Materials: SHA continues to partner with industry andenvironmental agencies to maintain quality and safety whileincreasing the use <strong>of</strong> recycled materials in highway construction. InCY2011, 30,109 tons <strong>of</strong> reclaimed concrete aggregate were usedto replace virgin aggregate, and 13% <strong>of</strong> all hot mix pavementplaced on State roadways was recycled asphalt pavement.• Tree Planting: SHA continues to be a key partner in <strong>Maryland</strong>’stree planting initiative and is involved in the American ChestnutTree Restoration project, located in Carroll County, and thePartnership Planting Program where SHA helps volunteers findsafe locations along roadways to plant trees. Each year, SHAundertakes tree planting programs along highway medians, grassyareas, or interchanges throughout the state.Goal: Environmental Stewardship
SHA: Acres <strong>of</strong> Wetlands Restoredand Miles <strong>of</strong> Streams RestoredSHA’s wetland and stream restoration activities have exceeded regulatoryrequirements. These wetland and stream restoration activities help compensatefor prior damage to these sensitive ecosystems, caused in part by roadwayconstruction. Wetland and stream restoration is also a key stormwater run<strong>of</strong>fmanagement strategy, helping to improve the water quality <strong>of</strong> our rivers, lakesand bays without the installation <strong>of</strong> costly treatment infrastructure. SHA’songoing wetland and stream restoration efforts will now focus on ChesapeakeBay water quality needs.Why Did Performance Change?• Completed the final 34.6 acres <strong>of</strong> stewardship wetlands creation by the close<strong>of</strong> FY2012, thereby meeting SHA’s 200 acres goal• A total <strong>of</strong> 5.7 miles <strong>of</strong> stream restoration was completed by the close <strong>of</strong>FY2011 to exceed SHA’s environmental stewardship goal <strong>of</strong> five milesAcres <strong>of</strong> Wetlands220200180160140120100806040TARGET: 200 acres <strong>of</strong>wetlands by 2012505068157 157165200TARGET: 5 miles <strong>of</strong>streams by 201110.009.008.007.006.005.004.003.002.00Miles <strong>of</strong> Streams• New regulations for the restoration <strong>of</strong> Chesapeake Bay ensure all resourcesare being devoted to compliance goals for TMDL standards201.00What Are Future Performance Strategies?• Support restoration <strong>of</strong> the Chesapeake Bay and compliance with TMDLstandards ($138.2 million in the FY<strong>2013</strong>–FY2018 CTP for planning,design, and construction <strong>of</strong> stormwater controls and alternative waterquality improvement strategies)• As resources allow, SHA will continue to look for opportunities to enhancethe environment through cost-effective solutions• Continue to provide environmental stewardship by supporting communitybasedlandscape enhancement projects and tree planting through itsPartnership Planting Program020060.63.94.72007 2008 2009 2010 2011Fiscal YearMiles <strong>of</strong> streams restoredbeyond project mitigationrequirements* Streams goal achieved in 2011.4.75.72012*0.00Acres <strong>of</strong> wetlands restored beyondproject mitigation requirementsMPA: Acres <strong>of</strong> Wetlands or WildlifeHabitat Created, Restored, orImproved Since 2000*2,0001,8001,6001,7911,7851,7042010**2009**MPA is in compliance with the various permits that are granted to constructprojects needed for MPA customers (e.g., landside tenants or steamship lines).1,4001,68520062004Goal: Environmental Stewardship37Why Did Performance Change?• Mitigation activities in FY2012 were directed toward schoolyard greeninginstead <strong>of</strong> undertaking new wildlife habitat improvementsWhat Are Future Performance Strategies?• Create and improve wildlife habitat to conform to permit requirementsfor construction projects requiring mitigation• Continue Masonville eastern and peninsula uplands environmentalimprovement projects, which are noteworthy examples <strong>of</strong> coordinatingwith neighboring communities’ needs which allows MPA to maintainits social license to operate• Continue efforts to restore the Hart-Miller Island North Cell anddevelop Poplar Island ExpansionAcres1,2001,00080060040020001,374640Calendar YearTARGET: Mitigate projects as required by Federal, Stateand local statutes20022001* Represents cumulative mitigation efforts by MPA. New data not available forthis chart in FY2011 or FY2012 per the performance bullet.** Data were revised from 2012 <strong>Report</strong>.
38MVA: Compliance Rate and Number <strong>of</strong> VehiclesTested for Vehicle Emissions Inspection Program(VEIP) Versus Customer Wait Time*Monitoring the VEIP testing compliance rate ensures system effectiveness and identifies vehicles exceedingallowable standards. Tracking the average wait time at VEIP stations ensures that the 15-minute averagewait time requirement is met. Timely and efficient customer service helps the State meet Federal clean airstandards by identifying polluting vehicles and encouraging regular vehicle maintenance.Minutes/Compliance Rate (%)10.0/100%8.0/80%6.0/60%4.0/40%2.0/20%0.0/0%TARGET: 98% compliance rate97%92% 94%2005 2006 2007 2008 2009 2010 2011Fiscal YearAverage customer wait timeat VEIP station in minutes88%89% 90% 90%4.2 1,470 4.5 1,530 4.4 1,513 5.0 1,639 5.0 1,607 4.9 1,163 4.3 1,697Number <strong>of</strong> vehiclestested at VEIPTARGET: Maintain waittime
MDOT: <strong>Transportation</strong>-Related GreenhouseGas EmissionsA reduction in the growth <strong>of</strong> overall Vehicle Miles <strong>of</strong> Travel (VMT) is one <strong>of</strong> several strategiesthat MDOT is pursuing to address climate change through mitigation <strong>of</strong> GHG emissions.Reducing VMT through providing transportation alternatives has other potential benefitsto <strong>Maryland</strong>ers, such as reduced congestion, reduced travel costs and improved travel timereliability. Other strategies include providing alternatives to SOV travel and transitioning to aless carbon intensive vehicle fleet and lower carbon fuels.MDOT Climate Change PlanningMDOT and its modal agencies are continuing to refine GHG reduction strategiesthrough development <strong>of</strong> the <strong>Maryland</strong> Climate Action Plan, as required by theGreenhouse Gas Reduction Act (GGRA) <strong>of</strong> 2009. These strategies are documented inthe MDOT 2012 Implementation Plan, released in April 2011, and the 2011 GGRAPlan, released in June 2012.MDOT’s planning activities for the transportation sector have resulted in the followingfindings:• In 2006, the transportation sector, including emissions from all on-road and <strong>of</strong>froadsources represents 33% <strong>of</strong> GHG emissions in <strong>Maryland</strong> (equaling 35.5 millionmetric tons (mmt))*• MDOT programs included in the CTP and in MPO long-range transportation planswill achieve a 7% reduction in GHG emissions in 2020. Approximately 50% <strong>of</strong> theexpenditures planned in the CTP provide GHG emission benefits• The combination <strong>of</strong> GHG-reduction strategies focusing on clean fuels and Federalfuel economy standards, including the 2017-2025 Fuel Efficiency standard finalizedby the Obama Administration in August 2012, will result in a 21% reduction in GHGemissions in 2020• MDOT programs plus the GHG reduction from clean fuels and Federal fuel economystandards in total reduce emissions by 11.7 mmt, a reduction <strong>of</strong> 8% from 2006emissions by 2020• The most effective GHG reduction strategies are those implemented at a regional ornational level such as Federal fuel economy standards and clean fuel standards* All GHG emissions are calculated using EPA’s MOVES2010a emissions model.MDOT has also identified other feasible but unfunded GHG-reductions strategiesthat could help the transportation sector account for up to 33% <strong>of</strong> the state’s GHGreductions by 2020. These total reductions would significantly assist <strong>Maryland</strong> inachieving the 2020 target <strong>of</strong> 25% below 2006 emissions.What Are Future Performance Strategies?• Continue to develop processes to include climatechange mitigation and adaptation considerationsinto project selection, design, maintenance,operations, construction and emergency response• The SHA Climate Adaptation Team plans to completea detailed sea level rise vulnerability assessment<strong>of</strong> <strong>Maryland</strong>’s highway system and supportinginfrastructure followed by initiating pilot studies• Encourage continued growth in transit ridershipthrough ongoing system enhancements, expansion,and outreach combined with continued support andimplementation <strong>of</strong> TOD projects• Continue to work with the <strong>Transportation</strong> andClimate Initiative (TCI) to work with neighboringstates to install a regional network <strong>of</strong> electric vehiclecharging stations across the Mid-Atlantic as well asother GHG mitigation strategies• Continue to reduce GHG emissions from SHA’svehicle fleet by increasing usage <strong>of</strong> alternative fuels• Continue MTA’s green bus fleet expansion with therecent addition <strong>of</strong> 57 new hybrid buses in FY2012and the planned purchase <strong>of</strong> 63 more hybrid busesin FY<strong>2013</strong> (the FY<strong>2013</strong>–FY2018 CTP identifies$224.8 million in diesel/hybrid bus replacementsover the next six years)• MDOT is the Chair <strong>of</strong> the <strong>Maryland</strong> Electric VehicleInfrastructure Council (EVIC) formed in 2011 t<strong>of</strong>ormulate an action plan to successfully integrateelectric vehicles into the State’s transportationnetwork. The EVIC’s recommended goal is to have60 thousand plug in electric vehicles registeredin <strong>Maryland</strong> by 2020. The EVIC submitted itsfinal report to the Governor in December 2012that outlined the challenges and key steps todeveloping an electric vehicle market and supportinginfrastructure in <strong>Maryland</strong>. MDOT will continueto work with multiple State agencies and privatepartners to implement recommendations <strong>of</strong> EVIC• As part <strong>of</strong> the Annual <strong>Attainment</strong> <strong>Report</strong>, MDOTwill conduct an annual analysis <strong>of</strong> on-road GHGemissions in <strong>Maryland</strong> in order to inform the publicon progressGoal: Environmental StewardshipIn addition, SHA has established goals to identify vulnerable infrastructure and developrisk assessments for short- and long-term investments to protect coastal communities,environmental assets, and infrastructure from the potential impacts <strong>of</strong> climate changeinducedstorm surges and sea-level rise.39
40SHA: Total Fuel Usage <strong>of</strong> theLight FleetThis measure is tracked statewide to monitor success in reducing consumption<strong>of</strong> gasoline through conservation strategies, including use <strong>of</strong> higher fuelefficiency vehicles for scheduled fleet replacements.Gallons1,000,000900,000800,000700,000600,000500,000931,1772005889,4452006857,1742007838,1752008816,1632009Fiscal YearTARGET: 730,000 gallonsor fewer by 2015751,2042010709,5142011734,2162012Why Did Performance Change?• Continued to enforce automobile engine-idling policy for allemployees and consultants, and encouraged employees to save fuelthrough carpooling and videoconferencing for State business trips• Constructed an E-85 distribution facility at the SHA HanoverComplex and employee outreach is being conducted to encourageuse <strong>of</strong> other existing and planned E-85 fueling stations at <strong>Maryland</strong>State Police (MSP) facilities• Purchased three new hybrid SUVs to replace conventionalgasoline SUVs• Replaced 15 three-quarter ton pickup trucks utilizing diesel fuel withflex-fuel vehicles with the same hauling and towing capacity• SHA fuel usage has continued to decrease over the last seven years;SHA has evolved its fleet to maximize efficiencies as allowable andhas reached a plateau in use reduction and fuel efficiencyWhat Are Future Performance Strategies?• Investigate opportunities to expand fueling locations for E-85fuel and encourage drivers <strong>of</strong> flex-fueled SHA vehicles to fuel upwith E-85 gas when practical• Continue to look for opportunities to institute fleet reductions tocut overall fuel consumption• Continue to replace older diesel pickup trucks with flex-fueledpickup trucks <strong>of</strong> similar hauling and towing capacity, and reducethe SUV fleet by replacing some with smaller mid-size pickups infuture budgetsGoal: Environmental StewardshipSHA: Reduction in Vehicle MilesTraveled Through Park-and-Ride UsageBy <strong>of</strong>fering park-and-ride facilities, SHA provides commuters with an alternative todriving to their destinations and helps increase public transit ridership.Miles (Millions)120.0110.0100.090.080.070.060.050.095.22005*2012 data is preliminary.104.02006102.0110.9102.02007 2008 2009Fiscal YearTARGET: 109 million by <strong>2013</strong>100.02010106.02011108.02012*Why Did Performance Change?• Statewide, park-and-ride lots are at an estimated 57%capacity, which is slightly below the historical average (parkand-rideusage fluctuates in response to changes in gasprices)• An additional 490 spaces were funded for constructionWhat Are Future Performance Strategies?• By <strong>2013</strong>, SHA will complete 490 additional spaces, andwill complete design <strong>of</strong> 500 additional park-and-ridespaces for FY<strong>2013</strong>-FY2014• Investigate how to bolster capacity at single deckparking structures at over-capacity park-and-ridefacilities, without increasing stormwater run<strong>of</strong>f• Continue to deploy Electric Vehicle (EV) charging posts atpark-and-ride lots• Continue to look for opportunities to construct park-andridelots while planning major highway projects alonginterstates and principal arterials• Continue to explore the adaptation <strong>of</strong> park-and-ride lotsalong freight corridors to allow long-haul trucks to parkovernight
Travel Demand Management<strong>Maryland</strong>’s transportation agencies promote Travel Demand Management (TDM) strategies as a way to combat congestion by <strong>of</strong>fering incentivesfor <strong>Maryland</strong>ers to choose to use public transit, carpool, ride a bike or walk instead <strong>of</strong> driving alone. Other strategies to reduce demand forroadways include promotion <strong>of</strong> telecommuting and flexible work hours as a way to reduce or shift trips to times when roadway capacity is lessconstrained. <strong>Maryland</strong> supports a wide variety <strong>of</strong> programs and projects to promote TDM, including Commuter Choice <strong>Maryland</strong>, CommuterConnections, the Telework Partnership, TOD and statewide park-and-ride facilities. Park-and-ride facilities provide connections to transit,carpooling and other shared modes, helping to lower single-occupancy driving. By cutting down on single-occupant vehicle trips and reducingpeak period congestion, TDM contributes to reduced emissions and improved air quality.Statewide Park-and-Ride FacilitiesAgencyTotal SpacesAverageWeekdayUtilization*SHA (2012)* (Estimated) 12,524 7,185MTA Operated (2012) 29,542 18,507Transit Multipurpose**(2012) (Estimated)19,959 9,616* Facility usage fluctuates due to the economy; weather conditions; special events; emergencies; delaysor shutdowns <strong>of</strong> parallel lines or modes; maintenance and repair; storage <strong>of</strong> plowed snow; increases infrequency, service, and capacity; and other factors.** Includes facilities operated by MTA, Amtrak, WMATA, Penn Station in Baltimore and Union Stationin Washington, D.C.Goal: Environmental Stewardship41
422009-2010 MDOT & MTA TRANSPORTATION EMISSION REDUCTION MEASURES (TERMs)ProgramGuaranteed Ride HomeEmployer Outreach (IncludingEmployer Outreach forBicycles)Integrated RideshareProgram DescriptionProvides transit users or carpoolers up to four rides home per yearin a taxi or rental car in the event <strong>of</strong> an unexpected personal orfamily emergencySupports marketing efforts to increase employee awareness anduse <strong>of</strong> alternatives to driving alone to work every dayPromotes other alternative transportation services to employersand to the general public. Commuter information systemdocumentation is provided with comprehensive commuteinformation, to include regional TDM s<strong>of</strong>tware updates, transit,telework, park-and-ride and interactive mappingDaily Reductionin Vehicle Trips7,983 208,34690,350 1,657,8091,717 51,569Daily Reductionin Vehicle Miles<strong>of</strong> Travel*Goal: Environmental StewardshipCommuter Operations andRidesharing CenterTelework Resource CenterMass MarketingMTA College PassMTA Commuter Choice<strong>Maryland</strong> PassTransit Store in BaltimoreUpdates and maintains the Commuter Connections database forride-matching services and provides information on carpooling,transit, Guaranteed Ride Home services and alternative modechoices for the Washington-Baltimore metropolitan regionProvides information to employers on the benefits <strong>of</strong> telecommutingand assists in setting up new or expanded telework programs foremployersPromotes and communicates the benefits <strong>of</strong> alternative commutemethods to single-occupant vehicle commuters through the mediaand other wide-reach communicationsOffers a subsidized monthly transit pass to full- or part-timestudents enrolled in greater Baltimore metropolitan area collegesor universitiesBaltimore region program that allows employers to purchase transitpasses and vouchers for their employees. Employers can subsidizethese for their employees or allow employees to purchase passes orvouchers with pre-tax incomeProvides customer access to transit information and for purchases<strong>of</strong> transit passes. Some 15-20% <strong>of</strong> total transit pass sales occurthrough this outlet6,190 180,40912,499 241,8346,922 78,2974,494 35,0009,220 155,5413,308 55,808* The impacts shown reflect the current definitions and most recent data available for each <strong>of</strong> the measures.
Goal:Connectivity forDaily LifeObjectives• Provide balanced, seamless and accessible multimodaltransportation options for people and goods• Facilitate linkages within and beyond <strong>Maryland</strong> tosupport a healthy economy• Strategically expand network capacity to managegrowth<strong>Maryland</strong>’s integrated, multimodal transportation system provides efficient andseamless connectivity for people and goods between local, regional, nationaland international economies. Much effort has been put into planning and/orconstructing infrastructure that allows visitors and residents to travel by bicycle,on foot, or by transit. A number <strong>of</strong> the Bikeways Program Grants awarded this yearfund projects that help riders connect to activity centers. For example, the City <strong>of</strong>Brunswick’s bike route will connect the Chesapeake & Ohio (C&O) Canal Trail, theMARC train station and Main Street. Funding has also been secured to constructa new trail segment, linking a 60 mile-network <strong>of</strong> bicycle and pedestrian trailsbetween the District <strong>of</strong> Columbia and <strong>Maryland</strong>. Progress is being made acrossthe 15 designated Transit-Oriented Development (TOD) sites in <strong>Maryland</strong> includingcompletion <strong>of</strong> Phase I at the Twinbrook Metrorail Station, and ongoing constructionat Owings Mills, Westport, Reisterstown Plaza, and White Flint.Efficiently connecting visitors and residents to different parts <strong>of</strong> the state byautomobile is also a top priority. Construction projects on heavily traveled routes, toease congestion and delay, are underway. For example, to alleviate the congestionfrom the Branch Avenue Metro Station, which increased traffic volumes on MD 5and the Capital Beltway in the vicinity <strong>of</strong> the station during peak periods, the Stateis constructing improvements to the access road, pedestrian bridge and the countyroads. Pedestrian/bicycle facilities will be included where appropriate.At the national and international level, the Port <strong>of</strong> Baltimore continues to supportand provide transportation linkages and encourage economic growth. During thefirst six months <strong>of</strong> 2012, the MPA terminals handled a record 4.83 million tons <strong>of</strong>general cargo. For the Port public and private terminals, 2012 is expected to be anear-record year for foreign waterborne cargo, at about 38 million tons, supportingover 40,000 jobs. BWI Marshall also continues to provide national and internationalaccess to <strong>Maryland</strong>, flying approximately 22.8 million commercial passengersthrough the airport in 2012.Key InitiativesMDOT: Continue to administer the Bikeways Program Grants, which provide localjurisdictions funds to initiate planning activities and/or the design andconstruction <strong>of</strong> projects that create and improve bicycle connections in<strong>Maryland</strong> to key destinations.MAA: Support passenger traffic growth and new nonstop flights at BWI Marshallwith the ongoing major terminal enhancement program, continuedexcellent customer service, and continued marketing <strong>of</strong> BWI Marshall asa convenient gateway for travelers to and from the Washington-Baltimoreregion.MPA: Execute $12 million in capital funds (state and federal) to improve securityinfrastructure on MPA terminals.MTA: Construct neighborhood-friendly improvements in West Baltimore,including the reconnection <strong>of</strong> Payson Street, which will enhancepedestrian and vehicle access between surrounding communities.MDTA: Construction <strong>of</strong> the I-95 Express Toll Lanes (ETLs) project is continuing withcompletion <strong>of</strong> the I-95/I-695 interchange, and the MD 43 interchangeproject anticipated in <strong>2013</strong>, with the ETLs planned to open to trafficin 2014.MVA:SHA:Increase the availability and convenience <strong>of</strong> services with a new onlineand self-serve kiosk application, which allows <strong>Maryland</strong>ers to renew theirState Identification (ID) card via the internet or at an MVA self-serve kiosk.Continue to relieve congestion and improve safety for motorists withconstruction improvements on the most heavily traveled routes in<strong>Maryland</strong>, including the MD 140 intersection with Painters Mill Road inOwings Mills.Performance MeasuresMonitoringAgencyPerformanceMeasurePageMAA Number <strong>of</strong> nonstop airline markets served 48MPAMPAMTAInternational cruises using the Port <strong>of</strong>BaltimorePort <strong>of</strong> Baltimore foreign cargo andMPA general cargo tonnageAnnual revenue vehicle miles <strong>of</strong> serviceprovidedMTA Average weekday transit ridership 45MVASHAPercent <strong>of</strong> information system availabilitycompared to total number <strong>of</strong> recordsmaintainedPercentage <strong>of</strong> State-owned roadwaydirectional miles within urban areas thathave sidewalks and percent <strong>of</strong> sidewalksthat meet Americans with DisabilitiesAct (ADA) compliance5049464847SHASHA & MDTAPercentage <strong>of</strong> State-owned roadwaycenterline miles with a bicycle level <strong>of</strong>comfort (BLOC) grade “D” or betterand directional mileage <strong>of</strong> SHA-ownedhighways with marked bike lanesPercent <strong>of</strong> freeway lane-miles andarterial lane-miles with average annualvolumes at or above congested levels474443
44SHA & MDTA: Percent <strong>of</strong> Freeway Lane-Miles and ArterialLane-Miles with Average Annual Volumes at or AboveCongested LevelsVehicles per lane per day volumes provide insight into whether congestion is improving or worsening across the state.Given <strong>Maryland</strong>’s growing economic vitality, the anticipated increase in vehicle miles traveled and the growing size <strong>of</strong> thedriving population, MDOT is focusing its efforts where it can be most effective, which is to slow the pace <strong>of</strong> congestiongrowth and set targets accordingly.Percent <strong>of</strong> CongestedLane-Miles45.0%40.0%35.0%30.0%25.0%20.0%15.0%10.0%5.0%0.0%29%17%200229%17%200330%17%200431%17%30%15%30%15%29%14%2005 2006 2007 2008Calendar Year25%14%200929%14%201031%14%2011Goal: Connectivity for Daily LifePercentage <strong>of</strong> freeway lane-mileswith average annual volumes ator above congested levelsTARGET: < 40% freeway lane-milesPercentage <strong>of</strong> arterial lane-mileswith average annual volumes ator above congested levelsTARGET: < 30% arterial lane-milesWhy Did Performance Change?• SHA, in partnership with the University <strong>of</strong> <strong>Maryland</strong>, implemented a state-<strong>of</strong>-the-art method formeasuring congestion that accounts for actual traffic speeds and volumes as experienced bydrivers during the most congested time <strong>of</strong> day• Retimed 298 signals that resulted in approximately $21 million in annual user cost savings• Added capacity to <strong>Maryland</strong> roads by widening MD 237 from MD 235 to Pegg Road in St. Mary’sCounty, reconstructing the I-95/MD 24 interchange; and constructing a new interchange atMD 24/MD 924• Began construction <strong>of</strong> projects to add capacity include widening <strong>of</strong> I-70 from MD 85 to MD 144in Frederick County, widening <strong>of</strong> MD 404 and US 113 on the Eastern Shore, reconstructing I-695/MD 26 and I-695/MD 139 interchanges, and construction <strong>of</strong> the I-95 ETL projectWhat Are Future Performance Strategies?• Continue the Coordinated Highways Action Response Team (CHART) program for incidentmanagement, traffic management and traveler information systems• Continue to focus resources on optimizing traffic signals and signal systems• Continue to focus on improving reliability on highway systems, enhancing accessibility andconnectivity <strong>of</strong> the system• Identify and implement short-term geometric improvements for congestion hot spots• Enhance transit and non-motorized travel options, as well as Travel Demand Management(TDM) programs• Complete and open for travel ETLs along I-95 from north <strong>of</strong> MD 43 to the I-95 and I-895split, complete construction <strong>of</strong> I-95 ETL access ramps at the I-95/695 interchange, andcomplete the MD 43/I-95 interchange
MTA: Average Weekday Transit RidershipWeekday transit usage demonstrates progress toward better mobility for our customersand contributes to statewide goals.Average WeekdayRiders500,000400,000300,000200,000100,000336,567TARGET: Increase <strong>of</strong> 56,000 riders byFY2012 (baseline year = 2006)316,204 313,827 320,419 333,283 345,317 359,711 356,885 372,118 377,87702003200420052006200720082009201020112012FISCAL YEARWhy Did Performance Change?• Average weekday ridership in FY2012 was 2% higher than FY2011 and hasincreased by 18% since 2006• Investigated and implemented more parking options for commuters toalleviate over-crowded lots• Increased capacity on the Local Bus network by investing in articulatedcoaches – currently 42 are in service (6% <strong>of</strong> the fleet)• FY2012 is the eighth consecutive year the MTA has seen an increase inridership and is the highest ridership recorded since tracking this measurestarted in the <strong>Attainment</strong> <strong>Report</strong>• Compared to ridership in 2003, MTA is providing over 41,000 more transittrips every weekday. Compared to 2006, MTA is providing an additional57,000 transit trips every dayWhat Are Future Performance Strategies?• Aggressively seek solutions to maximize Local Bus system capacity whilecontrolling costs through efficient scheduling and system design• Increase system reliability through reductions in mechanical failures andimproving on time performance• Continue to investigate and implement more parking options for commutersto alleviate over-crowded lots• Continue to increase capacity on the Local Bus network by investing inarticulated coaches – currently 42 are in service (6% <strong>of</strong> the fleet)• Implement real-time passenger information on MTA’s transit services• Continue to implement additional park and ride options for Commuter Busoperations (in the FY<strong>2013</strong>–FY2018 Consolidated <strong>Transportation</strong> Plan (CTP),$24.4 million in funding is programmed to expand parking in CharlotteHall, Dunkirk, New Market and Waldorf as part <strong>of</strong> the Southern <strong>Maryland</strong>Commuter Bus Initiative)Goal: Connectivity for Daily Life45
46MTA: Annual Revenue Vehicle Miles <strong>of</strong> Service Provided*Revenue vehicle miles, or each mile for which a transit vehicle is in service and accepting customers,indicates the level <strong>of</strong> transit service available to, and in use by, the general public.LOCAL Bus25.020.015.010.05.00.019.2200319.8200419.7200519.6200619.2200719.4200820.2200920.1201020.4201121.72012Goal: Connectivity for Daily LifeLightRail20.010.00.02.820032.120041.520052.120062.820072.820082.820093.220103.220113.12012Revenue Miles (Millions)BaltimoreMetroMARC20.010.0 4.5 4.5 4.7 4.7 4.7 5.2 5.30.020.010.00.02003 2004 2005 2006 2007 2008 20094.8 4.9 4.9 5.0 5.0 5.1 5.22003 2004 2005 2006 2007 2008 20094.520106.020104.720116.620114.620127.12012ContractedCommuterBus20.010.00.03.8 3.8 3.8 4.3 4.3 4.5 4.52003 2004 2005 2006 2007 2008 20094.520104.520115.22012Paratransit& TaxiAccess20.010.00.011.710.6 10.97.5 9.14.5 4.22003 2004 2005 2006 2007 2008 2009Fiscal Year10.420109.6201113.72012* Excludes Locally Operated Transit Systems (LOTS) and Washington Metropolitan Area Transit Administration (WMATA).Why Did Performance Change?• Increased availability <strong>of</strong> transit service onMARC by adding trains on the Penn Lineand extending termini on some train lines• Provided an efficient alternative to drivingwith Commuter Bus service enhancements,including adding Intercounty Connector(ICC) routes 201, 202, 203, 204 and 205• Paratransit & Taxi Access mileageexperienced a large increase due to theincrease in the number <strong>of</strong> trips providedWhat Are Future PerformanceStrategies?• Increase or reallocate service miles, whereneeded, to maximize transit availability
SHA: Percentage <strong>of</strong> State-Owned RoadwayDirectional Miles Within Urban Areas That HaveSidewalks and Percent <strong>of</strong> Sidewalks That MeetAmericans with Disabilities Act (ADA) ComplianceAvailable sidewalk facilities provide mobility for pedestrians. Tracking the percent that are ADAcompliant helps ascertain whether <strong>Maryland</strong>’s sidewalk program meets federal benchmarks.Percent70.0%60.0%50.0%40.0%30.0%20.0%10.0%0.0%TARGET: Increase sidewalks andADA compliance by 2% per year32.0% 32.0%52%200754%200828.0%56%2009 2010* 2011*Fiscal YearPercentage <strong>of</strong> State-ownedroadway directional miles withinurban areas that have sidewalks20.0%58%20.5%60%21.0%Percentage <strong>of</strong>sidewalks that meetADA compliance* 2010-2012 data are based on a new data collection method that cannot be accurately compared to previous years’ data .62%2012*Why Did Performance Change?• Invested $19.8 million in FY2012 to improve sidewalks and toaddress ADA issues, including $6.5 million to support the newPedestrian Access to Transit Program• Installed more than 731 accessible pedestrian signals sincethe program began in FY2006• Continued to fund and manage for the <strong>Maryland</strong> Safe Routesto School (SRTS) program to provide a safer environment forwalking or biking to over 290 schools• Takoma Park SRTS was awarded a 2012 James L. OberstarSafe Routes to School Honorable Mention Award• SHA provided funding for a partnership between BaltimoreCity and Johns Hopkins School <strong>of</strong> Public Health to develop apilot walking school bus program as part <strong>of</strong> a SRTS programWhat Are Future Performance Strategies?• Support safe pedestrian access along State highways ($10.0million for the Sidewalk Retr<strong>of</strong>it Program and $61.6 million forthe ADA Compliance Program in the FY<strong>2013</strong>–FY2018 CTP)• Target funds towards areas in which there is a history <strong>of</strong>high pedestrian injuries and fatalities, as well as a significantimpediment to pedestrian access• Construct numerous sidewalk improvement projects inFY<strong>2013</strong>, including MD 150 in Essex, MD 528 in Ocean City,MD 373 in Berlin and MD 414 in Oxon Hill• Continue to upgrade intersections with pedestrian countdownsignals and ADA features such as pedestrian curb ramps andmedian cut-throughsSHA: Percentage <strong>of</strong> State-Owned Roadway Centerline Miles with a Bicycle Level<strong>of</strong> Comfort (BLOC) Grade “D” or Better and Directional Mileage <strong>of</strong> SHA-OwnedHighways with Marked Bike Lanes*BLOC (scale “A” to “F”) is a measure for assessing the quality <strong>of</strong> the statewide roadway system for its comfort and compatibility with bicycle users. It accountsfor multiple characteristics <strong>of</strong> the roadway through a formula which produces a single BLOC grade for any section <strong>of</strong> roadway. Shoulder width is the mostinfluential roadway characteristic for improving BLOC. Marked bike lanes are space on the roadway designated by pavement markings for the preferential orexclusive use <strong>of</strong> bicyclists. The amount <strong>of</strong> bike lanes in a jurisdiction is typically a good measure <strong>of</strong> the level <strong>of</strong> bike friendliness <strong>of</strong> that jurisdiction; however,their presence is not captured in the BLOC formula; thus, both must be taken into account when evaluating the quality <strong>of</strong> the bicycling environment.Goal: Connectivity for Daily Life47Percent <strong>of</strong> Centerline MilesAbove BLOC Grade “D”100.0%90.0%80.0%70.0%60.0%50.0%TARGET: 2.0% increase in bike lanes per yearBLOC TARGET: 80%.79.0% 79.0% 79.0% 79.0% 79.0%47.047.0n/an/a52.857.92007 2008 2009 2010 2011* 2012Fiscal YearPercent <strong>of</strong> centerline milesMiles <strong>of</strong> bike lanesabove BLOC grade ‘D”* FY2011 marked bike lane mileage is the revised baseline data. The BLOC measurehas consistently shown 79-80% <strong>of</strong> facilities meeting a grade <strong>of</strong> “D” <strong>of</strong> better inprevious years.6050403020100Miles <strong>of</strong> Bike LanesWhy Did Performance Change?• Increased the directional miles <strong>of</strong> bicyclefacilities along existing SHA roadwaysby 9%• Established a SHA Bicycle Design Teamresponsible for the development <strong>of</strong>bicycle-related projects at SHA• Issued a new policy on marked bicyclelanes that provides guidance on themarking and signing <strong>of</strong> bicycle facilities• Improved 19 miles <strong>of</strong> roadway from aBLOC grade “D” or worse to a BLOCgrade “C” or better in FY2012; to gaina one percentage point increase in thismeasure, about 46 miles <strong>of</strong> roadwayneed to be improved from a BLOCgrade “D” or worse to a BLOC grade“C” or betterWhat Are Future PerformanceStrategies?• Revise the SHA bicycle guidelines toreflect changes made under the newbicycle policy and provide better designguidance in developing bikeway facilities• Support bikeway projects along Statehighways ($9.6 million for the BicycleRetr<strong>of</strong>it Program in the FY<strong>2013</strong>–FY2018 CTP)• Adopt new bicycle guidelines thatprovide improved guidance for thedesign <strong>of</strong> bicycle facilities, consistentwith the newly issued 2012 bicycleguidelines from the AmericanAssociation <strong>of</strong> State Highway and<strong>Transportation</strong> Officials (AASHTO)• Implement statewide, multi-jurisdictionalbicycling routes to serve regionallysignificant points <strong>of</strong> interest, beginningwith the Fort Meade to Columbia route
48MAA: Number <strong>of</strong> Nonstop Airline Markets ServedGrowth in the number <strong>of</strong> nonstop destinations served provides enhanced mobility options topassengers traveling to cities in the U.S. and around the world; increases the attractiveness <strong>of</strong>BWI Marshall as the airport <strong>of</strong> choice in the region; and reflects the success <strong>of</strong> MAA’s marketingefforts to increase the competitiveness <strong>of</strong> BWI Marshall for business and leisure travel.Number <strong>of</strong> NonstopMarkets Served80757065605550742003742004712005717369702006 2007 2008 2009Fiscal YearTARGET: (FY2011-FY2014) 70722010752011762012Why Did Performance Change?• New nonstop service was added from BWI Marshall toAruba in FY2012• Condor initiated new nonstop service to Frankfurt inJuly 2012• AirTran discontinued nonstop service to Huntsville andSarasota in August 2012 as a result <strong>of</strong> its merger withSouthwest• Spirit began nonstop service from BWI Marshall toDallas/Ft Worth and Ft. Lauderdale in September 2012What Are Future Performance Strategies?• Focus marketing and awareness campaigns on theadvantages <strong>of</strong> using BWI Marshall, (e.g., ease <strong>of</strong> access,parking, attractive concessions and accessible groundtransportation options)• Continue to promote BWI Marshall as a convenientgateway to Washington, D.C.• Meet with new entrant and current carriers to promotepotential new air service opportunities to BWI MarshallGoal: Connectivity for Daily LifeMVA: Percent <strong>of</strong> Information System AvailabilityCompared to Total Number <strong>of</strong> Records MaintainedThis measures progress in maintaining the availability, integrity, and security <strong>of</strong> MVA databecause access to driver and vehicle data is critical to law enforcement and governmentagencies, 24 hours a day, 7 days a week.Percent Availability100.0%90.0%80.0%70.0%60.0%99.5%99.8%99.7%99.7%99.7%TARGET: 95% Information Systems Availability99.8% 99.9%99.9%99.9%99.7%12,00010,0008,0006,0004,0002,000Number <strong>of</strong> Records (Thousands)Why Did Performance Change?• In FY2012 the percent <strong>of</strong> system availability slightlydecreased to 99.7% but still remains above the target<strong>of</strong> 95%• Mainframe record capacity is driven by thedemographic nature <strong>of</strong> <strong>Maryland</strong> (number <strong>of</strong> driversand vehicles) as opposed to the specific businessnature <strong>of</strong> the MVA• The number <strong>of</strong> mainframe records for licensed drivers,identification card holders and registered motorvehicles increased from 11,377,890 in FY2011 to11,621,504 in FY2012What Are Future Performance Strategies?• Continue employing the latest technologies andsecurity protocols to ensure full-time access withminimal business disruptions• Continue to provide data for Law Enforcement,Child Support Enforcement, Arrest Warrants, CourtsPoint System, Board <strong>of</strong> Elections, Organ Donor, andChesapeake Bay and Agriculture Programs8,1668,3278,4508,5858,6908,7698,7849,03111,37811,62250.0%2003200420052006 2007 2008 2009FISCAL Year2010201120120Percent availableNumber <strong>of</strong> records
MPA: Port <strong>of</strong> Baltimore Foreign Cargo & MPA General Cargo Tonnage*There are many factors outside MPA’s influence that impact the movement <strong>of</strong> freight, such as national and world economic trends, labor costs (in <strong>Maryland</strong> andat competing ports), value <strong>of</strong> the U.S. dollar, rail and highway service and rates, prolonged weather conditions and changes in vessel sizes. Tracking cargo trendssupports MPA’s management decisions and helps to assess the economic impact <strong>of</strong> freight activity occurring at the Port <strong>of</strong> Baltimore and MPA terminals.45.040.0TARGET: Grow MPA generalcargo by 3% per year since 200035.0Tons (Millions)30.025.020.015.010.05.024.77.1 31.87.4 32.48.1 30.68.2 30.88.633.09.122.47.832.87.637.88.740.09.30.02003200420052006Port <strong>of</strong> Baltimore foreigncargo tonnage (CY)20072008Year2009MPA total general cargotonnage (FY)20102011**2012****MPA general cargo includes both foreign and domestic waterborne cargo.** 2011 data point was revised from last the 2012 <strong>Report</strong>.***2012 data for POB is an estimate.Why Did Performance Change?• General cargo tonnage at MPA terminals has recovered from the globalrecession <strong>of</strong> 2009 and increased 7.4% in fiscal year 2012, to a total <strong>of</strong> 9.3million tons – a new record high• The Port <strong>of</strong> Baltimore’s public marine terminals topped previous recordsby handling a record 4.83 million tons <strong>of</strong> general cargo during the first sixmonths <strong>of</strong> 2012• The MPA terminals experienced the greatest gains in import roll-on/roll-<strong>of</strong>f(RoRo) equipment and exported autos• Chrysler exported 101,000 vehicles through the Port <strong>of</strong> Baltimore• The largest RoRo ship in the world, the Wallenius-Wilhelmsen Logistics shipTonsberg, with 4.87 million cubic feet <strong>of</strong> available space cargo visited the Port<strong>of</strong> Baltimore• RoRo agricultural equipment is in demand for both food and bio-fuelproduction and RoRo mining equipment is in demand due to the increase incommodity pricesWhat Are Future Performance Strategies?• Continue the Quality Cargo Handling Action Team (QCHAT) to makeimprovements for all parties• Continue with rail and terminal improvements to facilitate Wallenius-Wilhelmsen Logistics expanding cargo at their Mid-Atlantic Terminal• Continue to coordinate roadway permit issues with the City <strong>of</strong> Baltimore t<strong>of</strong>acilitate cargo movement and positive community relations• Meet potential Forest Products’ future covered storage requirements byconducting site stabilization at Dundalk Lot 500 for possible future privateinvestment in shed construction• Construct new cargo gate for South Locust Point• Target auto and machinery manufacturers to provide long-term commitmentsand encourage existing auto processors to increase cargo volumes, efficiencyand throughputs (The FY<strong>2013</strong>–FY2018 CTP identifies $21.7 million toconstruct a new Masonville Vessel Berth to accommodate continued growthin automobile imports and exports)Goal: Connectivity for Daily Life49
50MPA: International Cruises Using the Port <strong>of</strong> BaltimoreMeasures cruise business activity departing from the Port <strong>of</strong> Baltimore to foreign destinations.Calendar Year 2003 2004 2005 2006 2007 2008 2009 2010 2011 2012*Number <strong>of</strong> internationalcruises using MPA’s terminalTARGET: 100 cruises in 2012, 98 cruises in <strong>2013</strong>*Data is estimated for CY2012.Why Did Performance Change?• Carnival Cruise Lines and Royal Caribbean International reports that theirships are sailing at over 100% capacity (more than two people per cabin)• 505,000 cruise passengers embarked and debarked from the Port <strong>of</strong>Baltimore’s Cruise <strong>Maryland</strong> Terminal on 105 cruises, breaking an all timerecord, and there were seven port-calls in CY2011• Installed a new flexible temperature controlled boarding bridge that willaccommodate a variety <strong>of</strong> vessel sizes• Carnival Cruise Lines and Royal Caribbean International continued to <strong>of</strong>feryear-round service from the Port <strong>of</strong> Baltimore• In addition to 2012’s 100 home-port cruises, there were six port-calls byother cruise ships35 59 28 28 29 27 81 90 105 100What Are Future Performance Strategies?• Continue promoting the Port as a convenient location for year-roundcruising• Improve the year-round comfort and convenience <strong>of</strong> cruise line passengers,for example expand Wi-Fi capabilities, terminal system preservation projectsand VIP customer facilities• Enhance parking options by providing online prepayment options• Continue the partnership with existing cruise lines and develop newopportunities for additional cruise lines to come to Baltimore• Make water and landside adjustments as necessary, such as expandingfacilities to handle two cruise ships per day, to continue increasing thenumber <strong>of</strong> cruise ships and passengers using the PortGoal: Connectivity for Daily LifeMDOT would like to <strong>of</strong>fer special thanks and recognition for provision <strong>of</strong> photos:Page 10, Jay Baker - Governor’s Office; Pages 11 and 50, Jeff Sauers; Page 14, Jessica Puchala - <strong>Maryland</strong> State Highway Administration;Pages 34 and 49, Bill McAllen; Page 35 and 37, <strong>Maryland</strong> Environmental Service.
GlossaryGLOSSARY TERMAnnual <strong>Attainment</strong> <strong>Report</strong>on <strong>Transportation</strong> SystemPerformanceBase Realignment and Closure(BRAC)Calendar Year (CY)Coordinated Highways ActionResponse Team (CHART)Consolidated <strong>Transportation</strong>Program (CTP)E-ZPass®Fiscal Year (FY)Intercounty Connector(ICC)/MD 200Locally Operated Transit Systems(LOTS)<strong>Maryland</strong> <strong>Transportation</strong> Plan (MTP)MPA General CargoPort <strong>of</strong> Baltimore Foreign CargoMAP-21ModeREAL IDSmart Green & GrowingState <strong>Report</strong> on <strong>Transportation</strong> (SRT)Transit-Oriented Development (TOD)Travel Demand Management (TDM)Vehicle Miles <strong>of</strong> Travel (VMT)DEFINITIONPursuant to <strong>Transportation</strong> Article Section 2-103.1 <strong>of</strong> the Annotated Code <strong>of</strong> <strong>Maryland</strong>, the State is required todevelop or update an annual performance report on the attainment <strong>of</strong> transportation goals and benchmarks inthe <strong>Maryland</strong> <strong>Transportation</strong> Plan (MTP) & Consolidated <strong>Transportation</strong> Program (CTP). The <strong>Attainment</strong> <strong>Report</strong>must be presented annually to the Governor and General Assembly before they may consider the MTP and CTP.BRAC is a Congressionally authorized process the <strong>Department</strong> <strong>of</strong> Defense has previously used to reorganizeits base structure to more efficiently and effectively support U.S. forces, increase operational readiness andfacilitate new ways <strong>of</strong> doing business.The period <strong>of</strong> 12 months beginning January 1 and ending December 31 <strong>of</strong> each reporting year.CHART is an incident management system aimed at improving real-time travel conditions on <strong>Maryland</strong>’shighway system. CHART is a joint effort <strong>of</strong> the State Highway Administration, <strong>Maryland</strong> <strong>Transportation</strong> Authority,and the <strong>Maryland</strong> State Police, in cooperation with other Federal, State and local agencies.A six-year program <strong>of</strong> capital projects, which is updated annually to add new projects and reflect changes infinancial commitments.An electronic toll collection system utilized to provide a more efficient flow <strong>of</strong> traffic through MDTA toll facilities.E-ZPass® toll collection is available at all eight MDTA toll facilities. The benefits <strong>of</strong> E-ZPass® membership allowtravel from Virginia to Maine and as far west as Illinois, with tolls paid from a <strong>Maryland</strong> E-ZPass® account.A yearly accounting period covering the time frame between July 1 and June 30 <strong>of</strong> each reporting year.New all electronic toll-road between I-270 in Montgomery County to I-95 in Prince George’s County.Transit systems that provide primarily bus service and demand response within the local areas in which theyoperate. They are funded through a combination <strong>of</strong> Federal, State and local money. MDOT provides financial,technical and operating support for these services.The MTP is MDOT’s long-range transportation policy plan and includes the vision, goals and objectives thatprovide the policy framework and context for <strong>Maryland</strong>’s transportation programs and investments. The MTPsets <strong>Department</strong> policy for the 20-year period and is updated every five years.Foreign and domestic waterborne general cargo handled at the public (MPA) terminals.International (Foreign) cargo handled at public and private terminals within the Baltimore Port District.This includes bulk cargo (e.g., coal, sugar, petroleum, ore, etc. shipped in bulk) and all general cargo (e.g.,miscellaneous goods shipped in various packaging).On June 6, 2012, the President signed into law the Moving Ahead for Progress in the 21st Century (MAP-21)P.L. 112-141 - new legislation that will stabilize funding for highway and transit programs for two years and willset national, statewide and metropolitan transportation planning and policy direction. The Federal bill did notincrease funding levels and also did not address the long-term solvency <strong>of</strong> the Federal Highway Trust Fund.Form <strong>of</strong> transportation used to move people or cargo (e.g., truck, rail, air).The Federal REAL ID Act <strong>of</strong> 2005 sets new standards designed to improve the integrity and security <strong>of</strong> Stateissueddriver’s licenses and identification cards. The legislation contains 39 benchmarks for states to meet therequirements <strong>of</strong> the REAL ID Act. The full text <strong>of</strong> the REAL ID Act (including benchmarks) is available on the<strong>Department</strong> <strong>of</strong> Homeland Security’s website at www.dhs.gov. General information about <strong>Maryland</strong>’s involvementwith the REAL ID Act is available on MVA’s website at www.marylandmva.com.Smart Green & Growing is a long-range, statewide multi-agency initiative to help <strong>Maryland</strong> achieve a moresustainable future by linking community revitalization, transportation improvements, Smart Growth andenvironmental restoration efforts.The SRT is prepared annually and distributed to the General Assembly, local elected <strong>of</strong>ficials and interestedcitizens. It consists <strong>of</strong> two documents, the <strong>Maryland</strong> <strong>Transportation</strong> Plan (MTP) and the Consolidated<strong>Transportation</strong> Program (CTP).TOD creates places around high-quality transit service that permit lifestyles and employment options wherewalking, bicycling and transit travel is convenient and safe. Designed for pedestrian comfort, mixes <strong>of</strong> uses, andhigher densities are combined to create comfortable walking environments. Close proximity to the transit (busor train) station and the quality <strong>of</strong> the TOD helps to promote use <strong>of</strong> transit and less reliance on the automobile.TDM strategies support the use <strong>of</strong> alternatives to the traditional single-occupant vehicle through a variety <strong>of</strong>programs and incentives (e.g., carpooling, car sharing, transit, park-and-ride facilities, teleworking and flexiblework hours).A measurement <strong>of</strong> the total miles traveled by all vehicles.51
Appendix: List <strong>of</strong> Performance Measures52MTP Goal Performance Measure Definition<strong>Maryland</strong> <strong>Department</strong> <strong>of</strong> <strong>Transportation</strong> (MDOT)Environmental StewardshipEnvironmental StewardshipEnvironmental StewardshipQuality <strong>of</strong> ServiceSafety & SecuritySafety & SecuritySafety & SecuritySystem Preservation &PerformanceSystem Preservation &PerformanceConnectivity for Daily LifeQuality <strong>of</strong> ServiceSafety & SecuritySystem Preservation &Performance<strong>Transportation</strong> Emissions Reduction Measures (TERMs)• Commuter Operations and Ridesharing Center• Employer Outreach (including Employer Outreachfor Bicycles)• Guaranteed Ride Home<strong>Transportation</strong>-related emissions by region<strong>Transportation</strong>-related greenhouse gas (GHG) emissions<strong>Maryland</strong> Aviation Administration (MAA)Percent <strong>of</strong> BWI Marshall customers rating the airport“good” or “excellent” on key servicesBWI Marshall crime rateNumber <strong>of</strong> repeat discrepancies in the annual FederalAviation Administration’s Federal Aviation RegulationinspectionRate <strong>of</strong> airfield ramp incidents and accidents per 1,000operationsAirline cost per enplaned passenger (CPE)Non-airline revenue per enplaned passenger (RPE)Number <strong>of</strong> nonstop airline markets served<strong>Maryland</strong> Port Administration (MPA)Average truck turn-around time at Seagirt Marine TerminalMPA compliance with the Maritime <strong>Transportation</strong> SecurityAct <strong>of</strong> 2002Adequate dredge material placement capacity remainingfor Harbor and Bay maintenance and new work dredgingTERMs and Travel Demand Management (TDM)strategies support the use <strong>of</strong> alternatives to thetraditional single-occupant vehicleTons <strong>of</strong> Volatile Organic Compound (VOCs) andNitrogen Oxide (NOx), precursors <strong>of</strong> Ozone,emitted per day for an average weekday fromtransportation sources in the Baltimore andWashington regionsGHG emissions primarily include carbon dioxide,methane, nitrous oxide, carbon monoxide, oxides<strong>of</strong> nitrogen and non-methane volatile organiccompoundsPercent <strong>of</strong> customers giving a score <strong>of</strong> 4 or 5(on a 5 point scale) for “Overall Satisfaction” and“How likely to fly from BWI Marshall on their nexttrip”Crimes include all crimes against persons orproperty at BWI Marshall facilitiesAnnual FAA Part 139 Federal Aviation Regulation(FAR) assessment conducted by the FederalAviation AdministrationIncident reports collected by MAA / 1,000operations (take <strong>of</strong>fs and landings)Total airline-related fees / Total enplanedpassengers at BWI MarshallTotal non-airline revenue (ground transportation,parking, concessions, etc.) / Total enplanedpassengers at BWI MarshallNonstop flights are direct to destination withoutconnectionsAmount <strong>of</strong> time for a truck to enter the Terminalgate, drop <strong>of</strong>f and/or receive a container, and exitthe gateMPA activities in support <strong>of</strong> a compliance (Pass /Fail) rating from the U.S. Coast GuardMonitors existing capacity remaining at Harborand Bay dredged material placement sitesSystem Preservation & Performance Revenue versus operating expenseTotal revenues compared to operating expense <strong>of</strong>MPA, but excluding some exclusionsEnvironmental StewardshipConnectivity for Daily LifeConnectivity for Daily LifeAcres <strong>of</strong> wetlands or wildlife habitat created, restored, orimproved since 2000International cruises using the Port <strong>of</strong> BaltimorePort <strong>of</strong> Baltimore foreign cargo and MPA general cargotonnageCumulative tally <strong>of</strong> acreage created, restored, orimproved for wildlife habitatNumber <strong>of</strong> international cruises using the Port <strong>of</strong>Baltimore as a home portMPA general cargo includes foreign anddomestic waterborne cargo; Port <strong>of</strong> Baltimoreforeign cargo includes bulk and general cargoeswithin the Port District, but does not includedomestic cargo
MTP Goal Performance Measure Definition<strong>Maryland</strong> Transit Administration (MTA)Quality <strong>of</strong> ServiceCustomer satisfaction ratingAverage score for: Overall satisfaction <strong>of</strong>each MTA service (Local Bus, Light Rail,Baltimore Metro and MARC)Quality <strong>of</strong> ServicePercent <strong>of</strong> service provided on timeBaltimore Metro and Marc: Number <strong>of</strong> tripsarriving on schedule. Local Bus: Calculated fromdata-transmitting buses tracking the number<strong>of</strong> time points arrived at on time divided by thetotal number <strong>of</strong> scheduled time pointsSafety & SecurityCustomer perceptions <strong>of</strong> safety on the MTA systemAverage score for: Feeling safe while riding,while waiting at stops and stations, and formy vehicle left in an MTA parking lotSafety & SecurityPreventable accidents per 100,000 vehicle milesPreventable accidents are accidents in whichdrivers did not do everything they could toavoid an accident / 100,000 vehicle milesSystem Preservation &PerformanceOperating cost per passenger tripTotal operating expenses / Number <strong>of</strong>unlinked passenger tripsSystem Preservation &PerformanceOperating cost per revenue vehicle mileOperating cost for each mode / Total mileswhen vehicle is in service (not deadheadingor down time)System Preservation &PerformancePassengers per revenue vehicle milePassenger trips by mode / Total revenuemiles by modeEnvironmental StewardshipTravel Demand Management• Number <strong>of</strong> park-and-ride spaces—MTA Operated• Transit MultipurposeTransit lots are MTA owned; multipurposelots are not MTA ownedEnvironmental Stewardship<strong>Transportation</strong> Emissions Reduction Measures• MTA College Pass• MTA Commuter Choice <strong>Maryland</strong> Pass• Transit Store in BaltimoreTERMs and Travel Demand Managementstrategies support the use <strong>of</strong> alternatives tothe traditional single-occupant vehicleConnectivity for Daily LifeAnnual revenue vehicle miles <strong>of</strong> MTA service providedRevenue vehicle miles are defined as eachmile for which a transit vehicle is in serviceand accepting customersConnectivity for Daily LifeAverage weekday transit ridershipRidership for Local Bus, Light Rail, BaltimoreMetro, MARC, Contracted Commuter Bus,and Paratransit & Taxi Access<strong>Maryland</strong> <strong>Transportation</strong> Authority (MDTA)Quality <strong>of</strong> ServiceOverall customer satisfaction <strong>of</strong> E-ZPass® customersCustomer satisfaction based on customersatisfaction surveyAppendix: List <strong>of</strong> Performance MeasuresQuality <strong>of</strong> ServiceQuality <strong>of</strong> ServiceSafety & SecuritySystem Preservation &PerformanceSystem Preservation &PerformancePercentage <strong>of</strong> tolls collected electronicallyMotor Vehicle Administration (MVA)Branch <strong>of</strong>fice customer visit time versus customersatisfaction ratingPercent <strong>of</strong> Homeland Security REAL ID Actbenchmarks achievedAlternative service delivery transactions as percent <strong>of</strong>total transactionsCost per transactionToll collections by E-ZPass® and Automatic VehicleIdentification / Total number <strong>of</strong> toll collectionsAverage visit time plotted againstpercentage <strong>of</strong> customers rating their MVAexperience as “good” or “very good” (basedon quarterly survey <strong>of</strong> customers)Federal legislation contains 39 benchmarks forstates to meet requirements <strong>of</strong> the Federal REALID ActTransactions by alternative services (using ameans other than a visit to an MVA branch) /Total transactionsOperating costs and capitalized costs /Number <strong>of</strong> transactions53
54MTP Goal Performance Measure DefinitionEnvironmental StewardshipConnectivity for Daily LifeQuality <strong>of</strong> ServiceQuality <strong>of</strong> ServiceSystem Preservation &PerformanceMotor Vehicle Administration (MVA)Compliance rate and number <strong>of</strong> vehicles tested forVehicle Emissions Inspection Program (VEIP) versuscustomer wait timePercent <strong>of</strong> information system availability comparedto total number <strong>of</strong> records maintainedState Highway Administration (SHA)<strong>Maryland</strong> driver satisfaction ratingPercentage <strong>of</strong> the <strong>Maryland</strong> SHA network in overallpreferred maintenance conditionUser cost savings for the traveling public due toincident managementRegistered vehicles in non-attainmentcounties are scheduled for VEIP testing everytwo years. Compliance rate is the number <strong>of</strong>vehicles registered in non-attainment countiesscheduled for testing / Number <strong>of</strong> registeredvehicles in non-attainment counties testedIncludes availability <strong>of</strong> data records by typeand systems up timeSatisfaction rating based on weightedaverage score for 26 questionsInternal peer review assessment <strong>of</strong> roadwayfeatures <strong>of</strong> the total SHA lane-milesCost saving calculated using CoordinatedHighways Action Response Team (CHART)incident response dataAppendix: List <strong>of</strong> Performance MeasuresEnvironmental StewardshipEnvironmental StewardshipEnvironmental StewardshipConnectivity for Daily LifeConnectivity for Daily LifeAcres <strong>of</strong> wetlands restored and miles <strong>of</strong> streamsrestoredTotal fuel usage <strong>of</strong> the SHA light fleetTravel Demand Management• Number <strong>of</strong> SHA park-and-ride spaces• Reduction in vehicle miles traveled through parkand-rideusagePercentage <strong>of</strong> State-owned roadway directional mileswithin urban areas that have sidewalks and percent <strong>of</strong>sidewalks that meet American’s with Disabilities Act(ADA) compliancePercentage <strong>of</strong> State-owned roadway centerlinemiles with a bicycle level <strong>of</strong> comfort (BLOC) grade“D” or better and directional mileage <strong>of</strong> SHA-ownedhighways with marked bike lanesMeasures Shared by AdministrationsSHA mitigation efforts for past impactsto wetlands and streams due to highwayconstruction projectsFuel used by fleet <strong>of</strong> State-owned cars,dispensed at SHA facilities that containsethanol (SHA light fleet consists <strong>of</strong> sedans,SUVs, half-ton pickup trucks and vans thatuse gasoline or gasoline/ethanol blends)SHA operates a number <strong>of</strong> park-and-ridefacilities to support TDMOn SHA roads where pedestrian access isallowed and within urban areas as defined bythe U.S. Census BureauBLOC is an A to F scale, a formula based onmany factors, including outside lane width, thepresence <strong>of</strong> on-street parking, roadway speedand shoulder width and truck percentage, withthe greatest driving factors being shoulderwidth, speed and truck percentage.State Highway Administration (SHA) and <strong>Maryland</strong> <strong>Transportation</strong> Authority (MDTA)System Preservation &PerformanceSystem Preservation &PerformanceConnectivity for Daily LifePercent <strong>of</strong> roadway miles with acceptable ride qualityNumber <strong>of</strong> bridges and percent that are structurallydeficientPercent <strong>of</strong> freeway lane-miles and arterial lane-miles withaverage annual volumes at or above congested levelsPercent <strong>of</strong> road with acceptable InternationalRoughness Index (IRI) scoreNumber <strong>of</strong> bridges where at least one majorstructural element has a condition rating <strong>of</strong> 4or less (out <strong>of</strong> 10)Annual average daily traffic / Number <strong>of</strong>through lanesState Highway Administration (SHA) and Motor Vehicle Administration (MVA)Safety & SecurityNumber <strong>of</strong> bicycle and pedestrian fatalities andinjuries on all <strong>Maryland</strong> roadsNumber <strong>of</strong> bicyclists and pedestrians killed /injured in traffic-related crashes in a calendaryearState Highway Administration (SHA), Motor Vehicle Administration (MVA) and <strong>Maryland</strong> <strong>Transportation</strong> Authority (MDTA)Safety & SecurityAnnual number <strong>of</strong> traffic fatalities and personalinjuries on all roads in <strong>Maryland</strong>The annual number <strong>of</strong> traffic fatalities andpersonal injuries on all <strong>Maryland</strong> roadsincluding MDTA and locally owned facilities(the fatality and personal injury rate iscalculated as fatalities and personal injuriesper 100 million vehicle miles <strong>of</strong> travel)
Martin O’Malley, GovernorAnthony G. Brown, Lt. GovernorDarrell B. Mobley, Acting Secretary7201 Corporate Center DriveHanover, <strong>Maryland</strong> 21076This document is prepared pursuant to <strong>Transportation</strong> Article Section 2–103.1<strong>of</strong> the Annotated Code <strong>of</strong> <strong>Maryland</strong>. Additional copies are available bycalling (410) 865-1277; Toll Free (888) 713-1414; or from theInternet at www.marylandtransportation.com.This document is available in alternative formats upon request.