Investor Presentation (pdf.) - Citycon
Investor Presentation (pdf.) - Citycon
Investor Presentation (pdf.) - Citycon
- No tags were found...

Create successful ePaper yourself
Turn your PDF publications into a flip-book with our unique Google optimized e-Paper software.
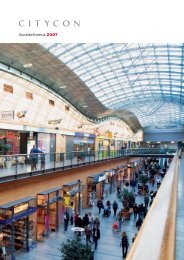
<strong>Citycon</strong> <strong>Presentation</strong>Q3 2010
ContentsStrategyMain points and financial overviewBusiness environmentSustainability(Re)development projectsProperty portfolioKey figuresFinancing overviewBackup information2 Q3 2010
Strategy<strong>Citycon</strong>• wants to be the leading shopping centre owner,operator and developer in the Nordic and Balticcountries.• invests in shopping centres and retail propertiesin major growing cities with gooddemographics.• seeks growth through matching acquisitions andproperty development.• adds value on investment across the portfolioby professional active management producedby in-house strong personnel.• operates by high sustainability standards.• seeks actively joint-venture arrangements withhigh-class investors and manages investment ontheir behalf.• has a strong balance sheet with competitive andwell diversified funding sources and lowfinancial risk exposures.3Q3 2010
Financial targetsContinued expansion through property development andselective acquisitions‣ Cumulative CAPEX since 2005 in excess of EUR 1.5billionGROWTHDIVIDENDSEQUITY RATIO‣ Main emphasis on organic growthSolid distribution policyPayout target 50 % of the result for the period after taxesexcl. fair value changes on property‣For 2009 a per-share dividend was EUR 0.04 and returnfrom invested unrestricted equity fund EUR 0.10‣ EUR 0.14 distribution 7 years in a rowStrong balance sheetInternal long – term equity ratio target around 40 per cent‣ Equity ratio 35.9% as of 30 September 20104 Q3 2010
Main pointsQ3 2010 (vs. Q2 2010)• The fair value change was EUR 15.8 million (EUR 22.9 m) and the market value of property portfolio wasEUR 2,299.9 million (EUR 2,229.5 m)• The valuation yield 6.5% (6.6%) by external appraiser• Net rental income was EUR 33.0 million (EUR 31.8m)• Direct result per share (diluted EPRA EPS) EUR 0.06 (EUR 0.05)Q1-Q3 2010 (vs. Q1-Q3 2009)• Turnover increased by 6.3% to EUR 146.1 million (EUR 137.4m)• Direct result per share (EPRA EPS) EUR 0.15 (EUR 0.17)• Direct result was EUR 33.8 million (EUR 38.4 m)• Like-for-like net rental income decreased by 0.8%, due to higher property operating expenses resultedby exceptionally severe winter and very low indexation-based rental increases• Net cash from operating activities per share EUR 0.09 (EUR 0.24) due to extraordinary and timing items.• Occupancy rate was 94.5% (94.7%)• Profit before taxes EUR 80.8 million (EUR -13.1 m), incl. EUR 39.5 million (EUR -58.7 m) fair value change• <strong>Citycon</strong> has disposed non-core assets for approx. EUR 67.1 million, total gain on sale net of tax EUR 2.2million• The 2010 outlook unchanged:“In 2010, <strong>Citycon</strong>’s turnover is expected to grow by approximately 3–7 per cent and direct operatingprofit by approximately 1–4 per cent compared with the previous year, based on the existing portfolio.The company expects its direct result to be moderately lower than in the previous year. This estimate isbased on completed (re)development projects and the prevailing low inflation level. In addition,properties taken offline for planned (re)development projects will reduce net rental income during theyear. “6Q3 2010
Financing Overview• Total asset stood at EUR 2,424.8 million• Total liquidity of EUR 263.6 million incl. unutilized committed debtfacilities (EUR 177.1 m) and cash (EUR 86.5 m)• Equity ratio 35.9%, hedging ratio of the loan portfolio 80%• Average average year-to-date interest rate was 4.01%.• Period-end average interest rate was 3.93% for fixed rate borrowingsand swaps.• The average loan maturity stood at 3.2 years (3.9 years).• Net financial expenses stood at EUR 41.6 million (EUR 35.8 million)• Two covenants• Equity ratio: Covenant level 32.5%, equity ratio as defined in loanagreements was 38.9%• Interest cover ratio: Covenant level 1.8x, <strong>Citycon</strong>’s period end ICR 2.1x7 Q3 2010
Directed Share Offering - Transaction Summary• <strong>Citycon</strong> issued 22 million new shares by way of an accelerated book-buildingrepresenting approx. 9.9 % of the shares and votes prior to the offering• The offering was over-subscribed leading to a tight discount compared withthe closing price (EUR 2.88) for the <strong>Citycon</strong> share on 21 Sep 2010• Subscription price determined in the book-building was EUR 2.87 leading togross proceeds of EUR 63.1 million which will initially be used to repayinterest-bearing debt• Transaction rationale• Stronger balance sheet with equity ratio closer the long term target andmore in line with the European peers• Enhance financial flexibility and increase liquidity• Enable redevelopment investments and potential acquisitions in line withthe startegy of the company• New shares listed on the official list of NASDAQ OMX Helsinki Ltd on Friday 24September 20108 Q3 2010
Business Environment9 Q3 2010
Business EnvironmentGDPPRIVATE CONSUMPTION3,5%3,0% 3,5% 4,2%2,8% 3,1%4,2% 4,5% 4,0%3,2%1,8% 0,9%2,6%2,4% 3,0% 3,0% 2,5% 2,5%4,5% 4,8% 4,0% 5,0%Finland Sweden Estonia Lithuania-5,1%-0,8%-0,7%-1,9% Finland Sweden Estonia Lithuania-3,5%-8,1%-14,1% -14,8%-18,4%-16,8%2009A 2010E 2011E 2012E2009A 2010E 2011E 2012ESource: Nordea10 Q3 2010
SustainabilityLeed® Platinum shopping centre Liljeholmstorget in Stockholm14 Q3 2010
Strategical Goals for Environmental Impact Areas15Climate changeReduction of greenhouse gas emissions by 20% by year 2020 from the 2009baseline level (the EU objective is to reduce emissions by 20% by 2020 fromthe 1990 level).EnergyReduction of energy consumption (electricity and heat) by 9% by 2016 from the 2009levelImprovements in energy efficiencyFinding renewable energy solutions.WaterKeeping water consumption on an average level of less than 3.5 litres pervisitorWaste management and recyclingShopping centre waste recycling rate to be raised to at least 50% by 2015Reduction of landfill waste to a maximum of 30% of total waste volume by 2015Land use and sustainable project developmentAll development projects to be implemented in accordance with environmentalclassification principlesDevelopment projects are located in built-up environments, within reach of goodtransport connectionsQ3 2010
Key Results 2009Emissions• 31,801 tnCO2e equals:• 13.5 million litres petrol or• 0.04 % of Finland’s total emissions (2007) or 0.05 of Sweden’s total emissions (2007)• To offset the emissions, one needs to plant 103,000 trees in the habitat of Northern Europe,this correlates area of 88 soccer fields or area of 1.9 x Central Park, New York or area of 4.5 xHyde Park, London• 0.03 tnCO2e/GLAEnergy consumption• Electricity consumption in shopping centres average 73.6 kWh/gross sq.m. and 17.2kWh/m 3 (average in Finnish SC 30.0 kWh/m 3 , source: Motiva’s energy inspection database)• Heat consumption in shopping centres average 88.2 kWh/gross sq.m. and 20.6 kWh/m 3 (average inFinnish shopping centre 26.2 kWh/m 3 , source: Motiva’s energy inspection database)Water consumption• Average 3.9 l/visitor/year• In Finland and the Baltic Countries the consumption goal less than 3.5 l/visitor is reached. In Swedenthe high number of apartments in shopping centres increases the average water consumption.Waste management• Average recycling rate 48.5%, share of the waste send to landfill average 39.1%• A total of 16 of <strong>Citycon</strong>’s shopping centres already exceed the target recycling rate of 50% and 12centres managed to achieve the target of sending maximum 30% of waste to landfill.16Q3 2010
Key ResultsLand use and Sustainable project development• Liljeholmstorget was awarded as the first European shoppingcentre the Platinum-level LEED® environmental certificate• Rocca al Mare was awarded silver-level LEED®certificate first in theBaltic Countries in January 2010• The first ever LEED®certificate in the Nordic countries was awardedto Trio shopping centre• All new development projects will be carried out in accordancewith the quality criteria of environmental certificates• <strong>Citycon</strong> one of the founding members of Green Building Council,Finland established in April 201017Q3 2010
Internal Green Shopping Centre Management ProgramTool for Shopping Centre ManagementInternalbenchmark• Energy• Water• Waste• Refrigerants• Transport• Procurement• Training• Marketing• Monitoring• Greenthinking inaction• RecognitionofDevelopmentareas18Q3 2010
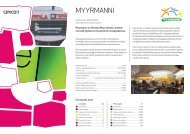
(Re)development ProjectsFuture image of Myllypuro shopping centre in Helsinki19 Q3 2010
Ongoing (Re)development ProjectsPROPERTY LOCATION AREA,sq.m.before andafterÅkersbergaCentrumÖsteråker,SWEMartinlaakso Vantaa, FIN 3 8007 300MyllypuroHelsinki,FINTOTALESTIMATEDNEWINVESTMENT,MEURACTUALCUMULATIVE CAPEX, bythe end ofperiod,MEURExpected yieldon completionwhenstabilized, % 1)EST.FINALYEAR OFCOMPLETION20 00032.9 7.3 2011 Refurbishment and extension of the shopping27 000 51.1 2) centre in the Greater Stockholm area.<strong>Citycon</strong> owns 75%, minority owner/investor(25%) local municipality-owned real estatecompany.7 7007 300Espoontori Espoo, FIN 16 50016 400ForumJyväskylä,FIN26.3 4.7 7.4 2011 Building of a new retail centre replacing theexisting one next to the Martinlaakso railwaystation.20.0 10.1 7.4 2012 Building of a new retail centre replacing theexisting one next to the Myllypuro subwaystation.25.8 15.1 6.9 2010 Refurbishment of 10400 sq.m. of interiorpremises and the parking facility.15 100 16.0 8.8 11.2 2010 Refurbishment of interior premises (12 000sq.m) of the shopping centre.Hansa (Trio) Lahti, FIN 8 000 8.0 4.0 6.6 2011 The refurbishment of Hansa property locatednext to Trio.Myyrmanni Vantaa, FIN 8 400 4.8 3.3 2010 Refurbishment of the 1 st floor premises andtenant improvements on the ground floor.KirkkonummenliikekeskusKirkkonummi, FIN5 000 4.0 1.3 2010 Refurbishment of the retail centre.Isolinnankatu Pori, FIN 7 600 3.0 1.5 2010 Refurbishment of the retail premises in twophases.201) Yield on completion,% = Expected stabilized (third year after completion) net rents incl.possible vacancy / total investment (=total capital invested in property by <strong>Citycon</strong>)2) Calculated based on period end exchange rates. Estimated total investment in SEK has not changed from the year end 2009 (which was EUR 45.6 million).
Property PortfolioExtension part of Åkersberga Centrum in Österåker21 Q3 2010
Property Portfolio• 3,793 (4,033) leases with an average length of 3.2 (3.0) years• GLA totalled 931,480 sq.m.• Net rental income increased by 1.7% to EUR 95.4 million• Net rental income for like-for-like properties decreased by 0.8% (excl.impact of strengthened Swedish krona) due to higher property operatingexpenses reflecting seasonal fluctuations and exceptionally cold andsnowy winter, slightly increased vacancy and very low indexation-basedrental increasesLike-for-like properties accounted for 60.0% of the total portfolio and of l-f-l portfolio 76.9% is in Finland and70.9% of the total Finnish portfolio is included in l-f-l. Shopping centres represent 83.6% of the l-f-lportfolio.• Rolling 12-month occupancy cost ratio for l-f-l shopping centres was 8.5%• Occupancy rate 94.5% (94.7%)• Rents linked to CPI (nearly all the agreements). Year-end, 36.0% (200824.2%) of rental agreements were also tied to tenant’s turnover•In 2009, approx. 1% of net rental income came from turn-over based part of therental agreements22 Q3 2010
Like-for-like and other NRI development by Segments-1-9/2009 vs. 1-9/2010EUR million Finland Swedenthe BalticCountries Other Total1-9'2008 68,2 18,8 4,6 0,0 91,6Acquisitions - - - 0,0 0,0(Re)developments 1,2 0,1 2,9 0,0 4,3Divestments -0,2 0,0 0,0 0,0 -0,2Like-for-like 0,2 0,5 -0,3 0,0 0,4Other (incl. exch. diff.) -0,1 -2,2 0,1 0,0 -2,31-9'2009 69,4 17,1 7,3 0,0 93,8Acquisitions - - - - 0,0(Re)developments -4,0 3,2 1,6 0,0 0,8Divestments -0,2 -0,3 - 0,0 -0,5Like-for-like -0,5 0,2 -0,2 0,0 -0,6Other (incl. exch. diff.) 0,1 1,9 0,0 0,0 1,91-9'2010 64,7 22,1 8,7 0,0 95,4‣ Approximately 21,000 sq.m. (on average during 9months) more space off-line due to redevelopmentprojects in Myyrmanni, Espoontori, Forum, Hansa,Myllypuro, Kirkkonummen liikekeskus, PorinIsolinnankatu and Martinlaakso.‣ Residentialtowers inJakobsberg movedto divestments.‣ Rental discounts in the LFL properties(Mandarinas + Magistral) higher by0.2M€ in 1-9'10 than in 1-9'09. LFLgrowthwas -15.3% in the BalticCountries.‣ LFL negative in Finland as approximately 4,000 sq.m.higher vacancy, low indexation and colder winter(heating and snow cleaning 0.8M€). LFL-growth was -1.0% in Finland.23Q3 2010‣LFL-growth was+1.3 % in Sweden.‣Stronger SEKcontributed to NRIpositively by1.9M€.
Property PortfolioRENTAL CONTRACTSILLUSTRATION OF A TYPICAL LEASE AGREEMENT• Major tenants largest grocery retailer in Nordicsalso fashion tenants and local discount departmentstores are important.• Largest tenant Finnish retailer Kesko with23.2% of GRI end of 2009• Five largest totaled 35.6% of GRI and includeKesko, S-Group, Stockmann, ICA, H&M• Annualised rental value for the portfolio was EUR202.8 millionIncludes annualised gross rent based on validrent roll on end of year, market rent of vacantpremises and rental income from turn overbased contracts and possible other rentalincome. Temporary rental rebates are included.• Actual rental contract level vs. valuation marketrents +1.3%Indicates how much higher <strong>Citycon</strong>’s actualrental level is compared to the market rentsapplied in the external valuation.24 Q3 2010
Property PortfolioTOTAL PORTFOLIO Q3/2010 Q3/2009 Q2/2010 2009Number of leases startedduring the period184 140 175 873Total area of leases started,sq.m. 1) 33 341 23 789 36 256 141 628Average rent of leases started(EUR/sq.m.) 1) 17.5 20.7 17.2 23.6Number of leases ended duringthe period408 187 185 781Total area of leases ended,sq.m. 1) 42 107 40 798 54 801 127 730Average rent of leases ended(EUR/sq.m.) 1) 14.2 17.2 14.2 17.5Average rent (EUR/sq.m.) 20.4 19.6 20.3 19.7Occupancy rate at the end ofperiod, %94.5 94.7 94.6 95.01) Leases started and ended do not necessarily refer to the same premises25 Q3 2010
Valuation Yield Development in the Portfolio%8,587,576,56FinlandFinland excl. Iso OmenaSwedenBaltic CountriesTotal5,55Q42006Q12007Q22007Q32007Q42007Q12008Q22008Q32008Q42008Q12009Q22009Q32009Q42009Q12010Q22010Q32010Valuation yield above is based on external valuator’s portfolio valuation.26Q3 2010
Shopping Centre Rental Income by Branches Based onValid Rent Roll at 31 Dec. 20097 %2 %9 %10 %8 %23 %22 %Clothes and FashionGroceriesLeisure, Home SuppliesDepartment StoresServices and OfficesCafes & RestaurantsHealth & BeautyOther Specialty Stores19 %27 Q3 2010
Sales Area by Branch for Each Cluster<strong>Citycon</strong> has classified the Finnish shopping centres into threecluster according to their role in a consumer’s life.28 Q3 2010
Key FiguresLeed® Silver shopping centre Rocca al Mare Tallinnassa29 Q3 2010
Snapshot of Statement of Comprehensive IncomeEUR million Q1-Q3/2010 Q1-Q3/2009 2009Gross rental income 138.5 132.6 177.8Service charge income 7.6 4.8 8.5Turnover 146.1 137.4 186.3Property operating expenses 49.5 43.2 60.2Other expenses from leasing operations 1.1 0.4 0.7Net rental income 95.4 93.8 125.4Administrative expenses 15.5 12.4 17.8Net Fair value gains/losses on investment property 39.5 -58.7 -97.4Net Gains on sale of investment property 2.8 0.1 0.1Operating profit/loss 122.3 22.7 10.3Net Financial income and expenses -41.6 -35.8 -47.7Profit/loss before taxes 80.8 -13.1 -37.5Current taxes -5.9 -5.3 -6.5Change in deferred taxes -2.3 5.8 7.0Profit/loss for the period 72.6 -12.6 -36.9Other comprehensive expenses/income for the period, net tax -5.5 -3.7 -3.0Total Comprehensive profit/loss for the period, net of tax 67.2 -16.3 -39.9EPS (basic), EUR 0.29 -0.05 -0.16EPS (diluted), EUR 0.28 -0.05 -0.16Direct Result 33.8 38.4 50.9Indirect result 30.1 -48.9 -85.2Direct EPS (diluted), EUR (EPRA EPS) 0.15 0.17 0.23Net cash from operating activities per share, EUR 0.09 0.24 0.30Profit/loss for the period attributable to parent companyshareholders63.9 -10.5 -34.330Q3 2010
Snapshot of Statement of Financial PositionStatement of Financial Position, EUR million 30 Sept 2010 30 Sept 2009 31 Sept 2009Investment property 2,299.9 2,162.7 2,147.4Total non-current assets 2,313.5 2,173.3 2,161.4Current assets 111.3 34.1 91.8Assets total 2,424.8 2,207.4 2,253.2Total shareholder’s equity 870.2 791.3 767.9Total liabilities 1,554.6 1,416.1 1,485.3Liabilities and share holders equity 2,424.8 2,207.4 2,253.2KEY FIGURESEquity ratio, % 35.9 35.9 34.2Gearing, % 153.4 159.5 169.5Equity per share, € 3.36 3.41 3.31Net Asset value (EPRA NAV) per share, € 3.58 3.64 3.54EPRA NNNAV, € 3.37 3.46 3.35Net Rental Yield (actual), % 5.9 6.1 6.1Average Net Yield Requirement (valuation yield by 6.5 6.6 6.6external appraiser)31Q3 2010
Consolidated Cash Flow Statement Q1-Q3/2010EUR MILLIONJan-Sep2010Jan-Sep2009Operating activitiesProfit before taxes 80,8 -13,1Adjustments -0,2 94,9Depreciation and impairment 0,5 0,5Valuation of investment property -39,5 58,7Gains/losses on sale -2,8 -0,1Net financial expenses 41,6 35,8Other 0,0 0,0Change in working capital -3,5 6,7Cash generated from operations 77,2 88,6Interest and other financial charges paid -42,7 -41,8Interest and other financial income received 0,2 0,2Realized exchange rate losses and gains -5,4 11,2Taxes paid -9,7 -5,1Cash flows from operating activities (A) 19,5 53,1• Cash from operations continue to be behind the previous yeardue to exceptional items both in 2010 and 2009:• Cash flow before working capital declined by approximately1.4%• Difference in realized FX gains between 2010 and 2009 wasEUR 16.6 million• Difference in change of working capital between 2010 and2009 was EUR 10.2 million• Paid taxes in 2010 were EUR 4.7 million higher due to timingdifferences in tax payments between financial years 2009 and 2010Investing activitiesCapital expenditure on PP&E and intangible assets -96,4 -78,1Sale of investment property 66,1 3,1Cash flows from investing activities (B) -30,3 -75,0Financing activitiesSale of treasury shares 0,2 -Proceeds from share issue 63,1 -Share subscriptions based on stock options 3,3 -Proceeds from short-term loans 101,0 103,6Repayments of short-term loans -174,4 -47,1Proceeds from long-term loans 270,5 214,1Repayments of long-term loans -156,2 -215,9Dividends and return from uninvested equity restricted fund -31,0 -30,9Cash flows from financing activities (C) 76,6 23,7Net change in cash and cash equivalents (A+B+C) 65,9 1,8Net cash from operating activities per share, EUR 0,09 0,24• Investment focus the on-going development projects• Proceeds from residential disposal in Åkersberga were received inQ3 2010• Investments into on-going development projects in Q3 2010 wereEUR 42.9 million• Cash flow per share below previous year due to above mentionedreasons and stood at 0.09 euros per share• Without the negative impact from working capital and realized FXlosses the cumulative cash flow per share would have beenapproximately EUR 0.1332 Q3 2010
Key Figures – Financing OverviewMaturity profile of loans and derivativesInterest-bearing debt by fixing typeEUR 1, 429.6 million 1)600Loans (EUR 1,429.6m)5004003002001004255Fixed derivatives (EUR 892.9m)2007012090501Convertible Bonds(EUR 71.3m)242309208257229Floating rate debt20%Fixed rate swaps62%Fixed rate debt18%02010 2011 2012 2013 2014 2015-• During third quarter in 2010, the period-end interest-bearing net debt decreased by EUR 35 million as a result ofthe share issue of EUR 63 million carried out in September• High hedging ratio at 80% . No new hedges in Q3 and higher hedge ratio on a net debt basis• Conservative financing policy continues; average loan maturity at 3.2 years and average time to fixing at 3.0years• Refinancing not a problem - <strong>Citycon</strong> has demonstrated its access to both equity and debt markets in 2010. Totalavailable liquidity increased in Q3 to EUR 263.6 million and covers all approved investment needs of the company33 Q3 20101) Carrying value of debt as at 30 Sept 2010 was EUR 1,421.3 million. The difference between fair and carryingvalue equals the capitalized fees of long term loan facilities and convertible bond issue as well as to the equitycomponent of the convertible bond which is recognized under equity.
Key Figures – Financing Overview500450400350300250200150100500Maturity profile of fixed and floating rate loans andundrawn committed credit limits420 3Fixed (EUR 256.4m)4,3 %4,2 %Floating (EUR 1,173.2m)4,1 %4,03 % 4,05 %Undrawn credits (EUR 177.1m)Average 3.90%4,0 %1983279315472429Convertible Bonds(EUR 71.3m)2010 2011 2012 2013 2014 2015-4626310914820Period-end interest rate by maturity for fixed rate debtand swaps3,9 %3,8 %3,7 %3,6 %3,5 %3,4 %3,80 %4,19 %3,76 %3,67 %2010 2011 2012 2013 2014 2014-• Favorable maturity structure of debt as the bulk of <strong>Citycon</strong>’s debt is due on or after 2013• Available committed undrawn credits are also of long term nature and will fall due in 2012 and2015• Period-end average interest rate was 3.93% for fixed rate borrowings and swaps (Q2 2010: 3.90% )34 Q3 2010
Key Figures - Debt PortfolioBreakdown by debt typeEUR 1,429.6 million 1) Syndicated term loansBreakdown by currencyEUR 1,429.6 million 1)Other29%40%LTL 1%EEK 3%EUR58%CP3%SEK38%Revolving credit facility20%Bonds8%• The backbone of the debt financing continues to be the syndicated term and revolving facilities togetherwith the bonds issued which comprise of 69 % of the debt portfolio• For nine-months period ending 30 Sept 2010 the average year-to-date interest rate was 4.01 % (Q2/2010:4.00 %) and the period-end current run rate stayed below 4 % at 3.93 %• <strong>Citycon</strong> had as at period-end total liquidity of EUR 263.6 million which comprised of unutilized committeddebt facilities amounting to EUR 177.1 million and cash EUR 86.5 million. Excluding CP’s <strong>Citycon</strong>’s liquiditywas EUR 226.7 million35 Q3 20101) Carrying value of debt as at 30 Sept 2010 was EUR 1,421.3 million. The difference between fair and carrying value equals the capitalized fees of long term loan facilities andconvertible bond issue as well as to the equity component of the convertible bond which is recognized under equity.
Key Figures – Interest Rates and LTVQuarterly development of interest rates 1) Net debt and LTV-% 2)5,50 %5,00 %4,50 %4,00 %3,50 %3,00 %2,50 %2,00 %1,50 %1 4001 3001 2001 1001 000900800700652,3878,2811,2783,3863,31205,3 1221,1 1184,31194,6 1191,31147,3 1149,41272,31234,81 312,2 1 327,2 1 369,61 343,170 %60 %50 %40 %30 %20 %1,00 %Q1-06Q2-06Q3-06Q4-06Q1-07Q2-07Q3-07Q4-07Q1-08Q2-08Q3-08Q4-08Q1-09Q2-09Q3-09Q4-09Q1-10Q2-10Q3-10600Q1-06608,5Q2-06Q3-06Q4-06Q1-07Q2-07Q3-07Q4-07Q1-08Q2-08Q3-08Q4-08Q1-09Q2-09Q3-09Q4-09Q1-10Q2-10Q3-1010 %Average interest rate, % Period-end interest rate, % Period-end 6-month euribor, %Fair value of net debt, EURm LTV, %• Interest rates feed through income statement with certain lag and <strong>Citycon</strong>’s third quarter average interestrate moved modestly higher to 4.01 per cent• Period-end run rate also inched a bit higher and stood at 3.93 per cent. The declining trend in interestrates has now stopped and short term EUR and SEK rates have already started climbing upwards• <strong>Citycon</strong>’s LTV-% decreased clearly below 60 per cent due to fair value gains of investment properties andnew equity from the share issue. LTV was 58.4 per cent as of 30 September 20101) Average interest rate calculated based on the year-to-date income statement interest expenses divided by weighted average interest bearing debt year-to-date. Period-end interest rate is the run rate based onthe actual interest rates on floating and fixed rate debt prevailing on the balance sheet date taking into account interest rate swaps. Both interest rates include applicable credit margins.2) LTV-% calculated as fair value of net debt divided by the appraised value of investment properties on the balance sheet date.36 Q3 2010
7,006,005,004,003,002,001,000,00Share Performance 1)37Q3 20101) Starting values of FTSE EPRA index and OMX Helsinki CAP index on 3 January 2006 have been rebased to <strong>Citycon</strong> share price at EUR 3.03FTSE EPRA Nasdaq OMX Helsinki CAP <strong>Citycon</strong>
Ownership• End of June market capitalization totaled EUR765.5 million• 86.0 % of shareholders international• Number of domestic owners increased• 4,793 registered shareholders• Largest Shareholders:• Gazit-Globe 47.% (source: www.gazitglobe.com)• <strong>Citycon</strong> is included in GPR 250 PropertySecurities Index. The index includes 250 themost liquid property companies worldwide• <strong>Citycon</strong> is also included in e.g. FTSEEPRA/NAREIT Global Real Estate Index38 Q3 2010
Backup InformationFuture image of shopping centre Forum in Jyväskylä39 Q3 2010
Completed ProjectsLILJEHOLMSTORGETConstruction of a new shopping centresouth west of Stockholm city centre.Location is the major traffic hub. Existingbuilding is totally refurbished, new centreis built adjacent to subway station. LEED® -platinum certified!Retail GLA, sq.m. 28,400Office and health care centreGLA, sq.m. 12,300Parking hall with 900 spaces, sq.m 32,400Total new investment, EUR m 154.8 1)Actual cumulative CAPEXend of period, EUR m 154.8Expected yield on completionwhen stabilized, % 6.2Completion October 2009Yield on completion,% = Expected stabilized (third year after completion) net40rents incl. possible vacancy / total investment (=totalcapital invested in the property by <strong>Citycon</strong>)Q3 20101) Does not incl. the apartments to be sold. Calculated based on period end exchangerates. Estimated total investment in SEK has not changedfrom the year end 2009 (which was EUR 138 million).
Completed ProjectsROCCA AL MAREExtension and redevelopment of existingcentre west of Tallinn city centre. After theproject Rocca al Mare is the largest centresin Estonia and <strong>Citycon</strong> took over almost aquarter of the Tallinn shopping centre market.Anchor tenant largest Prisma hypermarket inEstonia. LEED® -silver certified! Original estimateinvestment totalled EUR 68.0 million.Original GLA, m 2 28,600Post-development area (GLA), m 2 53,500Total Estimated new investment, EUR m 53.8Actual cumulative CAPEX endof period, EUR m 53.8Expected yield on completionwhen stabilized, % 9.9Completion November 2009Yield on completion,% = Expected stabilized (third year aftercompletion) net rents incl. possible vacancy / total investment(=total capital invested in the property by <strong>Citycon</strong>)41 Q3 2010
Net Financial Expenses Q2 2010 vs Q3 201016+0.1-0.0-0.3 -0.31414,414,01210864202Q2010 Net interest Fees DerivativevaluationOther3Q201043Q3 2010
Illustrative Calculation of ICR Covenant Using Q3 2010Financials*Q3 2010 EBITDA for covenantcalculation: direct operating profit+ depreciations +/- non-cash andexceptional itemsEBITDA = EUR 107.0 + EUR 0.7 +EUR 1.8= EUR 109.5 million for rolling 12-month periodEUR million Q3 Q2 Q1 Q4 CumulativeDirect result 2010 2010 2010 2009 12-monthsNet rental income 33,0 31,8 30,6 31,6 127,1Direct administrative expenses -5,0 -5,5 -4,3 -5,3 -20,2Direct other operating income and expenses 0,1 0,0 0,1 0,0 0,1Direct operating profit 28,0 26,3 26,4 26,3 107,0Direct net financial income and expenses -14,0 -14,2 -12,9 -11,9 -52,9Direct current taxes -1,5 -1,4 -1,8 -1,2 -5,9Direct change in deferred taxes 0,1 -0,1 0,1 -0,1 0,0Direct minority interest -0,3 -0,6 -0,4 -0,6 -1,9Total direct result 12,3 10,1 11,4 12,5 46,3Q3 2010 ICR= (109.5/52.4)= 2.1Q3 2010 Net financials for covenantcalculation: direct net financials –non-cash option amortization fromconvertible +/– other adjustmentsincl. FX gains or lossesNet financials = EUR 52.9 - EUR 1.5+ EUR 1.0= EUR 52.4 million for rolling 12-month period44 Q3 2010* All number are approximations
Illustrative Calculation of Equity Ratio Covenant Using Q32010 Financials*Equity for covenant calculation:total shareholders’ equity +subordinated debt – minorityinterest +/– fair value of derivativesincluded in equityEquity = EUR 870.2 + EUR 65.8 –EUR 48.1 + EUR 30.5= EUR 918.4 million as at 30 Sept2010EUR million Q3 Q3Liabilities and shareholders' equity 2010 2009Shareholders' equityShare capital 259,6 259,6Share premium fund 131,1 131,1Fair value reserve -30,5 -23,4Invested unrestricted equity fund 199,0 155,2Retained earnings 262,8 231,6Total equity attributable to parent company shareholders 822,1 754,1Minority interest 48,1 37,3Total shareholders' equity 870,2 791,3Total liabilities 1 554,6 1 416,1Equity ratio on 30 Sept2010= (918.4/2,362.5) = 38.9%Total balance sheet for covenantcalculation:Equity (as definedabove) + total liabilities –subordinated debt +/ – fair value ofderivatives and other adjustments45 Q3 2010* All number are approximationsTotal balance sheet = EUR 918.4 +EUR 1,554.6– EUR 65.8 – EUR 44.7= EUR 2,362.5 million as at 30 Sept2010
<strong>Citycon</strong> in brief - Background<strong>Citycon</strong>’s path to becoming the market leader and an international real estate company1988• Quoted on the Main List ofHelsinki Stock Exchange Officeportfolio1998• Focus on Retail• Two large Retail portfolioacquisitions• Office portfolio divested• Outsourced propertymanagement1999• Acquisition of 13 shoppingcentres2003• Property portfolio expandsconsiderably• <strong>Citycon</strong>’s ownership basechanges• International investors becomeinterested in <strong>Citycon</strong>2004• <strong>Citycon</strong> continues to growth• Ownership structure becomesvery international• Analysing potential for entryinto the Baltic countries andScandinavia2005• <strong>Citycon</strong> enters foreignmarkets by acquiring its firstproperties in Sweden andEstonia• Increases holdings in a numberof Finnish shopping centres2006• <strong>Citycon</strong> continues to expandacquiring several retailproperties especially in Swedenand its first property in Lithuania• The disposal of non-coreproperties2007• New acquisitions in Finland and Sweden• Liljeholmen and Rocca al Mare projectstarted• <strong>Citycon</strong> acquires Iso Omena2008• The company sells 40% of Iso Omena toGIC.• <strong>Citycon</strong> puts more emphasis on green,sustainable construction andredevelopment2009• Trio gets the first LEED- certificate in theNordic Countries• Sells non-core assets, apartments, inSweden and starts the (re)developmentproject in Åkersberga.• Liljeholmstorget and Rocca al Mare(re)developments completed46 Q3 2010
First Possible Termination Year of the Leases by Contract Type,31 Dec 200935,030,025,020,015,0Valid until furthernoticeInitially fixed-termcontractFixed-term contract10,05,00,02010 2011 2012 2013 2014 2015 2016 2017 2018 2019 2020+Fixed-term contracts expire at the end of the contract period, after which will be negotiated on a potential new lease agreement.Contracts valid until further notice are valid for the time being and their typical notice period extends from 3 to 12 months.Initially fixed-term contracts include the first possible termination date, after which the contract period may continue either until further noticeor for a rolling fixed-term period of time. A rolling fixed-term contract means that if the agreement is not terminated to expire at the end of thefirst contract period, it continues for another agreed period, typically from 12 to 36 months, at a time. The contract can only be terminated to47expire at the end of the agreed period. The notice period is generally from 3 to 12 months.Q3 2010
<strong>Citycon</strong> Core Shopping CentresFinlandIso OmenaBuilt 2001GLA 61.300 m 2Ownership 60 %Koskikeskus198826.300 m 288 %Myyrmanni199440.300 m 2100 %Forum1953/9117.500 m 2<strong>Citycon</strong> 69 %Trio (incl. Hansa)1977/87/200845.700 m 289.3 %Columbus1997/0721.000 m 2100 %Lippulaiva199323.400 m 2100 %Sweden Baltic CountriesLiljeholmstorget200940.700 m 2100 %Rocca al MareEstonia1998/200953.500 m 2100 %Stenungstorg1967/9336.400 m 285 %MandarinasLithuania20058.000 m 2100 %Åkersberga Centrum1985/9630.500 m 275 %Tumba Centrum1952/200231.300 m 2100 %MagistralEstonia20009.500 m 2100 %Strömpilen1927/199727.000 m 275 %JakobsbergsCentrum1959/9369.300 m 2100 %48 Q3 2010
Contact InformationINVESTOR RELATIONSMr Petri OlkinuoraCEOTel. +358 207 664 401Petri.Olkinuora@citycon.fiMr Eero SihvonenCFO, Executive Vice PresidentTel. +358 50 5579 137Eero.Sihvonen@citycon.fiMs Hanna JaakkolaIROTel. +358 40 5666 070Hanna.Jaakkola@citycon.fi49 Q3 2010
DisclaimerThis document and the information contained herein is strictly confidential and is being provided to you solely for your information. Thisdocument may not be retained by you and neither this document nor the information contained herein may be reproduced, further distributedto any other person or published, in whole or in part, for any purpose.These materials do not constitute an offer or solicitation of an offer to buy securities anywhere in the world. No securities of <strong>Citycon</strong> Oyj (the“Company”) have been or will be registered under the U.S. Securities Act of 1933, as amended (the “Securities Act”). Certain ordinary shares ofthe Company have been offered to “qualified institutional buyers” (as such term is defined in Rule 144A (“Rule 144A”)) under the Securities Act,in transactions not involving a public offering within the meaning of the Securities Act. Accordingly, such shares are “restricted securities” withinthe meaning of Rule 144 and may not be resold or transferred in the United States, absent an exemption from SEC registration or an effectiveregistration statement. There will be no public offering of the securities in the United States.Subject to certain exceptions, neither this document nor any part or copy of it may be taken or transmitted into the United States or distributed,directly or indirectly, in the United States, or to any “U.S. Person” as that term is defined in Regulation S under the Securities Act. Neither thisdocument nor any part or copy of it may be taken or transmitted into Australia, Canada or Japan, or distributed directly or indirectly in Canada ordistributed or redistributed in Japan or to any resident thereof. Any failure to comply with this restriction may constitute a violation of U.S.,Australian, Canadian or Japanese securities laws, as applicable. The distribution of this document in other jurisdictions may also be restricted bylaw, and persons into whose possession this document comes should inform themselves about, and observe, any such restrictions.This document is not intended for potential investors and does not constitute or form part of any offer to sell or issue, or invitation to purchaseor subscribe for, or any solicitation of any offer to purchase or subscribe for, any securities of the Company, nor shall it or any part of it or the factof its distribution form the basis of, or be relied on in connection with, any contract or investment decision.No representation or warranty, express or implied, is made or given by or on behalf of the <strong>Citycon</strong> Oyj (the “Company”), or any of theirrespective members, directors, officers or employees or any other person as to, and no reliance should be placed upon, the accuracy,completeness or fairness of the information or opinions contained in this document or any other information discussed orally. None of theCompany or any of their respective members, directors, officers or employees or any other person accepts any liability whatsoever for any losshowsoever arising from any use of this presentation or its contents or otherwise arising in connection therewith.This presentation includes forward-looking statements. The words “believe,” “expect,” “anticipate,” “intend,” “may,” “plan,” “estimate,” “will,”“should,” “could,” “aim,” “target,” “might,” or, in each case, their negative, or similar expressions identify certain of these forward-lookingstatements. Others can be identified from the context in which the statements are made. By their nature forward-looking statements are subjectto numerous assumptions, risks and uncertainties. Although we believe that the expectations reflected in these forward-looking statements arereasonable, actual results may differ materially from those expressed or implied by the forward-looking statements. We caution presentationparticipants not to place undue reliance on the statementsThe information and opinions contained in this presentation are provided as at the date of this presentation and are subject to change withoutnotice. Such information and opinions have not been independently verified.By attending the presentation you agree to be bound by the foregoing limitations.50 Q3 2010