Download the UK Renewable Energy Roadmap - Seanergy 2020
Download the UK Renewable Energy Roadmap - Seanergy 2020
Download the UK Renewable Energy Roadmap - Seanergy 2020
- No tags were found...

You also want an ePaper? Increase the reach of your titles
YUMPU automatically turns print PDFs into web optimized ePapers that Google loves.
July 2011<strong>UK</strong> <strong>Renewable</strong> <strong>Energy</strong><strong>Roadmap</strong>
<strong>UK</strong> <strong>Renewable</strong> <strong>Energy</strong> <strong>Roadmap</strong>ContentsExecutive Summary ................................................................................................... 5Chapter 1: Introduction .............................................................................................. 9Chapter 2: Analysis ................................................................................................. 13Chapter 3: Actions ................................................................................................... 27Onshore wind ....................................................................................................... 30Offshore wind ....................................................................................................... 42Marine <strong>Energy</strong> ...................................................................................................... 58Biomass Electricity ................................................................................................ 67Biomass Heat ....................................................................................................... 79Ground source heat pumps and air source heat pumps ....................................... 89<strong>Renewable</strong> <strong>Energy</strong> in Transport ........................................................................... 97Chapter 4: Supporting delivery ............................................................................... 1052
<strong>UK</strong> <strong>Renewable</strong> <strong>Energy</strong> <strong>Roadmap</strong>Ministerial ForewordThe nations of <strong>the</strong> United Kingdom are endowed with vast and varied renewableenergy resources. We have <strong>the</strong> best wind, wave and tidal resources in Europe.The <strong>UK</strong> leads <strong>the</strong> world in offshore wind, with more than 700 turbines alreadyinstalled, and is accelerating <strong>the</strong> deployment of onshore wind with <strong>the</strong> biggestprojects in Europe already operating and under construction in Scotland and Wales.Taken toge<strong>the</strong>r onshore and offshore wind provide enough power for more than twoand a half million homes. But we could do so much more. Our challenge is to bringcosts down and deployment up.This document – <strong>the</strong> <strong>UK</strong>’s first <strong>Renewable</strong> <strong>Energy</strong> <strong>Roadmap</strong> – sets out our sharedapproach to unlocking our renewable energy potential.This <strong>UK</strong> <strong>Roadmap</strong> builds on <strong>the</strong> actions already underway: financial supportmechanisms for renewables, <strong>the</strong> Green Investment Bank to help companies secureinvestment in green infrastructure, and encouraging <strong>the</strong> development of newoffshore wind manufacturing facilities at port sites.The Government’s Electricity Market Reform White Paper, published alongside this<strong>Roadmap</strong>, sets out our reforms to <strong>the</strong> separate Great Britain and Nor<strong>the</strong>rn Irelandmarkets for all forms of electricity generation. Reform will ensure that low-carbonelectricity from a diverse range of sources - not just renewables - becomes a moreattractive choice for investors, delivering long-term change while minimising cost to<strong>the</strong> consumer.<strong>Renewable</strong> energy isn’t just about electricity. This year, we worked toge<strong>the</strong>r to create<strong>the</strong> world’s first incentive to support <strong>the</strong> widespread deployment of renewable heat.This new financial mechanism will encourage installation of equipment like heatpumps and biomass boilers – reducing emissions and supporting 150,000 jobs in<strong>the</strong> <strong>UK</strong>’s heating industry.Likewise, <strong>the</strong> <strong>Renewable</strong>s Transport Fuels Obligation and support of over£400million to increase uptake of ultra-low carbon vehicles will help to reduce <strong>the</strong>carbon impact of transport. The <strong>UK</strong> Government will also be publishing a BioenergyStrategy by <strong>the</strong> end of this year to give a clear signal on <strong>the</strong> most cost-effective andsustainable role for bioenergy in heat, transport and electricity, which between <strong>the</strong>mcould contribute around half of <strong>the</strong> overall <strong>2020</strong> target.We also recognise <strong>the</strong> need to reduce demand. <strong>Energy</strong> efficiency is <strong>the</strong> most costeffective way of closing <strong>the</strong> gap between supply and demand, which is why we havelaunched <strong>the</strong> Green Deal and <strong>the</strong> roll out of smart meters in Great Britain. Much isalready being done across <strong>the</strong> <strong>UK</strong> yet <strong>the</strong>re are o<strong>the</strong>r opportunities to tap into energyefficiency potential, which will be a key area of work for <strong>the</strong> new Office of National<strong>Energy</strong> Efficiency working alongside <strong>the</strong> Office for <strong>Renewable</strong> <strong>Energy</strong> Deployment inpartnership with <strong>the</strong> Devolved Administrations.3
<strong>UK</strong> <strong>Renewable</strong> <strong>Energy</strong> <strong>Roadmap</strong><strong>Renewable</strong> energy already employs more than a quarter of a million people; by<strong>2020</strong>, it could be over half a million. The creation of jobs in <strong>the</strong> renewable energysector, investment in new manufacturing capability, and <strong>the</strong> consequent direct andindirect benefits will support our transition to a green economy.Getting more renewable energy across <strong>the</strong> <strong>UK</strong> can give us much more security anda greater degree of energy independence – helping to shield us from global fossilfuel price fluctuation.Timely investments will ensure renewable energy will have a long-term role to playas part of a mix of low carbon generation. Alongside energy efficiency, nuclear, andcarbon capture and storage, renewable energy will help reduce <strong>UK</strong> emissions in linewith our carbon budgets and help keep us on track to hit our 2050 target – an 80%cut in emissions.To consider how we might get <strong>the</strong>re, <strong>the</strong> <strong>UK</strong> Committee on Climate Change havepublished renewable energy scenarios to 2030. The <strong>UK</strong> Government will respond tothis advice by <strong>the</strong> end of <strong>the</strong> year; this response, alongside <strong>the</strong> Annual <strong>Energy</strong>Statement and policies to meet <strong>the</strong> 4th Carbon Budget, will place renewables firmlywithin <strong>the</strong> energy mix.The time for broad strategy statements has passed. The <strong>UK</strong> <strong>Renewable</strong> <strong>Energy</strong><strong>Roadmap</strong> sets out a comprehensive suite of targeted, practical actions to acceleraterenewable energy in <strong>the</strong> <strong>UK</strong> – driving innovation and <strong>the</strong> deployment of a wide rangeof renewables. It will help <strong>the</strong> <strong>UK</strong> Government meet our EU <strong>2020</strong> target, and shouldensure that <strong>the</strong> cost of renewable energy falls over time. It complements andstreng<strong>the</strong>ns parallel activity by <strong>the</strong> Devolved Administrations in Wales, Scotland andNor<strong>the</strong>rn Ireland, each of which has set its targets and ambitions, which takentoge<strong>the</strong>r make a major contribution to renewable deployment.By working toge<strong>the</strong>r we can build a cleaner, greener energy future. This <strong>UK</strong><strong>Renewable</strong> <strong>Energy</strong> <strong>Roadmap</strong> helps to show us <strong>the</strong> way.Rt Hon Chris Huhne MP Rt. Hon Carwyn Jones AM Arlene Foster, MLA Fergus Ewing MSPSecretary of State for First Minister of Wales Minister of Enterprise, Minister for <strong>Energy</strong>,<strong>Energy</strong> and Climate Change Trade and Investment Enterprise & Tourism4
<strong>UK</strong> <strong>Renewable</strong> <strong>Energy</strong> <strong>Roadmap</strong>Executive SummaryThe Coalition Government has made clear its commitment to increasing <strong>the</strong>deployment of renewable energy across <strong>the</strong> <strong>UK</strong> in <strong>the</strong> sectors of electricity, heatand transport. This will make <strong>the</strong> <strong>UK</strong> more energy secure, will help protectconsumers from fossil fuel price fluctuations, is driving investment in new jobsand businesses in <strong>the</strong> renewable energy sector, as well as keep us on track tomeet our carbon reduction objectives for <strong>the</strong> coming decades. <strong>Renewable</strong>s willbe a key part of <strong>the</strong> decarbonisation of <strong>the</strong> energy sector necessary by 2030,alongside nuclear, carbon capture and storage, and improvements in energyefficiency.Over <strong>the</strong> last year <strong>the</strong> Office for <strong>Renewable</strong> <strong>Energy</strong> Deployment in DECC, hasbeen working with market participants and o<strong>the</strong>rs from across <strong>the</strong> renewablessector to better understand how much renewable energy can be deployedthrough to <strong>2020</strong>, and to identify <strong>the</strong> current constraints which must beaddressed to allow this rapid transformation.The result, from multiple sources, forms <strong>the</strong> heart of this plan – a delivery<strong>Roadmap</strong> to set us on <strong>the</strong> path to achieve <strong>the</strong> <strong>UK</strong>’s renewable energy targetover <strong>the</strong> next decade.Our evidence shows that:• Even though we are starting from a low level, <strong>the</strong> <strong>UK</strong> can meet <strong>the</strong> target todeliver 15% of <strong>the</strong> <strong>UK</strong>’s energy consumption from renewable sources by<strong>2020</strong>. Recent ‘bottom-up’ analysis, tested with industry, suggests that <strong>the</strong>reis significant upside potential as well as downside risk to deployment;• Based on current information, and taking account of <strong>the</strong>ir long term potentialas well as <strong>the</strong>ir cost effectiveness, 8 technologies are capable of deliveringmore than 90% of <strong>the</strong> renewable energy we need for <strong>2020</strong>;• <strong>Renewable</strong> electricity has become well established. The existing pipeline 1 oflarge-scale projects is strong, and allowing for historic dropout rates, has <strong>the</strong>potential to put us on track to deliver a total of 29 GW of operational capacityby <strong>2020</strong>;• The pipeline for renewable heat projects is less well developed, but following<strong>the</strong> introduction of <strong>the</strong> world’s first incentive for renewable heat, could deliveras many as 124,000 renewable heat installations by <strong>2020</strong>;• Road transport biofuels already make up over 3% by volume of all roadtransport fuels and are proposed to increase to 5% by 2014. Subject to <strong>the</strong>results of current consultations, Government will come forward with options1 Source: <strong>Renewable</strong> <strong>Energy</strong> Planning Database (REPD). REPD planning data does not currently pick upconversion from coal plant or new-build capacity for co-firing.5
<strong>UK</strong> <strong>Renewable</strong> <strong>Energy</strong> <strong>Roadmap</strong>in Spring 2012 for <strong>the</strong> period after 2014;• The costs of renewable energy technologies are uncertain but are expectedto fall over time as supply chains develop, technical challenges areovercome, and <strong>the</strong> cost of capital reduces with lower risk;• There are cross cutting barriers to deployment for all or many of <strong>the</strong>renewable energy technologies as well as barriers that apply to specifictechnologies, all of which need to be addressed to achieve our aims fordeployment and cost reduction.This <strong>Roadmap</strong> shows where we are now; analysis of how deployment mayevolve by <strong>2020</strong>, toge<strong>the</strong>r with separate estimates of <strong>the</strong> market’s view of <strong>the</strong>potential; and <strong>the</strong> actions required to set us on <strong>the</strong> path to achieve <strong>the</strong>deployment levels anticipated in our analysis.While renewable deployment across all technologies will be important, <strong>the</strong><strong>Roadmap</strong> focuses in particular on <strong>the</strong> 8 technologies that have ei<strong>the</strong>r <strong>the</strong>greatest potential to help <strong>the</strong> <strong>UK</strong> meet <strong>the</strong> <strong>2020</strong> target in a cost effective andsustainable way, or offer great potential for <strong>the</strong> decades that follow. The keyactions in this <strong>Roadmap</strong> for each of <strong>the</strong> 8 technologies are:• Onshore wind: Provide long term certainty for investors through electricitymarket reform and a managed transition from <strong>the</strong> <strong>Renewable</strong>s Obligation.Reform <strong>the</strong> planning system to ensure it supports economic growth andgives communities a greater stake in development. Co-fund <strong>the</strong>development of technical solutions to overcome windfarm interference withaviation radar and broker roll-out plans, including through a newMemorandum of Understanding with industry. Upgrade onshoretransmission capacity and ensure that developers secure timely and costeffectiveaccess to <strong>the</strong> network and put in place a process to monitordelivery;• Offshore wind: Establish an industry Task Force to set out a path andaction plan to reduce <strong>the</strong> costs of offshore wind to £100/MWh by <strong>2020</strong>.Provide up to £30m of direct Government support for offshore wind costreduction over <strong>the</strong> next 4 years. Work through <strong>the</strong> Offshore WindDevelopers Forum to support <strong>the</strong> development of <strong>the</strong> supply chain alongsideaction to encourage new manufacturing facilities at port sites. Manageconflicts with oil and gas exploration, provide greater certainty over financialincentives, and ensure timely and coordinated development of <strong>the</strong> gridthrough <strong>the</strong> Offshore Transmission Coordination Project;• Marine energy: Provide up to £20m over <strong>the</strong> next 4 years to supportinnovation in wave and tidal devices and commission marine energy testingfacilities at <strong>the</strong> National <strong>Renewable</strong> <strong>Energy</strong> Centre (NaREC) early in 2012.Work with The Crown Estate to introduce a knowledge sharing network toaccelerate <strong>the</strong> level of marine energy deployment. Provide guidance to <strong>the</strong>sector by March 2012 to help develop Marine <strong>Energy</strong> Parks in order tostimulate <strong>the</strong> supply chain. Manage potential conflicts with o<strong>the</strong>r users of <strong>the</strong>6
<strong>UK</strong> <strong>Renewable</strong> <strong>Energy</strong> <strong>Roadmap</strong>sea by working with marine regulators and publishing later this year <strong>the</strong>response to <strong>the</strong> wave and tidal elements of <strong>the</strong> Offshore <strong>Energy</strong> StrategicEnvironmental Assessment;• Biomass electricity: Publish a <strong>UK</strong> Bioenergy Strategy later this yeararticulating a clear vision for <strong>the</strong> growth of sustainable biomass energy in <strong>the</strong><strong>UK</strong>. Apply <strong>the</strong> Strategy in deciding, a year ahead of <strong>the</strong> original timetable,new <strong>Renewable</strong>s Obligation bands to come into force from April 2013, andlink payments to sustainability standards from April 2013. Focus onmeasures to support long-term waste fuel supplies including throughpossible landfill restrictions on waste wood. Work with regulators tointroduce cost effective fuel monitoring and sampling systems and ensurethat environmental legislation does not have an unintended impact onrenewable energy plant;• Biomass heat: Increase <strong>the</strong> attractiveness of biomass heat and biomethaneinjection into <strong>the</strong> grid through introduction of <strong>the</strong> <strong>Renewable</strong> Heat Incentive(RHI) and <strong>the</strong> <strong>Renewable</strong> Heat Premium Payment (RHPP) in Great Britain.Consult this summer on a new scheme to support renewable heat inNor<strong>the</strong>rn Ireland subject to agreement of <strong>the</strong> Nor<strong>the</strong>rn Ireland Executive.Ensure sustainability of biomass heat through <strong>the</strong> introduction of reportingcriteria for feedstock from 2011 and emission performance standards underphase 2 of <strong>the</strong> RHI. Work with regulators to enable Anaerobic Digestionplant to benefit from reduced regulatory burdens and faster permitting,including whe<strong>the</strong>r it is appropriate to amend regulations which apply tobiogas injection to <strong>the</strong> grid;• Ground source and air source heat pumps: Introduce <strong>the</strong> RHI for nondomesticinstallations and <strong>the</strong> RHPP for eligible domestic scale heat pumps.Streamline <strong>the</strong> planning and consenting processes through <strong>the</strong> provision ofguidance for open-loop ground source heat pumps and permitteddevelopment rights for some air source heat pumps on domestic properties.Collect data on how best to improve heat pump performance and raise <strong>the</strong>technical abilities of installers by tightening standards of training under <strong>the</strong>Microgeneration Certification Scheme;• <strong>Renewable</strong> transport: Identify and agree a preferred approach to achieve<strong>the</strong> <strong>2020</strong> transport sub-target, and actions for implementation after 2014.Consider <strong>the</strong> European Commission’s proposals on Indirect Land-UseChange impacts of biofuels with a view to ensuring effective standards.Support <strong>the</strong> market for plug-in vehicles by making up to £30m available forinvestment in recharging infrastructure and providing a grant of up to 25% of<strong>the</strong> purchase price (capped at £5000) for eligible electric, plug-in hybrid orhydrogen fuel cell cars.Taking <strong>the</strong>se actions will not only help drive deployment across <strong>the</strong> <strong>UK</strong> but willalso be key to reducing <strong>the</strong> costs of renewables, enabling technologies tomature so that over <strong>the</strong> medium to long-term <strong>the</strong>y no longer need additionalsupport to compete on a level playing field against o<strong>the</strong>r low carbon7
<strong>UK</strong> <strong>Renewable</strong> <strong>Energy</strong> <strong>Roadmap</strong>technologies.Of course, technology costs, innovation breakthroughs and barriers todeployment will change over time. Government will closely monitor deploymentand <strong>the</strong> development of <strong>the</strong> market. We will update <strong>the</strong> <strong>Roadmap</strong> on an annualbasis so that we know how we are doing and whe<strong>the</strong>r o<strong>the</strong>r technologies canmake a bigger or cheaper contribution than is assumed here.We want <strong>the</strong> <strong>UK</strong> to be <strong>the</strong> location of choice for inward investment and a worldclass centre of energy expertise. The actions set out in this <strong>Roadmap</strong> willenable us to successfully exploit our renewable resources, make a strongcontribution to our energy needs, provide opportunities for jobs and wealthcreation, and contribute to efforts to reduce emissions of harmful greenhousegases.8
<strong>UK</strong> <strong>Renewable</strong> <strong>Energy</strong> <strong>Roadmap</strong>Chapter 1 - IntroductionGovernment commitment to renewables1.1 The Coalition has made clear its commitment to increase <strong>the</strong> amount ofrenewable energy deployed in <strong>the</strong> <strong>UK</strong>. This will make <strong>the</strong> <strong>UK</strong> more energysecure, will help protect consumers from fossil fuel price fluctuations, will helpdrive investment in new jobs and businesses in <strong>the</strong> renewable energy sector,as well as keep us on track to meet our carbon reduction objectives for <strong>the</strong>coming decades.1.2 Our goal is to ensure that 15% of our energy demand is met from renewablesources by <strong>2020</strong> in <strong>the</strong> most cost effective way. Ambition is equally strongacross all areas of <strong>the</strong> <strong>UK</strong>, where <strong>the</strong> Devolved Administrations have set<strong>the</strong>mselves challenging domestic targets for both <strong>the</strong> level of renewableelectricity and heat consumption by <strong>2020</strong>.Ambitions in Scotland, Wales and Nor<strong>the</strong>rn IrelandAll across <strong>the</strong> <strong>UK</strong>, action is being taken to use our significant resources to deployrenewables still fur<strong>the</strong>r and faster, ensuring security and sustainability of energy supply.In addition to <strong>the</strong> overarching <strong>UK</strong> renewables target, <strong>the</strong> Devolved Administrations haveset ambitious but achievable targets at a domestic level:• The Scottish Government has introduced a target to deliver 100% renewableelectricity by <strong>2020</strong>;• The Nor<strong>the</strong>rn Ireland Executive has a target to deliver 40% renewable electricityand 10% renewable heat by <strong>2020</strong>;• The Welsh Government has indicated that it has <strong>the</strong> potential to produce twice <strong>the</strong>amount of electricity it currently uses from renewable sources by 2025, and deliver4 GW of this from marine energy.1.3 Our ambition extends beyond <strong>2020</strong>. Recent independent advice 2 from <strong>the</strong>Committee on Climate Change (CCC) has made clear <strong>the</strong> long term role forrenewable energy. The CCC concluded that <strong>the</strong>re is scope for <strong>the</strong> penetrationof renewable energy to reach 30 - 45% of all energy consumed in <strong>the</strong> <strong>UK</strong> by2030. CCC also recognised that achieving this level of growth would requireresolution of current uncertainties and cost reductions. This <strong>Roadmap</strong> sets outhow we will tackle <strong>the</strong> non-financial barriers to renewables deployment,enabling <strong>the</strong> market to grow in line with our goals for <strong>2020</strong> and beyond.2 <strong>UK</strong> Government commissioned independent advice on <strong>the</strong> level of ambition for renewable energy to <strong>2020</strong>and 2030 from <strong>the</strong> Committee of Climate Change (CCC). The <strong>UK</strong> Government will respond to <strong>the</strong> CCCrecommendations alongside <strong>the</strong> 4th Carbon Budget later this year.9
<strong>UK</strong> <strong>Renewable</strong> <strong>Energy</strong> <strong>Roadmap</strong>Ensuring value for money1.4 Securing renewable sources of energy is a key pillar of <strong>the</strong> <strong>UK</strong> Government’sstrategy for a diverse, low carbon energy system alongside nuclear, cleanercoal and gas, and energy efficiency. However, as a relatively new, emergingset of technologies, renewables tend to be more expensive than existing fossilfuel generation.1.5 Doing nothing is not necessarily <strong>the</strong> least cost option given <strong>the</strong> potential pricerises of fossil fuels in <strong>the</strong> future and <strong>the</strong> potential impacts on security of supply.However, <strong>the</strong>re is a clear need to deliver our goals in a way that is consistentwith sustainable economic growth and minimising <strong>the</strong> impacts of energy andclimate change policies on consumer bills. We are already taking steps tomaximise cost effectiveness and value for money through:• Undertaking regular review of technology costs: <strong>Renewable</strong> technologycosts are expected to fall with time. It is our responsibility to ensure thatdevelopers have an adequate incentive to drive early deployment but that<strong>the</strong>y are not overcompensated at <strong>the</strong> expense of <strong>the</strong> consumer;• Tackling non-financial barriers and supporting <strong>the</strong> supply chain: Takeaction to help drive down technology costs, and support inward investment in<strong>the</strong> supply chain to increase competition and move manufacturing closer to<strong>the</strong> point of installation;• Working within public spending and affordability limits: Manage ourpolicies to stay within cost limits and achieve our goals in a way that isconsistent with sustainable economic growth and minimising <strong>the</strong> impact onconsumer bills;• Reforming <strong>the</strong> electricity market: The package of Electricity MarketReform (EMR) measures has been designed to be <strong>the</strong> most cost effectivemeans to meet our energy and climate change objectives. This means that,while electricity bills are expected to increase in <strong>the</strong> years ahead due in partto rising wholesale electricity and carbon prices, our reforms are likely to limitthis increase for domestic, non-domestic and energy intensive consumers;• Promoting energy efficiency: Our target is a percentage of overall energyconsumption, if we can reduce our consumption we reduce our need fordeployment. Reduced energy consumption will also reduce bill impacts.1.6 Alongside <strong>the</strong>se steps to reduce <strong>the</strong> costs of domestic action, we have <strong>the</strong>potential to work with our European partners on renewables deployment. Thiscould provide an important mechanism to safeguard <strong>UK</strong> consumers in <strong>the</strong>event that <strong>the</strong> costs of domestic deployment do not come down sufficiently, andalternative, cheaper opportunities arise in o<strong>the</strong>r countries where <strong>the</strong> <strong>UK</strong> could“trade” through <strong>the</strong> use of <strong>the</strong> flexibility mechanisms in <strong>the</strong> <strong>Renewable</strong> <strong>Energy</strong>Directive.10
<strong>UK</strong> <strong>Renewable</strong> <strong>Energy</strong> <strong>Roadmap</strong>1.7 This should not be viewed as a one-way exercise – trading presents anopportunity for <strong>the</strong> <strong>UK</strong>. We have an abundant offshore wind resource and couldalso export energy generated in <strong>UK</strong> waters to neighbouring Member States. Aspart of this we could see offshore wind projects connected across <strong>the</strong> BritishIsles and to mainland Europe, increasing our security of supply as part of an“All Islands Approach”, and providing new manufacturing and jobs in <strong>the</strong>renewable energy sector in <strong>the</strong> <strong>UK</strong>. We will look to ensure that we have powersto enable both export and import of renewable energy under <strong>the</strong> flexibilitymechanisms in <strong>the</strong> <strong>Renewable</strong> <strong>Energy</strong> Directive where this can secure <strong>the</strong>greatest benefit to <strong>the</strong> <strong>UK</strong>.Box 1: All Islands ApproachMinisters from <strong>the</strong> British Isles, <strong>the</strong> Channel Islands and <strong>the</strong> Isle of Man recently signed upto co-operate on exploiting <strong>the</strong> major wind and marine resources in and around <strong>the</strong> islands.The nations involved agreed to co-operate in an All Islands Approach to energy in <strong>the</strong> June2011 British Irish Council held in London.The All Islands Approach to energy resources across <strong>the</strong> British Islands and Ireland willencourage and enable developers to exploit commercial opportunities for generation andtransmission, facilitate <strong>the</strong> cost-effective exploitation of <strong>the</strong> renewable energy resourcesavailable, and increase integration of our markets and improves security of supply.Optimising <strong>the</strong> natural resource available around our islands would benefit us all. It makessense to develop and share clean, green secure energy with our neighbours ra<strong>the</strong>r thanimport vast amounts of fossil fuels from far flung parts of <strong>the</strong> world. In practice, moreinterconnection between <strong>the</strong> islands would mean that on, for instance, a very windy day inmainland Britain, surplus power could be sold to Ireland and mainland Europe, as well asenabling imports of electricity from Ireland and mainland Europe, when required.The approach will encourage and enable developers to exploit commercial opportunities forgeneration and transmission, facilitate <strong>the</strong> cost-effective exploitation of <strong>the</strong> renewableenergy resources available, and increase integration of members markets and improve<strong>the</strong>ir security of supply.The <strong>Renewable</strong> <strong>Energy</strong> <strong>Roadmap</strong>1.8 Over <strong>the</strong> last year <strong>the</strong> Office of <strong>Renewable</strong> <strong>Energy</strong> Deployment has beenworking with industry, financiers, <strong>the</strong> Devolved Administrations and o<strong>the</strong>rs tounderstand recent trends in renewables deployment in <strong>the</strong> <strong>UK</strong>, and <strong>the</strong> pipelineof projects that could come forward before <strong>2020</strong>, as well as <strong>the</strong> barriers thatneed to be overcome to enable <strong>the</strong>se projects to be delivered successfully andcost effectively. This document sets out that analysis toge<strong>the</strong>r with a targetedprogramme of action that Government is taking to increase renewablesdeployment.1.9 This <strong>Roadmap</strong> is <strong>the</strong> first of a kind. Whilst it sets out a comprehensiveprogramme of action, it also recognises that <strong>the</strong> barriers to deployment,11
<strong>UK</strong> <strong>Renewable</strong> <strong>Energy</strong> <strong>Roadmap</strong>technology costs, and innovation breakthroughs will change with time. The<strong>Roadmap</strong> establishes a process of monitoring and evaluation that will enableus to adjust our approach. We propose to publish updates on an annual basis.12
<strong>UK</strong> <strong>Renewable</strong> <strong>Energy</strong> <strong>Roadmap</strong>Chapter 2: Analysis2.1 We have ga<strong>the</strong>red evidence on <strong>the</strong> potential deployment and costs ofrenewable energy technologies to <strong>2020</strong>. This has allowed us to understandhow, and with which mix of technologies, <strong>the</strong> market can deliver 15% of ourenergy consumption from renewable sources by <strong>2020</strong>.2.2 We have also examined <strong>the</strong> most recent data on current deployment levels andprojects which are in <strong>the</strong> pipeline for possible deployment in <strong>the</strong> future. Bycomparing <strong>the</strong> potential level of deployment in <strong>2020</strong> against baseline data wehave estimated growth rates for each technology and, where possible, howmuch of <strong>the</strong> increase could be met from projects already in <strong>the</strong> pipeline.2.3 Analysis of <strong>the</strong> pipeline has also allowed us to map <strong>the</strong> stages of deploymentfor key technologies, identify <strong>the</strong> challenges <strong>the</strong>y face, and develop a targetedprogramme of actions.Deployment of renewable energy to <strong>2020</strong>2.4 Our analysis of potential deployment to <strong>2020</strong> considers factors such astechnology cost, build rates, and <strong>the</strong> policy framework. These variables havebeen modelled to produce illustrative ‘central ranges’ for deployment.2.5 The central ranges do not represent technology specific targets or <strong>the</strong> level ofour ambition. They are based on our current understanding of deployment,costs and non-financial barriers and could change significantly as <strong>the</strong> marketevolves to <strong>2020</strong> 3 . Indeed in some cases – such as for offshore wind – we aretargeting specific actions to reduce cost and increase likely deployment. Ino<strong>the</strong>rs, forthcoming work – including on <strong>the</strong> RO Banding Review consultationand decisions on biofuels – could have an impact. We will update our analysisannually to reflect <strong>the</strong> evolution of policy and observed levels of deployment.2.6 Figure 1 aggregates <strong>the</strong> central view of deployment across technologies. Itillustrates that, despite uncertainty about <strong>the</strong> contribution from individualtechnologies (discussed in Chapter 3), <strong>the</strong> <strong>UK</strong> can deliver 234 TWh ofrenewable energy overall in <strong>2020</strong> – equivalent to 15% of our projected energyconsumption 4 . Whilst <strong>the</strong> contribution from individual technologies could vary,underachievement on one will allow <strong>the</strong> <strong>UK</strong> to deliver more of ano<strong>the</strong>r within itsfinancial support framework 5 .3 Figures for <strong>the</strong> heat sector reflect uncertainty in potential growth rates and <strong>the</strong> rates of return needed toincentivise take-up. In <strong>the</strong> electricity sector <strong>the</strong> range reflects preliminary analysis of <strong>the</strong> uncertainty of <strong>the</strong>impact on deployment of changes to fossil fuel prices, future cost reductions, <strong>the</strong> success of overcoming nonfinancialbarriers to deployment.4 <strong>Energy</strong> demand is forecast to be 1557 TWh in <strong>2020</strong> in <strong>the</strong> Government’s central projection on <strong>the</strong> REDdefinition.5 In <strong>the</strong> case of renewable transport, targets for biofuels have not yet been set beyond 2014.13
<strong>UK</strong> <strong>Renewable</strong> <strong>Energy</strong> <strong>Roadmap</strong>Figure 1: Central view of deployment and <strong>the</strong> 15% target400350300250TWh2001501005002010 2011 2012 2013 2014 2015 2016 2017 2018 2019 <strong>2020</strong>2.7 The analysis also indicates that approximately 90% of <strong>the</strong> generationnecessary to meet <strong>the</strong> 15% target can be delivered from a subset of 8technologies (set out in Figure 2 below). These technologies are particularlysignificant due to <strong>the</strong>ir cost effectiveness, potential level of deployment, andimportance to <strong>the</strong> <strong>UK</strong>’s 2050 energy mix.Figure 2: Technology breakdown (TWh) for central view of deployment in <strong>2020</strong>Central range for <strong>2020</strong>(TWh)Onshore wind 24-32Offshore wind 33-58Biomass electricity 32-50Marine 1Biomass heat (non-domestic) 36-50Air-source and Ground-source heat pumps (nondomestic)16-22<strong>Renewable</strong> transportUp to 48TWhO<strong>the</strong>rs (including hydro, geo<strong>the</strong>rmal, solar and14domestic heat)Estimated 15% target 2342.8 This <strong>Roadmap</strong>, and our action to tackle non-financial barriers to deployment, isfocused on <strong>the</strong>se 8 technologies. The remaining renewable energy generationnecessary to meet <strong>the</strong> <strong>2020</strong> target will come from technologies such ashydropower, solar PV, and deep geo<strong>the</strong>rmal heat and power. These willgenerally qualify for renewable financial incentives and will benefit from actionto unblock cross-cutting non-financial barriers, including those set out in <strong>the</strong>recent Microgeneration Strategy for England. Microgeneration technologies willalso benefit from <strong>the</strong> Government’s commitment to Zero Carbon Homes.14
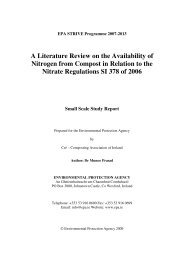
<strong>UK</strong> <strong>Renewable</strong> <strong>Energy</strong> <strong>Roadmap</strong>Case study: Solar PVSolar photovoltaic (PV) technology has shown significant development in recent years,with ongoing technological improvements and capital costs falling. By <strong>the</strong> end of May2011 nearly 38,000 solar PV installations in Great Britain were receiving support through<strong>the</strong> Feed-in Tariff (see below).The appetite for solar PV technology is global,led by a number of major international markets,and this wide uptake is playing a major part indriving down costs. Modules and invertersaccount for over half of <strong>the</strong> final cost of aninstallation, and we understand that this is where<strong>the</strong>re is greatest scope for fur<strong>the</strong>r costreductions. As a relatively small player in <strong>the</strong>international solar PV market, <strong>the</strong> <strong>UK</strong> isnecessarily a “price taker” – we benefit from <strong>the</strong>global cost reductions.The Government believes that solar PV could potentially have a role to play in largerscale<strong>UK</strong> renewables deployment in <strong>the</strong> future, though this will depend on a number offactors. One of <strong>the</strong>se is that sufficient cost reductions will need to be achieved so that <strong>the</strong>viability of projects is not dependent on significant subsidy. Work for industry 6 suggeststhat this point may be reached during this decade.To demonstrate our commitment to solar PV as a large scale generation source in <strong>the</strong> <strong>UK</strong>,<strong>the</strong> Government currently provides financial support for <strong>the</strong> technology through <strong>the</strong><strong>Renewable</strong>s Obligation. The rate is set so that solar PV can be supported and contributeto large-scale renewables generation and to encourage cost reduction to improve itscompetitiveness against more established technologies. The <strong>Renewable</strong>s Obligation issubject to a Banding Review this year, with new rates to take effect from April 2013.In addition, at present <strong>the</strong> Feed-in Tariffs scheme supports small-scale solar PVgeneration such as <strong>the</strong> solar tiles on <strong>the</strong> roof of <strong>the</strong> house illustrated above. The schemeis currently being reviewed; new rates for PV installations over 50 kW will take effect from1 August 2011, and any fur<strong>the</strong>r rate changes that arise from <strong>the</strong> review for installations atall scales will take effect from April 2012 (unless <strong>the</strong> review reveals <strong>the</strong> need for greaterurgency).Uncertainties in delivering our <strong>2020</strong> ambition2.9 In developing a programme of action for renewables it is also important to takeaccount of wider uncertainty. Key uncertainties include future energy demand,<strong>the</strong> cost of technologies, and <strong>the</strong> level of renewable energy deployment whichindustry believes can be achieved.6 <strong>UK</strong> solar PV industry outlook: The <strong>UK</strong> 50 kW to 5 MW solar PV market (Ernst & Young, June 2011)www.oursolarfuture.org.uk/wp-content/uploads/The-<strong>UK</strong>-50kW-to-5-MW-solar-PV-market-190611-Final.pdf15
<strong>UK</strong> <strong>Renewable</strong> <strong>Energy</strong> <strong>Roadmap</strong>2.10 To illustrate <strong>the</strong> uncertainty around deployment potential we have ga<strong>the</strong>redinitial views from <strong>the</strong> market 7 about <strong>the</strong> range of growth levels <strong>the</strong>y consideredfeasible for individual technologies. The analysis, set out in Box 2, shows that<strong>the</strong>re is significant upside potential to deployment if markets develop morequickly than expected (<strong>the</strong> ‘industry high’ scenario) but also downside risk if weare less successful in removing barriers (‘industry low’) 8 .Box 2: Industry deployment scenariosDECC’s work on deployment uncertainty to <strong>2020</strong> relies on analysis by AEATechnology, who used published literature and discussions with industry to arriveat an initial view of <strong>the</strong> market’s ability to deploy renewables across <strong>the</strong> decade.The analysis was stakeholder-focused and was ‘bottom up’ (based onconsidering <strong>the</strong> market’s appetite for individual technologies and projects) ra<strong>the</strong>rthan <strong>the</strong> ‘top-down’ model-based approach. The results, presented in Figure 3,were subsequently tested with a wide range of companies.Figure 3: Upside potential and downside risks to deployment – industry scenariosTWh4003503002502001501005002010 2011 2012 2013 2014 2015 2016 2017 2018 2019 <strong>2020</strong>Market Industry view high - highMarket Industry view low - low15% target234TWh2.11 In Chapter 3 we overlay industry high and low scenarios for each technologyaround <strong>the</strong> central ranges discussed above. For most technologies <strong>the</strong> centralrange lies inside <strong>the</strong> industry scenarios, although for marine this is not <strong>the</strong> case– a difference which reflects <strong>the</strong> greater levels of uncertainty for early-stagetechnologies.2.12 Recent work for DECC suggests that, although renewable electricity 9 andheat 10 technologies are generally more expensive than fossil fuel generation,7 Analysis of <strong>Renewable</strong>s Growth to <strong>2020</strong>, AEA Technology.8 Scenarios presented in Box 2, and by technology in Chapter 3, do not include contribution we expect fromdomestic heat (for which policies are being finalised) and use different load factors from central range.9 Costs are expressed in 2010 prices. Costs for renewable electricity are based on capital and operating costs,including fuel costs, provided by Arup and Ernst & Young to inform <strong>the</strong> 2011 Banding Review. Costs for CCGTare based on work by PB Power. Cost ranges are based on varying capital costs. Costs for <strong>2020</strong> for offshorewind reflect both Round 2 project and Round 3 projects / projects in Scottish Territorial Water projects,16
<strong>UK</strong> <strong>Renewable</strong> <strong>Energy</strong> <strong>Roadmap</strong>costs are uncertain and are likely to come down over <strong>the</strong> longer term. Theresults of our analysis are set out in Figures 4-7 below for projects achievingfinancial close in 2010 or <strong>2020</strong>.Figure 4: Estimated levelised cost ranges for electricity technologies in 2010400380350300250£/MWh2001501005019114912775202165127110941281061947579760CCGTMarineAD < 5MWBiomassconversionBiomasscofiringDedicatedbiomassSolar PVOnshoreOffshorewhereas <strong>the</strong> figures for 2010 reflects only Round 2. There is no data for marine in 2010 as <strong>the</strong> marinetechnologies which are of interest for <strong>2020</strong> have not yet been fully commercially deployed.10 Cost ranges for heat are based on capital, borrowing, operating, fuel and barrier costs provided by AEATechnology to support development of <strong>the</strong> <strong>Renewable</strong> Heat Incentive. They refer to non-domestic sectorinstallations. Due to a lack of reliable data we assume that costs for biogas are fixed over time.17
<strong>UK</strong> <strong>Renewable</strong> <strong>Energy</strong> <strong>Roadmap</strong>Figure 5: Projected levelised cost ranges for electricity technologies in <strong>2020</strong>400350340300250250£/MWh 2001501005017610212271136156120110 127931061737016291870CCGTMarineAD < 5MWBiomassconversionBiomasscofiringDedicatedbiomassSolar PVOnshoreOffshoreFigure 6: Estimated levelised cost ranges for heat technologies in 2010180160156140138120100£/MWh807599906040200554462Air source Groundheat pump sourceheat pump40Biomassboilers61Biomassdistric<strong>the</strong>ating3322 25685328Biogas Gas Electricity Off gas andelectricitygrid18
<strong>UK</strong> <strong>Renewable</strong> <strong>Energy</strong> <strong>Roadmap</strong>Figure 7: Projected levelised cost ranges for heat technologies in <strong>2020</strong>180160140159138120100£/MWh806040205342675610243652246321018757310Air source Groundheat pump sourceheat pumpBiomassboilersBiomassdistric<strong>the</strong>atingBiogas Gas Electricity Off gas andelectricitygrid2.13 The range of cost uncertainty is particularly large for technologies such asmarine, which is at <strong>the</strong> early stages of commercial deployment in <strong>the</strong> <strong>UK</strong>, andbiomass heat technologies, for which supply chains have not yet been tested atscale. Cost reductions are expected to be most pronounced for electricitytechnologies, particularly offshore wind and solar PV, as supply chains andtechnologies develop to <strong>2020</strong>. The cost of generating heat and electricity fromfossil fuels is also expected to rise over time.2.14 It is essential that costs of renewable technologies fall over <strong>the</strong> decade asdeployment increases. Our goal in <strong>the</strong> medium to long term is to helprenewables compete on a level playing field against o<strong>the</strong>r low carbontechnologies. We will regularly review our subsidy programmes to take accountof cost changes from supply chain development, learning, and technicalbreakthrough.2.15 Uncertainty about projected energy demand is also a consideration. DECCanalysis suggests that uncertainty around factors such as GDP growth, prices,consumer behaviour and <strong>the</strong> impact of energy efficiency policy mean that totalenergy demand could vary from our central projection. Our estimates suggest amargin of uncertainty of at least +/- 8% from our <strong>2020</strong> central estimate of 1,557TWh. An increase of 8% would add around 19 TWh to our deployment goal of234 TWh for <strong>2020</strong>. DECC’s Office of National <strong>Energy</strong> Efficiency is putting inplace a range of policies to drive energy efficiency in <strong>the</strong> <strong>UK</strong>.2.16 In Chapter 4 we set out our approach to handling uncertainty in more detail.Our key commitment is to work with industry to refresh <strong>the</strong> analysis and actions19
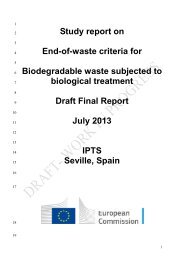
<strong>UK</strong> <strong>Renewable</strong> <strong>Energy</strong> <strong>Roadmap</strong>set out in <strong>the</strong> <strong>Roadmap</strong> as new information emerges about deployment, costs,energy demand, and policy impact. We believe that <strong>the</strong> 15% target isachievable through cost-effective domestic action, but acknowledge <strong>the</strong>uncertainty and are putting in place a framework to allow contingency action,including taking powers to enable trading, should it be required.Progress in renewable deployment2.17 As illustrated in Figure 8, renewable energy accounted for 54 TWh (3.3%) 11 of<strong>the</strong> <strong>UK</strong>’s total energy consumption in 2010, having increased steadily since2005, and by 15% between 2008 and 2009. We will need to see more than afour-fold increase in our renewable energy consumption by <strong>2020</strong> if 15% of ourenergy needs are to be met from renewable sources. Consumption ofrenewable energy will need to rise by 17% per annum to meet that goal.Figure 8: <strong>UK</strong> <strong>Renewable</strong> <strong>Energy</strong> Consumption (TWh) 126050Total Final Consumption of<strong>Renewable</strong> <strong>Energy</strong> TWh40TWh30201002005 2006 2007 2008 2009 2010Source: <strong>Energy</strong> Trends June 20112.18 Different levels of growth will be required across <strong>the</strong> sectors given <strong>the</strong>ir varyingstages of development. <strong>Renewable</strong> electricity will need to maintain a growthrate of approximately 15% per annum from <strong>the</strong> 2010 baseline of 28 TWh. Therenewable heat market, which is at an earlier stage of development, will requirehigher levels of growth, over 19% per annum, to move from <strong>the</strong> 2010 baselineof 13 TWh 13 to <strong>the</strong> projection of approximately 73 TWh by <strong>2020</strong>.2.19 Box 3 below provides an overview of current deployment levels by technologyand <strong>the</strong> progress which has been made across all areas of <strong>the</strong> <strong>UK</strong>.11 Source: DECC <strong>Energy</strong> Trends June 2011. Measured using <strong>Renewable</strong> <strong>Energy</strong> Directive methodology12 Measured using <strong>Renewable</strong> <strong>Energy</strong> Directive methodology13 As above20
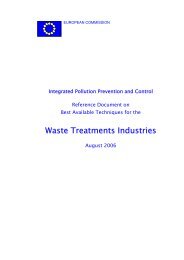
<strong>UK</strong> <strong>Renewable</strong> <strong>Energy</strong> <strong>Roadmap</strong>Box 3: Overview of renewables deployment<strong>Renewable</strong> ElectricityRecent analysis 14 shows that renewable electricity capacity increased by 15% between 2009and 2010, with onshore wind contributing <strong>the</strong> largest share. The total installed capacity was9.6 GW (including co-firing), which is in line with our overall projected growth. Totalgeneration in 2010 was 25.7 TWh. However, <strong>the</strong> growth in generation between 2009 and2010 was less strong. This resulted from much lower than average rainfall and <strong>the</strong> lowestwind speeds this century, reducing hydropower and wind generation.<strong>Renewable</strong> Heat<strong>Renewable</strong> heat generated 14.1 TWh 15 in 2010, of which biomass heat contributed 12.4TWh, solar <strong>the</strong>rmal contributed 1 TWh, and heat pumps contributed 0.7 TWh. Thisrepresents an increase of 17% from 2009 to 2010.TWh1614121086420Annual renewable heat consumption (GCV basis)Heat Pumps2006 2007 2008 2009 2010MSW combustionPlant BiomassAnimal BiomassWood combustion -industrialWood combustion -domesticSewage sludgedigestionLandfill gasGeo<strong>the</strong>rmal aquifers14 Source: <strong>Energy</strong> Trends June 201115 Source: <strong>Energy</strong> Trends June 2011. Measured on Gross Calorific Value basis (as opposed to <strong>Renewable</strong> <strong>Energy</strong>Directive methodology)21
<strong>UK</strong> <strong>Renewable</strong> <strong>Energy</strong> <strong>Roadmap</strong>At present we do not have verified statistics for renewable heat capacity; however, recentmarket estimates suggest a total installed capacity of at least 1.3 GWth 16 , which is broadly inline with our projections.<strong>Renewable</strong> TransportIn 2009/10 <strong>the</strong> <strong>UK</strong> supplied 3.33% biofuels in road transport 17 by volume, equating to1,568m litres of biofuels. This was slightly higher than <strong>the</strong> target of 3.25% required by <strong>the</strong><strong>Renewable</strong> Transport Fuels Obligation Order and a significant increase on <strong>the</strong> 2.7%supplied in 2008/09. <strong>Energy</strong> generated from biofuels in renewable transport increased by23%, from 9.8 TWh in 2008 to 12.7 TWh in 2009. Provisional data for 2010 suggests fur<strong>the</strong>rgrowth with biofuels contributing 14.1 TWh 18 .Annual <strong>Renewable</strong> Biofuel Consumption (GCVbasis)15TWh105BiodieselBioethanol02006 2007 2008 2009 2010Current pipeline for renewable energyPipeline for renewable electricity2.20 We expect renewable electricity generation to grow in line with our projectionsin <strong>the</strong> coming years. Analysis of <strong>the</strong> <strong>Renewable</strong> <strong>Energy</strong> Planning Database,summarised in Figure 9, suggests that <strong>the</strong> pipeline for new plant across <strong>the</strong> <strong>UK</strong>is currently healthy, with around 22 GW 19 of potential new capacity in planning,consented or under construction. When taken toge<strong>the</strong>r with existing capacityand accounting for historic consenting rates 20 , we could see around 29 GW inoperation in <strong>2020</strong>.2.21 However, <strong>the</strong> analysis also indicates that we cannot be certain that all <strong>the</strong>projects in <strong>the</strong> pipeline will be consented or commissioned or that <strong>the</strong>y willprogress quickly enough to contribute when needed. This is why <strong>the</strong>16 Source: AEA market surveys. The estimate for biomass boilers is thought to be conservative.17 Source: Year Two of <strong>the</strong> RTFO, <strong>Renewable</strong>s Fuel Agency Report 2009/1018 Source: <strong>Energy</strong> Trends, June 201119 This figure does not include conversion from coal plant (this is currently not picked up in REPD) or co-firingcapacity.20 Planning and post-consent success rate based on capacity from 2007-present, weighted by country inplanning stage.22
<strong>UK</strong> <strong>Renewable</strong> <strong>Energy</strong> <strong>Roadmap</strong>Overarching National Policy Statement for <strong>Energy</strong> 21 states that <strong>the</strong>re is anurgent need for new large scale renewable energy projects to come forward toensure that we meet <strong>the</strong> <strong>2020</strong> target and wider decarbonisation ambitions.Figure 9: Pipeline for large scale electricity, including attrition rates 2235GW302.52.7258.1200.1150.16.428.9104.859.60OperationalUnderConstructionAwaitingConstructionApplicationsBeingConsidered2.22 Onshore wind is <strong>the</strong> biggest single contributor to <strong>the</strong> pipeline, with over 11 GWof capacity in planning, consented, or under construction. The offshore windpipeline is currently near 6 GW and is expected to grow as site applications forScottish Territorial Waters and Round 3 offshore wind are submitted forconsideration from 2012. There is currently 4.3 GW of biomass electricity in <strong>the</strong>pipeline, including energy from waste 23 . However, we anticipate that <strong>the</strong>potential pipeline is higher than this, as many fossil fuel to biomass conversionprojects are not currently captured within our statistics. In addition, co-firingbiomass with coal – one of <strong>the</strong> most cost-effective means of producingrenewable electricity – could provide up to 400 MW of capacity in 2011.Total2.23 An initial assessment of renewable electricity projects currently underconstruction 24 , suggests that a fur<strong>the</strong>r 4 GW could come into operation by <strong>the</strong>end of 2012.21 Overarching National Policy Statement for <strong>Energy</strong>, DECC (2011)22 Based on historic consenting rates, <strong>the</strong> capacity shown in green could potentially be lost from <strong>the</strong> pipeline23 As 19 above.24 Based on analysis of renewable electricity projects over 50MW using <strong>the</strong> <strong>Renewable</strong> <strong>Energy</strong> PlanningDatabase https://restats.decc.gov.uk/cms/planning-database and commercial information23
<strong>UK</strong> <strong>Renewable</strong> <strong>Energy</strong> <strong>Roadmap</strong>Pipeline for renewable heat2.24 Whilst we have evidence on renewable electricity, <strong>the</strong> available data onrenewable heat is less well developed. Over <strong>the</strong> coming year DECC will ga<strong>the</strong>rdata on installed heat and on <strong>the</strong> future pipeline based on available planningand permitting information, and market intelligence. This, toge<strong>the</strong>r withinformation from preliminary accreditation of <strong>Renewable</strong> Heat Incentive (RHI)installations (driving up to an additional 100,000 heat pumps and an additional24,000 biomass heat 25 installations by <strong>2020</strong>), and <strong>the</strong> <strong>Renewable</strong> HeatPremium Payment (RHPP) for small scale, will allow us to track heat projects,analyse deployment trends and identify barriers to adoption. We will makeupdated data on heat publicly available.Pipeline for renewable transport2.25 The RTFO places an annual obligation on road transport fuels suppliers tosupply a percentage of biofuels (subject to “buy out”). This is currently set toachieve 4% by energy (5% by volume) by 2014. However, as biofuel is aglobally traded commodity <strong>the</strong> pipeline does not exist in <strong>the</strong> same way as itdoes for <strong>the</strong> o<strong>the</strong>r end use sectors of electricity and heat. Government willcome forward with proposals for renewable transport between 2014 and <strong>2020</strong>in order to achieve <strong>the</strong> 10% transport sub-target.Local potential for renewables deployment2.26 In addition to developing our understanding of deployment at <strong>the</strong> national scale,DECC has funded nine studies to help local authorities and local communitiesin England identify and maximise opportunities for <strong>the</strong> deployment of renewableand low carbon energy technologies in <strong>the</strong>ir area. The Scottish Governmenthas developed a similar assessment of potential in Scotland. Local Authoritiesand communities will be able to use <strong>the</strong> results of <strong>the</strong>se assessments to informdevelopment of <strong>the</strong>ir local and neighbourhood development plans.2.27 Seven of <strong>the</strong> nine assessments for England are now available 26 through <strong>the</strong>DECC web site. We aim to publish <strong>the</strong> final two assessments soon.25 Biomass heat installations including biomass boilers, biogas injection and biomass district heatinginstallations26 http://www.decc.gov.uk/en/content/cms/meeting_energy/renewable_ener/ored/ored.aspx24
<strong>UK</strong> <strong>Renewable</strong> <strong>Energy</strong> <strong>Roadmap</strong>Box 4: Assessment of <strong>the</strong> potential for renewables energy in <strong>the</strong> North Westof EnglandThe ‘North West renewable and low carbon energy capacity and deployment projectreport’ has been developed in conjunction with stakeholders from across <strong>the</strong> region,according to <strong>the</strong> energy capacity assessment methodology published by DECC and CLGin 2010.The study is intended to assist Local Planning Authorities in preparing planning policies onrenewables.The project has produced a comprehensive assessment of <strong>the</strong> potential accessiblerenewable energy resources at <strong>2020</strong>. The scenarios contained in <strong>the</strong> report for potentialdeployment of renewables are only intended to illustrate, given current constraints andtrends, how <strong>the</strong> North West could contribute to national renewable energy deploymenttargets.While <strong>the</strong> focus of <strong>the</strong> project has been to present <strong>the</strong> results at sub-regional and subnationalscales, much of <strong>the</strong> original data can be interrogated down to Local Authority level.This original data is available to Local Authorities to undertake <strong>the</strong>ir own analysis.Cumbria County Council working toge<strong>the</strong>r with <strong>the</strong> District Councils and <strong>the</strong> Lake DistrictNational Park has commissioned work building on <strong>the</strong> North West study to identify <strong>the</strong>renewables and low carbon energy potential in Cumbria. The study provides acomprehensive evidence base that will facilitate local planning authorities across Cumbriato develop well-founded policies that support renewable energy development25
<strong>UK</strong> <strong>Renewable</strong> <strong>Energy</strong> <strong>Roadmap</strong>Conclusions from our analysis2.28 Our analysis suggests <strong>the</strong> following:• Even though we are starting from a low level <strong>the</strong> <strong>UK</strong> can meet <strong>the</strong> target todeliver 15% of <strong>the</strong> <strong>UK</strong>’s energy consumption from renewable sources by<strong>2020</strong> through domestic deployment. Recent ‘bottom-up’ analysis, based onindustry inputs, suggests that <strong>the</strong>re is significant upside potential anddownside risk to deployment;• Based on current information, and taking account of <strong>the</strong>ir long term potentialas well as <strong>the</strong>ir cost effectiveness, 8 technologies are capable of deliveringmore than 90% of <strong>the</strong> renewable energy we estimate is required by <strong>2020</strong>;• The pipeline of renewable electricity projects is healthy. Although, allowingfor historic dropout rates 27 , it puts us on track to deliver approximately 29GW of capacity by <strong>2020</strong>, significant uncertainties remain and we still urgentlyneed new renewable projects to come forward to ensure we meet <strong>the</strong> 15%target and longer term carbon reduction targets;• The pipeline for renewable heat projects is less well developed but following<strong>the</strong> introduction of <strong>the</strong> world’s first incentive for renewable heat could deliverup to an additional 100,000 heat pumps and an additional 24,000 biomass28heat installations by <strong>2020</strong>;• Road transport biofuels are proposed to increase to 5% of road transportfuels by 2014. Subject to <strong>the</strong> results of current consultations, Governmentwill come forward with options in Spring 2012 to stimulate fur<strong>the</strong>r growth inrenewable transport for <strong>the</strong> period after 2014;• Costs of renewable energy technologies are currently high and uncertain butare expected to fall over time as supply chains develop, technical challengesare overcome and technologies are demonstrated to be effective.27 This figure does not include conversion from coal plant (this is currently not picked up in REPD) or co-firingcapacity.28 Biomass heat installations including biomass boilers, biogas injection and biomass district heatinginstallations26
<strong>UK</strong> <strong>Renewable</strong> <strong>Energy</strong> <strong>Roadmap</strong>Chapter 3: Actions3.1 Government has worked with industry to identify <strong>the</strong> key challenges to increase<strong>the</strong> deployment of renewable energy in <strong>the</strong> <strong>UK</strong>. The main focus of this Chapteris on each of <strong>the</strong> 8 technologies that toge<strong>the</strong>r could deliver more than 90% of<strong>the</strong> effort required for <strong>2020</strong>. A number of actions also apply to a wide range ofrenewable technologies. These ‘cross cutting actions’ are described below.Cross-cutting actions3.2 Our work with industry indicates that <strong>the</strong>re are at least six cross-cutting barriersto deployment which impact on more than one of <strong>the</strong> key technologies but thatmay not apply to all 8. Without alleviating <strong>the</strong>se overarching challenges, <strong>the</strong>removal of technology-focused constraints could have a limited impact and mayfail to unlock <strong>the</strong> capacity from individual technologies or bring down costsquickly enough. To create <strong>the</strong> right market conditions we are:• Facilitating access to <strong>the</strong> grid: Grid access arrangements can delay orprevent renewable electricity deployment on and offshore. Currently, 5.5 GWof renewable electricity projects with planning consent are waiting to beconnected to <strong>the</strong> grid 29 . The construction of an offshore grid is critical for <strong>the</strong>deployment of offshore wind and also for future deployment of wave and tidalenergy. We are taking action to reform <strong>the</strong> onshore grid and establish <strong>the</strong>framework offshore necessary to deploy <strong>the</strong> levels of renewable electricity weanticipate are necessary for <strong>2020</strong>.• Ensuring long term investment certainty: <strong>Renewable</strong>s developers andinvestors require certainty over incentives on which to base investmentdecisions. The total investment requirement to deliver 15% renewables for<strong>2020</strong> and beyond to 2050 will run into hundreds of billions of pounds. We areputting in place a transparent and long lived financial framework through <strong>the</strong>introduction of incentives for heat and reforming <strong>the</strong> electricity market. As partof this we are taking action to ensure a managed transition from <strong>the</strong><strong>Renewable</strong>s Obligation, including bringing forward <strong>the</strong> Banding Review, tosecure <strong>the</strong> 22 GW of renewable electricity capacity currently in <strong>the</strong> pipeline 30as well as bring forward additional projects.• Tackling pre- and post- consent delays: We recognise <strong>the</strong> need to ensurethat projects have as many benefits and as few adverse impacts as possiblein financial, economic and environmental terms. However, delays in <strong>the</strong>planning process or difficulties in discharging conditions attached to consentscan have a significant impact on deployment. This can impact across <strong>the</strong>range of technologies both on and offshore. For example, <strong>the</strong>re is currently29 National Grid, Transmission Networks Quarterly Connections Update – April 2011http://www.nationalgrid.com/NR/rdonlyres/41AAF4ED-4121-4C4F-B83E-7BF68C0B4FB3/46624/TNQCUApril2011v1.pdf30 <strong>Renewable</strong> <strong>Energy</strong> Planning Database – May 2011 data -https://restats.decc.gov.uk/app/reporting/decc/datasheet27
<strong>UK</strong> <strong>Renewable</strong> <strong>Energy</strong> <strong>Roadmap</strong>5 GW of onshore and 7 GW of offshore wind capacity impacted by radarinterference. We will ensure a radar replacement programme is rolled out thisyear. Government is also reforming <strong>the</strong> planning system for majorinfrastructure in England and Wales, to replace <strong>the</strong> Infrastructure PlanningCommission with a democratically accountable system, and to ensure thatlocal planning in England 31 supports economic growth and gives localcommunities a greater say and stake in development.• Ensuring sustainable bioenergy feedstock supply: Bioenergy could, ifsuitable feedstocks are available, deliver around half of <strong>the</strong> total generationwe estimate will be required to meet our 15% target by <strong>2020</strong>. Concerns about<strong>the</strong> sustainability of bioenergy feedstocks could limit <strong>the</strong> use of bioenergy in<strong>the</strong> electricity, heat and transport sectors. We are putting in placesustainability standards, developing a Bioenergy Strategy to be clear about<strong>the</strong> availability and best use of this resource, and ensuring that sustainablefeedstocks are fully exploited.• Facilitating development of renewables supply chains: Most technologiesface some degree of supply chain constraint, whe<strong>the</strong>r for equipment,installers, or infrastructure, but <strong>the</strong> severity of <strong>the</strong>se constraints will vary bytechnology. They will be particularly important, for example, in developingmarkets such as offshore wind, marine, heat pumps, and ultra low-emissionsvehicles. The Government’s financial incentives for renewable energy willprovide greater market confidence about future deployment levels, helping tostimulate supply chain development. In addition, we are taking specificmeasures to encourage <strong>the</strong> development of port and manufacturing facilitiesfor offshore wind, Marine <strong>Energy</strong> Parks, charging infrastructure for plug-invehicles, and plans for better certification and assessment of installers forsmall scale technologies, including domestic heat.• Encouraging innovation: Whilst some technologies needed for <strong>the</strong> <strong>2020</strong>target are relatively mature, such as onshore wind and biomass boilers, o<strong>the</strong>rssuch as offshore wind and marine are not yet fully developed. By encouraginginnovation in <strong>the</strong>se areas Government can help developers overcome <strong>the</strong>remaining engineering challenges, lower cost, and improve <strong>the</strong> reliability oftechnologies used. This will reduce <strong>the</strong> overall cost of meeting <strong>the</strong> <strong>2020</strong>renewables target and longer term carbon reduction targets, and <strong>the</strong> impacton public spending and consumer bills. We are committing an additional £50mover <strong>the</strong> next 4 years, subject to value for money assessment, to supportinnovation in offshore and marine technologies, and considering fur<strong>the</strong>rallocation, including for energy from waste and biomass, details of which willbe available in <strong>the</strong> Autumn.Technology Action Plans3.3While renewable deployment across all technologies will be important, <strong>the</strong><strong>Roadmap</strong> focuses in particular on <strong>the</strong> 8 technologies which have ei<strong>the</strong>r <strong>the</strong>31 Some elements of planning are devolved, <strong>the</strong>refore <strong>the</strong>re are differences across <strong>the</strong> <strong>UK</strong>.28
<strong>UK</strong> <strong>Renewable</strong> <strong>Energy</strong> <strong>Roadmap</strong>greatest potential to help <strong>the</strong> <strong>UK</strong> meet <strong>the</strong> <strong>2020</strong> target in a cost effective andsustainable way, or offer <strong>the</strong> greatest potential for <strong>the</strong> decades that follow. ThisChapter sets out a plan for each of <strong>the</strong> 8. Within each plan we have:• Estimated changes in capacity and growth rate: Using <strong>the</strong> current levels ofdeployment, an understanding from <strong>the</strong> market of deployment potential, andwhere it exists, data about <strong>the</strong> capacity in <strong>the</strong> pipeline, we have estimated <strong>the</strong>increase in capacity and growth rate that is consistent with meeting our <strong>2020</strong>target;• Identified challenges to deployment: We have undertaken work to betterunderstand <strong>the</strong> journey to deployment, from scoping and application, toconsent, development and final operation. Taking a systematic approach inthis way enables us to better understand <strong>the</strong> key constraints and bottlenecksto deployment.• Developed a bespoke package of actions: Combining our understanding of<strong>the</strong> challenges to deployment with evidence from <strong>the</strong> pipeline to identify <strong>the</strong>scale of <strong>the</strong> risk. This has informed <strong>the</strong> development of a bespoke package ofactions that address <strong>the</strong> most immediate challenges to deployment for eachtechnology.3.4 This is <strong>the</strong> first set of plans. We will continue to ga<strong>the</strong>r evidence aboutdeployment to better understand <strong>the</strong> challenges and will update our approachannually.29
<strong>UK</strong> <strong>Renewable</strong> <strong>Energy</strong> <strong>Roadmap</strong>Onshore wind• The <strong>UK</strong> has more than 4 GW of installed onshore wind capacity in operation(generating approximately 7 TWh of electricity annually) 32 .• The central range for deployment indicates that onshore wind could contribute up toaround 13 GW by <strong>2020</strong>. Achieving this level of capacity equates to an annual growth33rate of 13% .• The existing pipeline for onshore wind contains an additional 11 GW. When takentoge<strong>the</strong>r with <strong>the</strong> existing operational capacity, this could contribute a significantproportion of <strong>the</strong> central range for <strong>2020</strong> given historic planning approval rates although34<strong>the</strong>re are concerns with <strong>the</strong> pace at which capacity can be brought through .• Challenges to deployment include: minimising investment risk; reform <strong>the</strong> planningsystem; overcoming radar interference from windfarms; and ensuring cost-effective gridinvestment and connection.Priority actions:• Minimise investment risk: Implement proposed electricity market reform and ROtransition measures to secure long term certainty to <strong>2020</strong> and beyond and enablehistorically strong investor confidence in onshore wind to be maintained.• Reform <strong>the</strong> planning system in England and Wales: Set out <strong>the</strong> national need for newrenewable energy infrastructure through ratification of National Policy Statements.Replace <strong>the</strong> Infrastructure Planning Commission with a fast track process for majorinfrastructure projects. Reform <strong>the</strong> local planning system in England to ensure that itsupports economic growth, give communities a greater say and stake in development,and help local authorities and communities to identify opportunities for <strong>the</strong> deploymentof renewables using analysis from regional studies. Improve guidance on issues ofpublic concern such as noise impact to ensure high quality planning decisions.• Overcome radar interference with windfarms: Work with <strong>the</strong> signatories of a newMemorandum of Understanding to develop, fund and implement radar mitigationprogrammes over <strong>the</strong> first half of this decade. Jointly fund, with industry and <strong>the</strong> CrownEstate, a new early warning radar system for RAF Trimingham.• Ensure cost-effective grid investment and connection: Work with Ofgem through ProjectTransmiT to help plan grid investments and <strong>the</strong> regime for charging new connections to<strong>the</strong> transmission network. National Grid will consult later this summer on long-termfinancial security arrangements including Final Sums Liability. Monitor <strong>the</strong> impact of“Connect and Manage”, and take corrective actions if necessary.Current deployment3.5 There is currently 4 GW of operational onshore wind capacity in <strong>the</strong> <strong>UK</strong>,generating around 7 TWh annually. In capacity terms, this is <strong>the</strong> single mostdeployed renewable electricity technology and is most established in Scotland(~2.5 GW), where over 60% of <strong>UK</strong> wind resource is found, followed by England(~0.9 GW), Wales (~0.4 GW) and Nor<strong>the</strong>rn Ireland (~0.3 GW).32 Source: <strong>Energy</strong> Trends June 201133 All growth rates are Compound Annual Growth Rates34 The assumed success rate for pipeline projects is based on observed success rates for projects determinedbetween 2007 and 2011. Nation-specific success rates were calculated for pre-consent projects (to reflect <strong>the</strong>fact that planning arrangements differ across <strong>the</strong> <strong>UK</strong>). For post-consent projects a <strong>UK</strong>-wide figure was used30
<strong>UK</strong> <strong>Renewable</strong> <strong>Energy</strong> <strong>Roadmap</strong>Deployment potential3.6 Figure 10 sets out results of recent analysis of potential growth for onshorewind to <strong>2020</strong>. It overlays an industry view of <strong>the</strong> deployment that could beachieved (<strong>the</strong> ‘industry high’ and ‘industry low’ scenarios) around a modelbasedcentral range.3.7 The central range indicates that we could see up to around 13 GW of onshorewind capacity by <strong>2020</strong>. The majority of this would be from large scale projectsover 5 MW. Achieving this 9 GW increase would require an annual growth rateof 13% over <strong>the</strong> next decade, slightly less than <strong>the</strong> growth rate experiencedbetween 2009-2010 35 . The industry scenarios suggests <strong>the</strong> potential to bringforward a total of between 10-19 GW of onshore wind by <strong>2020</strong> (equivalent to23-45 TWh).Figure 10: Deployment potential to <strong>2020</strong> for onshore wind3.8 The industry low scenario of 10 GW assumes that <strong>the</strong> ability to build and installturbines is a limiting factor for deployment. The industry high scenario of 19 GWassumes that build rate is not a limiting factor and that capacity currently in <strong>the</strong>pipeline is consented and moves rapidly to construction. It also assumes thatgrowth slows after 2015 due to a limit on <strong>the</strong> number of sites available, growthof competing technologies and cumulative planning impacts.3.9 Analysis 36 suggests that <strong>the</strong> levelised cost of onshore wind could range from£71-£122MWh in <strong>2020</strong>, down only marginally from £75-£127 in 2010. Cost35 Source: Growth rate for onshore wind capacity between 31 Dec 2009 and 31 Dec 2010 was 15.9% (<strong>Energy</strong>Trends June 2011)36 Analysis by Arup and Ernst & Young summarised in section 2.2 of <strong>the</strong> <strong>Roadmap</strong>.31
<strong>UK</strong> <strong>Renewable</strong> <strong>Energy</strong> <strong>Roadmap</strong>reductions are expected to be limited as onshore wind is a mature technology,restricting <strong>the</strong> scope for fur<strong>the</strong>r learning or technological progress asdeployment increases. Cost ranges are wide however, reflecting variation instakeholders views about capital cost, driven by project specific factors such as<strong>the</strong> location of windfarms and scale.Deployment pipeline3.10 As illustrated in Figure 11, <strong>the</strong>re is currently over 11 GW of onshore windcapacity currently under construction, awaiting construction, or in planning in<strong>the</strong> <strong>UK</strong>.Figure 11: Capacity of onshore wind projects in <strong>the</strong> planning pipeline 373.11 Assuming historic consent rates 38 <strong>the</strong> existing planning pipeline could deliver8.9 GW which, taken with current capacity, would provide a level of growthconsistent with <strong>the</strong> high end of <strong>the</strong> central range.3.12 This pipeline capacity is distributed across <strong>the</strong> <strong>UK</strong> with <strong>the</strong> majority in Scotland(over 6.5 GW), over 2 GW in England, a fur<strong>the</strong>r 1.5 GW in Wales, and 1.0 GWin Nor<strong>the</strong>rn Ireland. Of <strong>the</strong> applications currently awaiting planning consent,over 88% (totalling 2.7 GW) are under 50 MW and will be decided at locallevel 39 . The remaining 12% of projects (totalling 3.6 GW) are 50 MW or overand are awaiting decision from <strong>the</strong> Government or relevant DevolvedAdministration.37 Based on historic consenting rates, <strong>the</strong> capacity shown in green could potentially be lost from <strong>the</strong> pipeline38 Historic rejection rate based on capacity from 2007-present, weighted by nation in planning stage.39 NB. apart from in Nor<strong>the</strong>rn Ireland, where all projects of all scales are determined by <strong>the</strong> Planning Service32
<strong>UK</strong> <strong>Renewable</strong> <strong>Energy</strong> <strong>Roadmap</strong>3.13 By tackling <strong>the</strong> challenges to deployment outlined below, we will, subject tolocal consent decisions, help projects which are currently in <strong>the</strong> pipeline tocommission. New proposals will also be required to come forward to meet <strong>the</strong><strong>2020</strong> ambition and longer term decarbonisation.Journey to deployment3.14 Figure 12 presents a developer journey map for onshore wind. This outlines <strong>the</strong>stages of <strong>the</strong> delivery process for onshore wind projects in England and <strong>the</strong>delivery partners who contribute to it (<strong>the</strong> process is similar in <strong>the</strong> rest of <strong>the</strong><strong>UK</strong>, but <strong>the</strong>re are some differences at <strong>the</strong> planning stages). The average timefrom identifying a site to exporting electricity to <strong>the</strong> grid is around five years,although this masks considerable variation by project. The process fordeveloping a larger scale project is illustrated below, with key areas ofchallenge highlighted in red. To increase <strong>the</strong> build rates and shortendevelopment time, we must tackle <strong>the</strong> barriers set out below.Figure 12: Developer journey map for <strong>the</strong> deployment of onshore wind projectsChallenges to deployment and actions3.15 Our discussions with industry and analysis of deployment statistics suggest thatdevelopers must overcome at least four main challenges to deploy onshorewind projects.Minimise investment risk3.16 Developers require a degree of certainty about returns if <strong>the</strong>y are to makeconfident investment decisions. Investor confidence in this proven technology ishigh, though currently tempered by perceived uncertainty about <strong>the</strong> level andsurety of long-term financial support from Government. This has affected both33
<strong>UK</strong> <strong>Renewable</strong> <strong>Energy</strong> <strong>Roadmap</strong><strong>the</strong> quantity of investment utilities can fund from <strong>the</strong>ir balance sheets and <strong>the</strong>quantity and cost of project finance available to developers.3.17 The Government has set out its plans to reform <strong>the</strong> electricity market alongsidethis <strong>Roadmap</strong>. This will include steps to improve <strong>the</strong> market’s ability to finance<strong>the</strong> investment in low carbon electricity that is needed over <strong>the</strong> next decade andbeyond. It will put in place a transparent and long-term financial framework forlow carbon electricity, including renewable power, structured around a newFeed-in-Tariff with Contracts-for-Difference. Nor<strong>the</strong>rn Ireland will consider how<strong>the</strong>se proposals can work in <strong>the</strong>ir All Island <strong>Energy</strong> market.3.18 In implementing this change, <strong>the</strong> Government will ensure a smooth transitionfrom <strong>the</strong> <strong>Renewable</strong>s Obligation (RO). In particular, once <strong>the</strong> new scheme isintroduced, new generators will have <strong>the</strong> choice between <strong>the</strong> two schemes until2017 and following <strong>the</strong> closure of <strong>the</strong> RO to new entrants, technology paymentsmade under <strong>the</strong> RO will be grandfa<strong>the</strong>red 40 . In addition, <strong>the</strong> Government hasaccelerated <strong>the</strong> current Banding Review to provide clarity sooner on futuresupport levels under <strong>the</strong> RO – Government will consult in summer 2011 andpublish its decision by <strong>the</strong> end of <strong>the</strong> year, one year earlier than originallyplanned.3.19 Discussions over <strong>the</strong> participation of <strong>the</strong> Devolved Administrations in <strong>the</strong> newsupport mechanisms are on-going. All jurisdictions are committed to supportrenewables and if <strong>the</strong>y propose to close <strong>the</strong>ir RO support mechanisms in duecourse, Scotland and Nor<strong>the</strong>rn Ireland will consider doing so alongside Englandand Wales, on <strong>the</strong> basis of transition arrangements in <strong>the</strong> EMR White PaperActions:• DECC will consult on new RO banding levels in summer 2011 and publish itsdecisions by <strong>the</strong> end of <strong>the</strong> year. New banding levels for onshore wind willcome into force in April 2013.• DECC will put in place arrangements to ensure a smooth transition from <strong>the</strong><strong>Renewable</strong>s Obligation to <strong>the</strong> new electricity market support mechanism.Reforming <strong>the</strong> planning system3.20 The planning system plays a central role in delivering <strong>the</strong> infrastructure weneed to reduce our carbon emissions, to ensure continued security of energysupply and help our economy to grow. It has a vital role in safeguarding ourlandscape and natural heritage and allowing individual communities <strong>the</strong>opportunity to shape <strong>the</strong>ir environment.3.21 <strong>UK</strong> consent rates for onshore wind projects vary from around 60% in Scotlandand Wales, to 80% in Nor<strong>the</strong>rn Ireland and 54% in England 41 . Developersremain concerned about <strong>the</strong> time taken to decide applications, a lack oftransparency, and apparent inconsistency across <strong>the</strong> <strong>UK</strong> in <strong>the</strong> way decisions40 Grandfa<strong>the</strong>ring is a policy that support levels should not change once generation has been accredited undera scheme, <strong>the</strong>reby providing investors greater certainty.41 Projects submitted to planning since 200734
<strong>UK</strong> <strong>Renewable</strong> <strong>Energy</strong> <strong>Roadmap</strong>are reached. For <strong>the</strong>ir part, communities may be concerned about <strong>the</strong> possibleimpacts of windfarms and associated grid infrastructure on landscapes andlocal amenity. This has led to a situation where many developments areapproved on appeal - over 50% of <strong>UK</strong> sub-50MW 42 onshore wind projectsrejected by local planning committees are eventually approved through thisroute.3.22 These factors increase cost, delay or risk revenue, and could deter developersfrom making applications in <strong>the</strong> first place or lead <strong>the</strong>m to drop applications ifinitially rejected. This risks both <strong>the</strong> 6GW of onshore wind currently awaitingdetermination in <strong>the</strong> <strong>UK</strong> and projects which have not yet come forward.3.23 The Localism Bill will reform <strong>the</strong> planning system for major infrastructureprojects over 50MW in England and Wales, once National Policy Statementsare ratified. The Government laid its energy National Policy Statements beforeParliament on 23 June for approval, setting out <strong>the</strong> national need for newenergy infrastructure in <strong>the</strong> <strong>UK</strong>. These will set <strong>the</strong> decision-making frameworkfor applications for nationally significant energy infrastructure, includingrenewable energy. The new planning system sets a time limit of nine monthsfor <strong>the</strong> Infrastructure Planning Commission to determine applications from <strong>the</strong>start of examination. Under <strong>the</strong> Localism Bill, <strong>the</strong> Government has introducedplans to replace <strong>the</strong> Infrastructure Planning Commission with a new MajorInfrastructure Planning Unit within <strong>the</strong> Planning Inspectorate 43 . The new Unitwill consider applications for energy infrastructure and advise <strong>the</strong> Secretary ofState for <strong>Energy</strong> and Climate Change, who will determine applications. TheGovernment will review <strong>the</strong> effectiveness of this regime once a range of caseshave been through it.3.24 The Government believes that <strong>the</strong> current local planning system is toocentralised and costly and disempowers communities. It has failed to deliver<strong>the</strong> development that <strong>the</strong> country needs. That is why we are introducingfundamental reform to make sure that <strong>the</strong> planning system, supported bypowerful new financial incentives, makes <strong>the</strong> right land available in <strong>the</strong> rightplaces for development, and will deliver <strong>the</strong> development and smaller scaleinfrastructure that is needed.3.25 Projects are generally more likely to succeed if <strong>the</strong>y have broad public supportand <strong>the</strong> consent of local communities. This means giving communities both asay and a stake, in appropriately-sited renewable energy projects likewindfarms. The Localism Bill is returning decision-making powers on housingand planning to local councils.3.26 The Government is introducing powerful new incentives to encourage supportfor new development. We have committed to allowing communities that hostrenewable energy projects to keep <strong>the</strong> additional business rates <strong>the</strong>y generateand this is being taken forward through <strong>the</strong> Local Government Resource42 As above43 Provision will be made for dealing with applications made to IPC which are already in <strong>the</strong> system35
<strong>UK</strong> <strong>Renewable</strong> <strong>Energy</strong> <strong>Roadmap</strong>Review. <strong>Renewable</strong> energy development can also bring economic growth andnew jobs for <strong>the</strong> <strong>UK</strong> both locally and nationally.Case study: Mabey Bridge LtdBased in Chepstow, South Wales, Mabey Bridge has aturnover of £80 million and close to 500 employees. Thecompany's history can be traced back to <strong>the</strong> constructionof Brunel's Wye railway bridge in 1849.Mabey Bridge’s <strong>UK</strong> Division specialises in <strong>the</strong> fabrication,erection and protective treatment of high quality platedsteelwork for bridges, wind turbine towers, monopiles ando<strong>the</strong>r heavy steel structures in <strong>the</strong> <strong>UK</strong> and Ireland.The Bevil Mabey Structural Steelworks, opened on 12th May 2011, is part of <strong>the</strong>company's £38 million investment in <strong>the</strong> renewable energy sector. The new facility, <strong>the</strong><strong>UK</strong>’s only indigenous manufacturer of wind turbine towers and monopiles, has createdsome 240 jobs in addition to <strong>the</strong> 400 already employed by <strong>the</strong> company in Chepstow andLydney.The 25,000 square metre facility will make up to 300wind turbine towers per annum, each up to 120m long.The factory uses <strong>the</strong> latest manufacturingtechniques including computer controlled cutting androlling, robotic welding, and an automated paintingfacility and will put South Wales at <strong>the</strong> heart of <strong>the</strong>move towards a low carbon economy.3.27 The Government will shortly consult on a new National Planning PolicyFramework for England, to consolidate existing planning policy (including forenergy projects below 50MW) into a single document. The framework willinclude a new presumption in favour of sustainable development.3.28 In addition, <strong>the</strong> Government has committed to consulting later this year on apackage of measures that will streamline and simplify planning applications inEngland. Fur<strong>the</strong>rmore, in <strong>the</strong> Plan for Growth (March 2011), <strong>the</strong> Governmentannounced its intention to introduce a ‘planning guarantee’ that it would take nomore than 12 months to reach a final decision on planning applications,including any associated appeal.3.29 In Wales, Planning Policy Wales (PPW) was updated earlier this year toprovide guidance on renewable and low carbon energy projects. This issupplemented by Technical Advice Note 8 <strong>Renewable</strong> <strong>Energy</strong> (TAN8), and <strong>the</strong>Local Development Plan system which enables communities and businesses toshape future development in <strong>the</strong>ir areas.3.30 In Scotland, work is also being coordinated by <strong>the</strong> Scottish Government todevelop good practice in reconciling objectives for <strong>the</strong> deployment of onshore,and offshore, wind with wider environmental objectives, and actively involvingcommunities in planning and implementation. The GP (Good Practice) Wind36
<strong>UK</strong> <strong>Renewable</strong> <strong>Energy</strong> <strong>Roadmap</strong>project involves stakeholders from eight European countries and will produce aGood Practice Guide and <strong>the</strong> "how to" toolkit which will provide valuable onlineresources for industry, NGOs, policy makers, local and regional authorities, andlocal communities.3.31 To inform all planning decision making, DECC will ensure that an up-to-dateevidence base is available on <strong>the</strong> potential impacts of wind turbines, such asnoise and shadow flicker (for which DECC published research recently),intermittency, and implications for landscape, habitats and species. It has alsohelped local authorities and communities to identify opportunities for <strong>the</strong>deployment of renewables using analysis from regional studies.3.32 As outlined in <strong>the</strong> Microgeneration Strategy 44 , <strong>the</strong> Government recognises thatcommunity scale generation can provide significant economies of scale as wellas benefits to <strong>the</strong> local community, and will provide more information to support<strong>the</strong>ir development through DECC’s Community <strong>Energy</strong> Online web portal.Actions:• Set <strong>the</strong> decision making framework for projects of nationally significantinfrastructure, including renewables, through <strong>the</strong> ratification of <strong>the</strong> NationalPlanning Statements• DCLG will consult on <strong>the</strong> new draft National Planning Policy Framework forEngland in summer 2011.• The Local Government Resource Review will publish proposals to allow localretention of business rates, including those relating to renewable energyprojects in July 2011.• DCLG will publish details of a ‘planning guarantee’ by <strong>the</strong> end of <strong>the</strong> year with<strong>the</strong> intention that it will take no longer than 12 months to reach a final decisionon planning applications including any associated appeal.• The GP Wind Project, coordinated by <strong>the</strong> Scottish Government, will deliver itsgood practice guide and a ‘how to’ toolkit in Spring 2012.Overcome radar interference with windfarms3.33 Onshore and offshore windfarms can interfere with aviation radar systems. Thisleads to planning objections by both civil aviation operators, such as airportsand National Air Traffic System (NATS), and by <strong>the</strong> Ministry of Defence (MOD)for air defence and air traffic control radar. In this case, impact on radar mustbe mitigated in order for planning conditions to be discharged and constructionto proceed.3.34 This has become one of <strong>the</strong> most significant non-financial barriers constraining<strong>the</strong> deployment of wind. We estimate that around 5 GW of onshore and 7 GWof offshore wind projects in scoping, planning, and awaiting construction maybe impacted by radar. In addition, <strong>the</strong>re is currently 1.9 GW of onshore windcapacity ‘awaiting construction’ which was consented over two years ago, and44 http://www.decc.gov.uk/en/content/cms/meeting_energy/microgen/strategy/strategy.aspx37
<strong>UK</strong> <strong>Renewable</strong> <strong>Energy</strong> <strong>Roadmap</strong>industry estimate <strong>the</strong> majority of this is held up by <strong>the</strong> need for developers tomeet planning conditions related to radar 45 .3.35 DECC has worked with developers and o<strong>the</strong>rs to fund research anddevelopment into technical solutions to upgrade radar and mitigate <strong>the</strong>problems caused by windfarms. This includes a direct contribution to fundingR&D into upgrade solutions for NATS’ fleet of radar, which deliver en-routeservices to aircraft flying over <strong>the</strong> <strong>UK</strong>. The Government has also helpedfacilitate <strong>the</strong> wind industry’s funding for Cambridge Consultants holographic infillradar solutions, which can be deployed at specific windfarms to mitigateagainst interference with terminal radar at airports, and interference with NATSinfrastructure. If this R&D results in successful implementation of solutions, itwill enable several planning conditions relating to radar interference to bedischarged and construction of windfarms to proceed. This will also free-uppotential future wind developments in <strong>the</strong> impacted areas.3.36 These technical solutions are now beginning to emerge and become available.However, to-date funding into R&D has been managed on a case by casebasis, and <strong>the</strong> next step – moving to implementation of <strong>the</strong> technical solutions –relies on <strong>the</strong> ability and willingness of leading developers to fund <strong>the</strong> upgrades,regardless of how many o<strong>the</strong>r developers may benefit in <strong>the</strong> future. Thispiecemeal approach has led to uncertainty and additional costs on <strong>the</strong>sedevelopers and can reduce <strong>the</strong> incentive to invest.3.37 Today <strong>the</strong> Government is announcing <strong>the</strong> signing of a new Memorandum ofUnderstanding, which commits <strong>the</strong> signatories to move from supporting R&D, toensuring that <strong>the</strong> software and hardware solutions identified are implemented,and to begin to look for solutions to o<strong>the</strong>r windfarm-related aviation problems,such as navigation and communications services.3.38 The technological complexity of <strong>the</strong> radar interference problem means that asingle technical solution is not possible, and a suite of different solutions needsto be developed. However, a generic approach to rolling out and applyingtechnical solutions, and support for regional approaches where <strong>the</strong>y arepossible, will incentivise investment in <strong>the</strong> necessary infrastructure, and soenable onshore and offshore wind deployment that would o<strong>the</strong>rwise not bepossible. DECC will continue to work with DfT, <strong>the</strong> MOD, <strong>the</strong> wind industry andaviation partners to make progress towards this goal.3.39 An example of <strong>the</strong> potential impact of radar on deployment of wind can befound in <strong>the</strong> Greater Wash, where <strong>the</strong> MOD had concerns about <strong>the</strong> impact offive large scale projects on defence radar at Trimingham on <strong>the</strong> Norfolk coast.DECC agreed to contribute £4 million towards development of a new radar thatwill become operational in November 2011. This will facilitate <strong>the</strong> developmentof 2 GW of offshore wind in <strong>the</strong> Greater Wash and has <strong>the</strong> potential to free up afur<strong>the</strong>r 6 GW.45 Source: <strong>Renewable</strong>s <strong>UK</strong> – December 201038
<strong>UK</strong> <strong>Renewable</strong> <strong>Energy</strong> <strong>Roadmap</strong>Actions:• DECC will work with <strong>the</strong> signatories of a new Memorandum of Understanding todevelop, resource and implement radar mitigation programmes for defence andcivilian aviation radar over <strong>the</strong> next few years.• DECC is jointly funding, with industry and The Crown Estate, a new earlywarningradar system for <strong>the</strong> MOD based at RAF Trimingham.Case study: Scottish and Sou<strong>the</strong>rn <strong>Energy</strong>’s Clyde windfarmSSE (Scottish andSou<strong>the</strong>rn <strong>Energy</strong> plc)has produced <strong>the</strong> firstelectricity from itsClyde windfarm inSouth Lanarkshire.Once completed <strong>the</strong>350 MW windfarm,Europe’s biggest singleconsented onshorewindfarm, will comprise152 turbines andgenerate enough power for 270,000 homes. The first of <strong>the</strong> windfarm’s three sectionsshould be finished by <strong>the</strong> end of this year and <strong>the</strong> whole of <strong>the</strong> farm in 2012. Anagreement between SSE and NATS (en route) plc on arrangements to maintain a safeand efficient air traffic control service over <strong>the</strong> site has been reached, while <strong>the</strong>construction of <strong>the</strong> permanent new primary radar facility is completed.The windfarm represents an investment of £500 million. More than 200 construction jobsare being created while <strong>the</strong> windfarm is being built and after it is set up and running a staffof 30 will be employed to operate and maintain <strong>the</strong> site.Ensure cost-effective grid investment and connection3.40 To deliver <strong>the</strong> quantity of onshore wind for <strong>2020</strong> indicated in <strong>the</strong> central range,<strong>the</strong> <strong>UK</strong> will need to substantially upgrade its onshore transmission capacity –overcoming finance, coordination and planning challenges to do so – andensure that developers secure timely and cost-effective access to <strong>the</strong> network.3.41 Currently, some developers report concerns about <strong>the</strong> transmission charges<strong>the</strong>y face (particularly in remote locations including some parts of Scotland andWales) and <strong>the</strong> ‘Final Sums Liabilities’ <strong>the</strong>y must provide before new lines areput up 46 .3.42 Timeliness of connection is much less of an issue than it used to be, with over1.8 GW of onshore wind projects advancing <strong>the</strong>ir connection dates by anaverage of around four years since 2009 due to <strong>the</strong> introduction of <strong>the</strong> ‘Connect46 To cover <strong>the</strong> risk that generation plant will fail to go ahead, stranding <strong>the</strong> grid assets produced39
<strong>UK</strong> <strong>Renewable</strong> <strong>Energy</strong> <strong>Roadmap</strong>and Manage’ arrangements. However, some £4.7bn 47 of investment will berequired in <strong>the</strong> onshore grid in <strong>the</strong> years to <strong>2020</strong> to maintain progress andaccommodate <strong>the</strong> overall level of renewable electricity needed by <strong>2020</strong>.Without investment, much of <strong>the</strong> additional capacity of up to 13 GW of onshorewind by <strong>2020</strong> anticipated in <strong>the</strong> central range could be at risk.3.43 To incentivise <strong>the</strong> necessary network investment, Ofgem introduced a newframework for approving investment proposals (“RIIO” 48 ) and will ensure thatTransmission Owners’ business plans, approved under this framework, areimplemented by Spring 2013. In addition, DECC has asked <strong>the</strong> ElectricityNetworks Strategy Group (ENSG) to update its assessment of <strong>the</strong> transmissionnetwork investment required to <strong>2020</strong> and, from June, to put in place a processto monitor delivery of this investment. DECC has, in <strong>the</strong> National PolicyStatements, set out <strong>the</strong> need for new transmission infrastructure in <strong>the</strong> <strong>UK</strong>,providing a basis for <strong>the</strong> consideration of future planning applications fornationally significant infrastructure. In Nor<strong>the</strong>rn Ireland <strong>the</strong> approval ofinvestment proposals is undertaken by <strong>the</strong> Utility Regulator for Nor<strong>the</strong>rn Irelandthrough its Regulatory Price Control process. The Utility Regulator is currentlyconsulting on <strong>the</strong> price control which will cover <strong>the</strong> period 2012-2017.3.44 To ensure timely and cost-effective connection of distributed generation, Ofgemissued an Open Letter requesting views by <strong>the</strong> end of May 2011 on <strong>the</strong>challenges to connecting to <strong>the</strong> distribution network. In addition, it is usingProject TransmiT 49 to review <strong>the</strong> connection and transmission charging regime,with a view to making any appropriate changes by April 2012. Recent reformshave reduced <strong>the</strong> average level of Final Sum Liabilities required of companies,but in response to continuing concerns from developers National Grid intendsto publish a consultation on fur<strong>the</strong>r proposals on financial securityarrangements later this year. It will aim to implement any changes required byApril 2012.Actions:• National Grid will publish a consultation on proposals for suitable long termfinancial security arrangements in summer 2011, with implementation of anychanges required by April 2012.• DECC will designate <strong>the</strong> National Policy Statements in July 2011, subject to<strong>the</strong>ir approval by Parliament, setting out <strong>the</strong> need for new transmissioninfrastructure• Ofgem is reviewing <strong>the</strong> transmission charging regime through Project TransmiTand plans to implement any changes required by April 2012.• Transmission Owners’ business plans – approved by Ofgem through <strong>the</strong> RIIOframework – will be implemented in spring 2013.47 Based on data from <strong>the</strong> Electricity Networks Strategy Group.48 Ofgem’s RIIO strategy document was published in March 2011, and will guide network companies todevelop well-justified business plans setting out <strong>the</strong>ir proposals for future network build.http://www.ofgem.gov.uk/Pages/MoreInformation.aspx?docid=120&refer=Media/FactSheets49 http://www.ofgem.gov.uk/Networks/Trans/PT/Pages/ProjectTransmiT.aspx40
<strong>UK</strong> <strong>Renewable</strong> <strong>Energy</strong> <strong>Roadmap</strong>• The ENSG will update its assessment of <strong>the</strong> investment needed in <strong>the</strong>transmission network through to <strong>2020</strong> and, from June, put in place a process tomonitor delivery of this.41
<strong>UK</strong> <strong>Renewable</strong> <strong>Energy</strong> <strong>Roadmap</strong>Offshore wind• The <strong>UK</strong> is <strong>the</strong> global leader for offshore wind energy with 1.3 GW of operational capacityacross 15 windfarms (which generated over 3 TWh during 2010) 50 .• The <strong>UK</strong> is well placed to continue this lead role to <strong>2020</strong> and beyond. The central rangeindicates that up to 18 GW could be deployed by <strong>2020</strong>. Beyond <strong>2020</strong> <strong>the</strong>re is a very51high potential for deployment with over 40 GW possible by 2030 .• Increasing <strong>the</strong> rate of deployment to realise this potential will require substantialreduction in costs. This necessitates action over and above what is already planned tohelp industry minimise investment risk, develop <strong>the</strong> supply chain, ensure cost-effectivegrid investment and connection, secure consents, and access finance.Priority actions:We are determined to drive down costs and are establishing an industry Task Force toset out a path and action plan to reduce <strong>the</strong> costs of offshore wind, from development,construction and operations to £100/MWh by <strong>2020</strong>. This will be supported by up to£30m, subject to value-for-money assessment, to foster collaboration betweentechnology developers and support innovation in <strong>the</strong> production of components over <strong>the</strong>next 4 years. This builds on existing support to increase <strong>the</strong> rate of innovation anddevelop <strong>the</strong> supply chain.• Innovate to reduce costs: Deliver a coordinated portfolio of investment in offshore windinnovation including support of up to £30m in 2011-2015 to reduce costs throughtechnology development and demonstration. Establish an offshore renewablesTechnology and Innovation Centre (TIC). The <strong>Energy</strong> Technologies Institute (ETI) willprovide £25m investment in a drive train test facility at <strong>the</strong> National <strong>Renewable</strong> <strong>Energy</strong>Centre (NaREC).• Develop <strong>the</strong> supply chain: Provide up to £60m for <strong>the</strong> development of windmanufacturing facilities at ports; work with high-value added manufacturers to exploitsupply chain opportunities. The Scottish Government will provide £70m to streng<strong>the</strong>nport and manufacturing facilities for offshore wind turbines and components inScotland.• Minimise investment risk: Complete accelerated RO Banding Review, implementelectricity market reform, and put in place EMR-RO transition arrangements• Access finance: Offshore wind will be a strong candidate for support from <strong>the</strong> GreenInvestment Bank (GIB). Work with developers and investors through <strong>the</strong> Offshore WindDevelopers Forum to identify <strong>the</strong> investment capital required for offshore wind andwhe<strong>the</strong>r fur<strong>the</strong>r Government action is appropriate. Take action to reduce investoruncertainty in relation to oil and gas clause in offshore windfarm leases.• Ensure cost-effective grid investment and connection: Offshore TransmissionCoordination Project review of incentives for coordination to ensure coordinateddevelopment of Round 3 offshore transmission assets. Develop long-term position onsecurity requirements for grid connection. Grid actions set out above are also relevantto offshore wind.• Planning and consenting: Manage <strong>the</strong> potential impacts of offshore developments ono<strong>the</strong>r users of <strong>the</strong> sea and broader environmental considerations through publication ofOffshore Strategic Environmental Assessment. Identify and, where appropriate,manage potential delays to consenting decisions50 <strong>Energy</strong> Trends June 201151 Based on data collected by Arup for <strong>the</strong>ir report on <strong>the</strong> RO Banding review.42
<strong>UK</strong> <strong>Renewable</strong> <strong>Energy</strong> <strong>Roadmap</strong>Current deployment3.45 The <strong>UK</strong> is <strong>the</strong> largest market for offshore wind energy in <strong>the</strong> world with aninstalled capacity of over 1.3 GW, around 4 GW post-consent, and some 2 GWin <strong>the</strong> planning system. Current operational capacity is located relatively closeto shore in 15 windfarms in <strong>the</strong> North and Irish Seas and Scottish TerritorialWaters (STW).Figure 13: Offshore wind activity in United Kingdom WatersThe Crown Estate, which owns most of <strong>the</strong>seabed out to <strong>the</strong> 12 nautical mile territoriallimit, has granted leases to developers in aseries of roundsRound 1 leases are typically close to shore,and have been mostly installed already – <strong>the</strong>ytotal around 1 GW of capacity. Round 2identified three strategic areas, totalling7.2 GW, which are under construction or indevelopment and will be responsible for <strong>the</strong>capacity additions expected over <strong>the</strong> next 3-4years.Round 3 leases offer up to 32 GW of newgeneration in 9 zones, which are significantlylarger than <strong>the</strong> areas identified under Rounds1 and 2 and likely to use larger turbines. Manyof <strong>the</strong> Round 3 zones are in deeper water,fur<strong>the</strong>r offshore, and are <strong>the</strong>refore moretechnically challenging. The Crown Estatealso granted exclusivity agreements in 2009for <strong>the</strong> development of 6.4 GW in ScottishTerritorial Waters. Nor<strong>the</strong>rn Ireland isconsidering a leasing round of at least600MW, subject to consultation.In order to provide a stable flow of construction projects to <strong>the</strong> offshore wind industry, inMay 2010 <strong>the</strong> Crown Estate also announced an additional 2 GW capacity by way ofextensions to a number of awarded leases.Deployment potential3.46 Figure 14 sets out results of recent analysis of <strong>the</strong> potential for growth inoffshore wind generation to <strong>2020</strong>. It suggests that industry has <strong>the</strong> potential tobring forward between 10 and 26 GW by <strong>2020</strong> (‘industry low’ and ‘industry high’scenarios), with a central range of up to 18 GW. Achieving <strong>the</strong> top of centralrange would require an annual growth rate of up to 30%.3.47 The <strong>UK</strong> has <strong>the</strong> best offshore wind resources in Europe. Recent independentanalysis for DECC suggests that <strong>the</strong> <strong>UK</strong> can maintain its place as global leaderin offshore wind with <strong>the</strong> potential to deploy over 40 GW by 2030. Such43
<strong>UK</strong> <strong>Renewable</strong> <strong>Energy</strong> <strong>Roadmap</strong>significant capacity, enough to power <strong>the</strong> equivalent of all <strong>the</strong> homes in <strong>the</strong> <strong>UK</strong>,can play a vital role in increasing our energy security and decarbonising powergeneration.3.48 The Committee on Climate Change recommended in <strong>the</strong>ir recent advice that,unless <strong>the</strong>re is clear evidence of cost reduction, <strong>the</strong> <strong>UK</strong> ambition for offshorewind should be limited to 13 GW by <strong>2020</strong>. If industry, with Government support,can drive down costs, we will be able to go faster and fur<strong>the</strong>r, ensuring that <strong>the</strong>full economic and energy security benefits of our offshore wind resource comesto <strong>the</strong> <strong>UK</strong> ra<strong>the</strong>r than our competitors. We are determined to achieve <strong>the</strong>segains, which is why we are:• Providing a fur<strong>the</strong>r £30m of direct Government innovation support foroffshore wind cost reduction. This is in addition to £28m for offshore windapplications under <strong>the</strong> Environmental Transformation Fund (ETF), <strong>the</strong> £30malready committed to NaREC, <strong>the</strong> recently announced £25m by <strong>the</strong> ETI, and£60m provided for <strong>the</strong> development of manufacturing facilities at port sites;• Establishing a Task Force with industry to set out an action plan for costreduction to <strong>2020</strong>. The Task Force will drive <strong>the</strong> work necessary to realise<strong>the</strong> vision of reaching £100/MWh for offshore wind, making it costcompetitive with a large proportion of <strong>the</strong> 30-40 GW of low carbongeneration which will be necessary in <strong>the</strong> <strong>2020</strong>s to deliver <strong>the</strong> 4 th CarbonBudget. The group will be chaired by a senior industry figure and will involveindustry, Government and <strong>the</strong> Crown Estate. The Crown Estate will play akey role in facilitating this work through <strong>the</strong> analysis it has initiated on costreduction pathways.3.49 Industry indicate that cost reductions of this challenging level can be achievedover <strong>the</strong> next decade through a combination of technology progression,industrialisation and greater supply chain competition, combined withfavourable exchange rate and o<strong>the</strong>r external conditions.3.50 The Task Force will consider evidence from The Crown Estate, industry ando<strong>the</strong>rs on present and future costs, <strong>the</strong> key determinants of cost at each stageof <strong>the</strong> value chain, and which of <strong>the</strong>se should be targeted for action. Itsrecommendations, which will be jointly developed by industry and Governmentand reported to Minsters, will be used to inform future iterations of <strong>the</strong><strong>Roadmap</strong>, including <strong>the</strong> deployment potential for offshore wind.3.51 Significant cost reductions of this kind would see much greater levels of growthtowards <strong>the</strong> end of <strong>the</strong> decade. For example, if costs were to fall to £100/MWh,<strong>the</strong>n <strong>the</strong> cumulative offshore wind deployment in <strong>2020</strong> could increasedeployment a fur<strong>the</strong>r 5 GW by <strong>2020</strong> above <strong>the</strong> level set out by <strong>the</strong> CCC. Itwould enable industry to unlock <strong>the</strong> full potential of <strong>the</strong> <strong>UK</strong>’s offshore resourcesand provide contingency should <strong>the</strong> levels of large scale renewable energyanticipated from o<strong>the</strong>r technologies fail to be realised.44
<strong>UK</strong> <strong>Renewable</strong> <strong>Energy</strong> <strong>Roadmap</strong>Figure 14: Deployment potential to <strong>2020</strong> for offshore wind18 GW11 GW3.52 Being able to deploy at scale and at reduced cost would also position <strong>the</strong> <strong>UK</strong>strongly to exploit commercial opportunities for greater generation in <strong>the</strong> NorthSea. We have abundant wind resource and should explore <strong>the</strong> possibility ofexporting energy generated in <strong>UK</strong> waters to mainland Europe. This couldmean, for example, that our European neighbours fund <strong>the</strong> deployment ofadditional capacity in <strong>UK</strong> waters for <strong>the</strong>ir own consumption leading to evengreater business benefits for <strong>the</strong> <strong>UK</strong>. We will take powers as early aspracticable to enable <strong>the</strong> “two-way” trade in renewable energy with o<strong>the</strong>rMember States where this can secure <strong>the</strong> greatest benefit for <strong>the</strong> <strong>UK</strong>.Deployment pipeline3.53 Figure 15 provides a breakdown of <strong>the</strong> current offshore wind planning pipelineand <strong>the</strong> effect of current drop-out rates on final development. Offshore wind hashistorically benefitted from a very low dropout rate with only 7% of projectsbeing lost from <strong>the</strong> pipeline 52 . Taking historic dropout rates into account, <strong>the</strong>reare almost 6 GW of Round 1 and 2 offshore wind projects currently inconstruction, awaiting construction, or in planning. When <strong>the</strong> deploymentpipeline is taken toge<strong>the</strong>r with <strong>the</strong> capacity currently in operation this represents7 GW52 Planning and post-consent success rate based on capacity from 2007-present.45
<strong>UK</strong> <strong>Renewable</strong> <strong>Energy</strong> <strong>Roadmap</strong>Figure 15: Capacity of offshore wind projects in <strong>the</strong> planning pipeline 533.54 To deliver fur<strong>the</strong>r deployment, projects will also need to come forward fromRound 3 zones and extensions awarded, STW sites, and <strong>the</strong> forthcomingNor<strong>the</strong>rn Ireland leasing round. Individual projects within <strong>the</strong> Round 3 zonesare at <strong>the</strong> pre-application stage, and are likely to enter <strong>the</strong> planning andconsenting process from late 2012 onwards.Journey to deployment3.55 Figure 16 below is a developer journey map for offshore wind projects. Itoutlines <strong>the</strong> delivery system for offshore wind developments in <strong>UK</strong> waters. Upto now <strong>the</strong> average time for progressing to operation is 4-6 years. The chartbelow shows <strong>the</strong> development process and likely timings for a typical offshorewind project and highlights <strong>the</strong> greatest risks to deployment in red. To increase<strong>the</strong> build rates, shorten development time, and reduce costs, we must tackle<strong>the</strong> barriers set out below.53 Based on historic consenting rates, <strong>the</strong> capacity shown in green could potentially be lost from <strong>the</strong> pipeline46
<strong>UK</strong> <strong>Renewable</strong> <strong>Energy</strong> <strong>Roadmap</strong>Figure 16: Developer journey map for <strong>the</strong> deployment of offshore windprojectsChallenges to deployment and actions3.56 We recognise <strong>the</strong> importance of offshore wind to <strong>the</strong> achievement of ourrenewables target, and <strong>the</strong> long term potential to contribute to <strong>the</strong>decarbonisation of <strong>the</strong> energy sector necessary under <strong>the</strong> 4 th Carbon Budget.3.57 In addition to <strong>the</strong> specific challenges and actions set out below, we also need toprioritise <strong>the</strong> driving down of costs of offshore wind energy to <strong>the</strong> make <strong>the</strong>technology sustainable in <strong>the</strong> longer term. Government is already supportingwork to increase <strong>the</strong> rate of innovation to bring down costs, including bysupporting test facilities and deciding to establish an offshore renewables TIC.The ETI has recently announced that it will invest £25m into an open accesswind turbine drive train test rig to be sited at NaREC in Blyth. DECC isannouncing today that it will provide up to £30m over <strong>the</strong> next 4 years to fostercollaboration between technology developers and to support innovations in <strong>the</strong>production of components.3.58 We will prioritise work with <strong>the</strong> industry and The Crown Estate to identify whereefforts can be focused to reduce <strong>the</strong> costs of offshore energy throughout <strong>the</strong>value chain from development, construction and operations. As set out above,we will establish a Task Force with industry to set out an action plan for costreduction to <strong>2020</strong>. We will also work though <strong>the</strong> Offshore Wind Developers47
<strong>UK</strong> <strong>Renewable</strong> <strong>Energy</strong> <strong>Roadmap</strong>Forum (OWDF) and its supply chain sub-group to support <strong>the</strong> development of<strong>the</strong> <strong>UK</strong> supply chain.Innovate to reduce costs3.59 Offshore wind is at an earlier stage of development than onshore, with designsthat are still evolving and costs which are significantly higher – driven in part by<strong>the</strong> need for greater reliability, given <strong>the</strong> harsher operating environment and <strong>the</strong>difficulty in gaining access for maintenance and repair.3.60 To deploy at <strong>the</strong> scale suggested by our analysis it will be crucial to reducecosts – for manufacturing, installing, operating and maintaining offshorewindfarms. Innovation, to improve efficiency and decrease installation costs willhave a significant role to play in reducing <strong>the</strong> cost of energy, which will in turnsupport increased deployment and help boost <strong>the</strong> <strong>UK</strong> supply chain. SomeRound 3 zones will also require innovation to develop larger turbines,foundations in deep water sites, and drive train technologies.3.61 To help address that challenge <strong>the</strong> members of <strong>the</strong> Government’s Low CarbonInnovation Group 54 are working toge<strong>the</strong>r and with <strong>the</strong> DevolvedAdministrations and o<strong>the</strong>rs to provide a coordinated and broad portfolio ofsupport to innovation in offshore wind. Key parts of that portfolio include:oooo<strong>UK</strong> Government support to <strong>the</strong> development of shared industry testingand proving facilities – such as <strong>the</strong> new 100-metre blade testing facilityand offshore wind turbine testing sites at NaREC in Blyth;The ETI recent announcement that it will invest £25m into an open accesswind turbine drive train test rig based at NaREC.The Technology Strategy Board’s funding to establish an offshorerenewables TIC;The ongoing offshore wind innovation programmes of <strong>the</strong> ETI, whichfocuses on reliability, cost reduction, and supply-chain development oftechnologies optimised for <strong>the</strong> offshore wind sector;o The work of <strong>the</strong> Carbon Trust, which has committed in <strong>the</strong> region of £4mthis financial year to continue <strong>the</strong> Offshore Wind Accelerator;oThe Research Council’s Offshore Wind Supergen programme with <strong>the</strong>principal objective of <strong>the</strong> current phase being to undertake research toachieve an integrated, cost-effective, reliable and available Offshore WindPower Station.3.62 Testing facilities have been recognised as having a key role to play in <strong>the</strong>offshore wind sector. Demonstration of what in many cases will be cutting edgenew technology in a controlled environment is required before massdeployment can take place, and will support cost reduction and provide54 The Low Carbon Innovation Group core membership includes: <strong>the</strong> Department of <strong>Energy</strong> and ClimateChange (DECC), <strong>the</strong> Department of Business Innovation and Skills (BIS), <strong>the</strong> Carbon Trust, <strong>the</strong> ResearchCouncils, <strong>the</strong> <strong>Energy</strong> Technologies Institute (ETI) and <strong>the</strong> Technology Strategy Board.48
<strong>UK</strong> <strong>Renewable</strong> <strong>Energy</strong> <strong>Roadmap</strong>investment confidence. We will support <strong>the</strong> development of <strong>the</strong> shared industrytesting and proving facilities where possible to help lower technology costs andimprove reliability.3.63 The recently announced wind turbine test rig funded by ETI will be capable oftesting complete drive trains and nacelles for prototype turbines up to 15 MW,in a purpose built, onshore test facility. Accelerated lifetime testing of turbineswill help reduce <strong>the</strong> technical and commercial risks of mass production anddeployment before moving to challenging offshore conditions. It will provideboth a lower cost alternative to deploying and testing turbines offshore, and willaccelerate <strong>the</strong> development of new prototypes for low cost, more reliablemachines, increasing <strong>the</strong> speed of deployment. It should be available forcommercial testing from June 2013.3.64 To complement those investments, DECC will set-aside up to £30m over <strong>the</strong>next 4 years for offshore wind innovation which, subject to satisfactory value formoney assessments, will be used to fund schemes to drive cost reductions incomponents and technologies for offshore wind systems and to fostercollaboration between offshore wind developers to address commonchallenges.Actions:• Delivery of a coordinated portfolio of support to offshore wind including: <strong>the</strong>establishment of an offshore renewables TIC; <strong>the</strong> continued development ofoffshore wind energy testing facilities; and, subject to value for moneyassessment, DECC will be providing up to £30m over <strong>the</strong> next four years whichwill support innovation to reduce costs.Case study: Belfast Harbour Development as Offshore <strong>Renewable</strong>s HubBelfast Harbour, a deep water port withno tidal restrictions offering year-roundaccess, gives offshore energy investors<strong>the</strong> ability to build <strong>the</strong> robust supplychain solutions <strong>the</strong>y need. Already hostto Harland and Wolff Heavy Industries’logistical supply base, in February2011,Belfast Harbour announced plans withDONG <strong>Energy</strong>, which are now beingfinalised, to develop a new £50m, 50acre offshore logistics hub as a basefor its Irish Sea construction operations.This marks a significant investment and creates a large number of jobs in Belfast, during<strong>the</strong> construction phase and its subsequent use as a pre-assembly facility. A fur<strong>the</strong>r 100acres of available development land nearby is part of plans to develop a Marine <strong>Energy</strong>49
<strong>UK</strong> <strong>Renewable</strong> <strong>Energy</strong> <strong>Roadmap</strong>Park at Belfast Harbour, focusing on both offshore wind and marine energy technologies.DONG <strong>Energy</strong>, alongside Scottish Power <strong>Renewable</strong>s, have also recently reachedfinancial closure on <strong>the</strong> construction of <strong>the</strong> 389MW West of Duddon Sands offshorewindfarm in <strong>the</strong> Irish Sea and it is expected that <strong>the</strong> installation and pre-assemblyoperations shall largely be run out of Belfast Harbour. Work will commence in early 2012,initially with construction of <strong>the</strong> required onshore connections. The partners have alsocommissioned two purpose built installation vessels to be used in <strong>the</strong> construction of <strong>the</strong>project, allowing work to be undertaken in all seasonal conditions. Offshore constructionfor West of Duddon Sands is expected to commence in early summer 2013 with <strong>the</strong>project expected to be fully completed by <strong>the</strong> end of 2014.Develop <strong>the</strong> supply chain3.65 The equipment and construction supply chains for offshore windfarms are stillat <strong>the</strong> development stage. Although <strong>the</strong>re are a number of players who aremaking good progress, <strong>the</strong>re is still a lack of capacity and competition overall,particularly in <strong>the</strong> production of key components such as large bearings,electrical equipment, export (including HVDC) cables, and <strong>the</strong> vessels requiredto install <strong>the</strong>m. Investment is also needed in manufacturing sites and portinfrastructure to facilitate deployment, stimulate <strong>the</strong> associated supply chain,and lowers costs.3.66 The <strong>UK</strong> will need to overcome supply chain barriers to lower costs and deployat scale for both <strong>2020</strong> and beyond.3.67 DECC’s approach is to focus on a small number of key supply constraintswhere Government can have a particular material impact. These include <strong>the</strong>development of manufacturing facilities at port sites, for which DECC will makeup to £60m of support available by 2015. This money will help leverage largeprivate investment to develop <strong>the</strong> facilities necessary to produce heavy turbinecomponents.3.68 The Scottish Government has also introduced a £70 million National<strong>Renewable</strong>s Infrastructure Fund, designed to streng<strong>the</strong>n port andmanufacturing facilities and supply chain provision for manufacturing offshorewind turbines and related components. The Fund will leverage significantprivate sector investment over <strong>the</strong> next four years and help deliver an estimated28,000 jobs and £7.1 billion in value to Scotland's economy over <strong>the</strong> comingdecade.3.69 DECC is working with <strong>the</strong> OWDF to support <strong>the</strong> development of <strong>the</strong> <strong>UK</strong> supplychain by:-o setting a long-term vision for <strong>the</strong> industry,o providing confidence and visibility on future build schedules,o learning and implementing relevant lessons from o<strong>the</strong>r sectors, such as oiland gas, to support cost reduction and supply chain development50
<strong>UK</strong> <strong>Renewable</strong> <strong>Energy</strong> <strong>Roadmap</strong>Actions:• DECC will provide up to £60m over <strong>the</strong> next 4 years for <strong>the</strong> development ofnew offshore wind manufacturing facilities at port sites in assisted areas inEngland.• The Scottish Government will provide £70m through <strong>the</strong> National <strong>Renewable</strong>sInfrastructure Fund to streng<strong>the</strong>n port and manufacturing facilities for offshoreturbines and related components.• DECC is working with <strong>the</strong> OWDF and o<strong>the</strong>r key stakeholders to supportdevelopment of <strong>the</strong> supply chain.Case study: MTL Group 55MTL Group is a <strong>UK</strong> contract manufacturing specialistin <strong>the</strong> metal sector. Founded in 1995 <strong>the</strong>y havegrown to become a partner of choice for many majorglobal original equipment manufacturers (OEMs).They have recently been awarded a multimillionpound contract to supply 97 Boat Landing Systemsto a leading European foundations manufacturer fora German offshore windfarm in <strong>the</strong> North Sea.MTL Group has worked closely with DECC, receiving £250,000 of grant funding to‘Develop increased supply of jacket and monopole sub-assemblies’ to increaseassemblies for <strong>the</strong> offshore wind sector. With this DECC support MTL Group hasinvested in state of <strong>the</strong> art machinery that meets <strong>the</strong> requirements of this growing sector.The contract which is its largest exportcontract to date, will use all of MTL Group’sprocessing equipment which includes largeformat high definition plasma & laser cutting,robotic tube cutting, automated robotwelding and large CNC machining.25 MTL employees will be working on <strong>the</strong>project at <strong>the</strong> groups advancedmanufacturing facility in Ro<strong>the</strong>rham. Work isdue to commence in July 2011 with <strong>the</strong> finaldelivery of boat landings by March 2012.Minimise investment risk3.70 Developers report perceived uncertainty about <strong>the</strong> level and surety ofGovernment financial support for offshore wind, factors which reduce <strong>the</strong>irability and willingness to secure finance.55 Photograph credits: ‘Found Ocean’51
<strong>UK</strong> <strong>Renewable</strong> <strong>Energy</strong> <strong>Roadmap</strong>3.71 This is a key issue for offshore wind given <strong>the</strong> scale and cost of projectsinvolved and could affect any project which has not yet achieved financialclose, in particular <strong>the</strong> 3 GW of capacity currently in <strong>the</strong> pipeline awaitingplanning approval or construction (mainly Round 2 projects). Scoping work onRound 3 and STW projects could also be affected as well as forthcomingprojects in <strong>the</strong> Nor<strong>the</strong>rn Ireland leasing round, although we do not anticipatethat <strong>the</strong>se projects will need to achieve financial close imminently.3.72 Electricity Market Reform will put in place a transparent and long-term financialframework for low carbon electricity, including offshore wind. Government willensure a smooth transition from <strong>the</strong> RO. As part of this, once <strong>the</strong> new schemeis introduced, new generators will have <strong>the</strong> choice between <strong>the</strong> two schemesuntil 2017 and following closure of <strong>the</strong> RO to new entrants, technologypayments made under <strong>the</strong> RO will be grandfa<strong>the</strong>red 56 . In addition, <strong>the</strong>Government has accelerated <strong>the</strong> current Banding Review to provide claritysooner on future support levels under <strong>the</strong> RO – Government will consult insummer 2011 and publish its decision <strong>the</strong> end of <strong>the</strong> year, one year earlierthan originally planned.Actions:• DECC will consult on new banding levels in summer 2011 and publish itsdecisions by <strong>the</strong> end of <strong>the</strong> year. New banding levels for offshore wind willcome into force in April 2014• DECC will put in place arrangements to ensure a smooth transition from <strong>the</strong><strong>Renewable</strong>s Obligation to <strong>the</strong> new electricity market support mechanism.Access finance3.73 Deploying offshore wind capacity for <strong>2020</strong> will require investment in <strong>the</strong> order oftens of billions of pounds. Individual Round 3 projects are likely to cost morethan £1bn and some zones more than £10bn. At present, only <strong>the</strong> utilities andstate-backed independent companies are leading <strong>the</strong> construction phase ofoffshore windfarms.3.74 There are a limited number of banks willing to consider funding <strong>the</strong> constructionphase of offshore wind, partly due to <strong>the</strong> size of <strong>the</strong> lending required and <strong>the</strong>difficulty in mitigating construction risk. In addition, banks are constrained in<strong>the</strong>ir ability to lend to offshore wind projects as <strong>the</strong>re is a limited possibility ofde-risking <strong>the</strong>ir positions over time, whe<strong>the</strong>r through <strong>the</strong> debt syndicationmarket or by refinancing in <strong>the</strong> debt capital market. This constraint will becomemore important over time, as new banking reforms (Basel III) are likely to makelong-term lending less attractive.3.75 Moreover, any projects developed by utilities using project finance will typicallybe viewed by rating agencies as on-balance sheet debt for <strong>the</strong> utility. As aresult, utilities prefer to fund projects on <strong>the</strong>ir own balance sheet, <strong>the</strong>rebyavoiding <strong>the</strong> higher cost, limited availability, and more stringent conditions56 Grandfa<strong>the</strong>ring is a policy that support levels should not change once generation has been accredited undera scheme, <strong>the</strong>reby providing investors greater certainty.52
<strong>UK</strong> <strong>Renewable</strong> <strong>Energy</strong> <strong>Roadmap</strong>attached to non-recourse project debt funding. But it is unlikely <strong>the</strong>y will be ableto deliver all of <strong>the</strong> investment required in this way, given <strong>the</strong>ir desire to protectcredit ratings and make o<strong>the</strong>r investments in <strong>the</strong> <strong>UK</strong> or overseas.3.76 These barriers could affect any project which has not yet reached financialclose, including <strong>the</strong> 3 GW which is in <strong>the</strong> pipeline at present but not yet underconstruction.3.77 Uncertainty about additional risks can also affect <strong>the</strong> financing of projects, suchas <strong>the</strong> perception that <strong>the</strong> value of an offshore wind investment could bediminished because offshore windfarm leases from <strong>the</strong> Crown Estate can beamended or terminated in order to allow an oil or gas development to proceed.To reduce this perceived risk, DECC will formalise its existing policy that nooffshore windfarm lease will be terminated or amended without appropriatecompensation, and work with <strong>the</strong> offshore wind and oil & gas industries to setout guidance on how to resolve conflicts.3.78 BIS is setting up <strong>the</strong> Green Investment Bank (GIB). The GIB’s mission isproposed to be providing financial solutions to accelerate private sectorinvestment in <strong>the</strong> <strong>UK</strong>’s transition to a green economy. In looking to achieve thismission <strong>the</strong> GIB will offer a range of financial products to increase investment inlow carbon infrastructure.3.79 Although no decisions have been taken on <strong>the</strong> sectors and technologies that<strong>the</strong> GIB will focus on, <strong>the</strong> market failures facing offshore wind are indicative of<strong>the</strong> challenges which <strong>the</strong> GIB will seek to address. It is <strong>the</strong>refore likely thatoffshore wind will be a strong candidate for support from <strong>the</strong> GIB, which couldplay an important role in freeing up utility balance sheets as well as reducingproject finance costs by helping to place debt in <strong>the</strong> capital markets and deriskingproject finance.3.80 In May BIS announced an incubation phase for <strong>the</strong> GIB from April 2012, underwhich <strong>the</strong> Government will make direct investment in <strong>the</strong> green economy(taking account of advice from finance professionals) until State Aid approval isachieved. Following State Aid approval <strong>the</strong> GIB will be established as a standaloneinstitution and from April 2015 will be given powers to borrow 57 .3.81 DECC is working with developers and investors in <strong>the</strong> OWDF to identify <strong>the</strong>quantity and type of investment capital required for offshore wind and identifywhe<strong>the</strong>r fur<strong>the</strong>r Government action is needed and appropriate. To reduce riskDECC is clarifying its financial incentives for renewables, as discussed above.Actions:• Government will, from April 2012 and prior to obtaining state aid approval toestablish <strong>the</strong> GIB, pursue financial interventions that do not require specificapproval using <strong>the</strong> £775m of commitment from 2012/13 made available in <strong>the</strong>Budget. These are likely to be investments on market terms or under existingstate aid approvals.57 Subject to public sector net debt falling as a percentage of GDP53
<strong>UK</strong> <strong>Renewable</strong> <strong>Energy</strong> <strong>Roadmap</strong>• Government will aim to achieve state aid clearance as soon as practical in orderto pass legislation to enshrine <strong>the</strong> GIBs independence in statute.• Government will take action to ensure that no offshore windfarm lease will beterminated or amended without appropriate compensation to allow oil and gasdevelopment to proceed, and will work with industry to set out more detailedguidance before <strong>the</strong> end of 2011.Ensure cost-effective grid investment and connection3.82 To deliver <strong>the</strong> increase in offshore wind generation expected by <strong>2020</strong>, <strong>the</strong> <strong>UK</strong>will need significant and timely investment in <strong>the</strong> grid, both to bring electricityashore and to streng<strong>the</strong>n <strong>the</strong> onshore transmission network. The Crown Estateestimate, for example, that around £10bn of investment will be required toconnect all Round 3 projects to shore. 58 Investment will need to be wellcoordinated to ensure it is deliverable and cost-effective.Box 5: Offshore Transmission Operation (OFTO)The competitive approach to granting offshore transmission licences is expected to havea number of advantages including encouraging innovation and new entrants. Connectionsfor nine offshore projects (with 2 GW of capacity and connections worth £1.1bn) weretendered by Ofgem in <strong>the</strong> first OFTO tender round. Ofgem has forecast savings of £350mfrom <strong>the</strong>se nine grid connection projects compared to onshore grid costs 59 .The first tender round has shown strong evidence of investment appetite and newsources of finance, attracting almost £4bn of investment for £1.1bn of assets. Preferredbidders have been announced for <strong>the</strong> transmission assets of eight of <strong>the</strong> nine offshorewindfarms in this round:• Transmission Capital Partners (a consortium of Transmission Capital, AmberInfrastructure and International Public Partnerships) is <strong>the</strong> preferred bidder for Barrow,Gunfleet Sands, and Ormonde.• Balfour Beatty Capital Ltd is <strong>the</strong> preferred bidder for Thanet.• A consortium of Balfour Beatty Capital Ltd, Equitix Ltd and AMP Capital Investors Ltdis <strong>the</strong> preferred bidder for Greater Gabbard.• Macquarie Capital Group as part of a consortium including Barclays Private Equity andNIBC Infrastructure Partners is preferred bidder for Sheringham Shoal, Walney I andWalney II.The first OFTO licence was granted in April 2011, to Transmission Capital Partners, for<strong>the</strong> Robin Rigg offshore windfarm.The second tender round has been launched for projects with a capacity of 2.8 GW andan estimated connection asset value of £1.9 billion. Ofgem recently announced ashortlist of four bidders competing to own and operate transmission links (with 1.4 GW ofcapacity) for three offshore windfarms. Preferred bidders will be announced in Autumn2011.58 ‘Round 3 Offshore Wind Farm Connection Study’59 http://www.ofgem.gov.uk/media/pressrel/Documents1/AugustOffshorePressNotice.pdf54
<strong>UK</strong> <strong>Renewable</strong> <strong>Energy</strong> <strong>Roadmap</strong>3.83 To facilitate investment, DECC commenced <strong>the</strong> new offshore transmissionregulatory regime in July 2010 for certain offshore transmission projects from<strong>the</strong> point of transfer of constructed transmission assets from <strong>the</strong> generator to<strong>the</strong> Offshore Transmission Owner (OFTO), appointed by virtue of a tenderexercise run by Ofgem. In response to feedback from developers, codes andlicences were amended in December 2010 to extend <strong>the</strong> generator-build optionfor <strong>the</strong> future alongside <strong>the</strong> OFTO build option.3.84 To improve investment planning, DECC and Ofgem set up <strong>the</strong> OffshoreTransmission Coordination Project in March 2011, leveraging industryinvolvement to examine whe<strong>the</strong>r any fur<strong>the</strong>r changes are needed to <strong>the</strong>offshore transmission regime to ensure coordinated development of Round 3offshore transmission assets. The project will report at <strong>the</strong> end of 2011,followed by a consultation in 2012 if fur<strong>the</strong>r measures are considerednecessary.3.85 To manage <strong>the</strong> costs of connection, National Grid have extended <strong>the</strong> interimfinancial security arrangement until April 2012, whereby developers are onlyrequired to provide security for local connections ra<strong>the</strong>r than widerreinforcement. To help inform National Grid’s analysis to identify suitable longterm arrangements, DECC is consulting with <strong>the</strong> OWDF and <strong>the</strong> marine energyindustry. National Grid intends to publish a consultation later this year with <strong>the</strong>aim of implementing any changes by April 2012.Box 6: The ISLES ProjectThe ISLES project is a collaboration between <strong>the</strong> Scottish Government, <strong>the</strong> Nor<strong>the</strong>rnIreland Executive and <strong>the</strong> Government of Ireland to drive forward <strong>the</strong> delivery of gridinfrastructure for <strong>2020</strong> and beyond and connecting up markets.The project, funded by <strong>the</strong> European Union’s INTERREG IVA Programme, is assessing<strong>the</strong> feasibility of creating an offshore interconnected transmission network and subseaelectricity grid to garner and transport electricity created from renewable energy sourcesin <strong>the</strong> nor<strong>the</strong>rn coastal waters linking Scotland, Nor<strong>the</strong>rn Ireland and Ireland and in <strong>the</strong>Irish Sea. The results of ISLES first major initiative will have been disseminated tostakeholders by <strong>the</strong> end of 2011.3.86 The Nor<strong>the</strong>rn Ireland Executive is working closely with stakeholders to ensurethat <strong>the</strong>re is significant and timely investment in <strong>the</strong> grid to facilitate offshoretechnologies. Nor<strong>the</strong>rn Ireland is currently developing an Onshore <strong>Renewable</strong>Strategic Action Plan which will also examine <strong>the</strong> impact of bringing electricityashore and its associated impact on Nor<strong>the</strong>rn Ireland’s onshore transmissionnetwork.Actions:• DECC and Ofgem will publish <strong>the</strong> conclusions of <strong>the</strong> Offshore TransmissionCoordination Project by <strong>the</strong> end of <strong>the</strong> year, followed by a consultation in 2012if fur<strong>the</strong>r measures are considered necessary.55
<strong>UK</strong> <strong>Renewable</strong> <strong>Energy</strong> <strong>Roadmap</strong>• Several of <strong>the</strong> actions described in onshore wind regarding <strong>the</strong> transmissionnetwork (see section beginning paragraph 3.39 above) are also relevant tooffshore wind.Planning and consenting3.87 New National Policy Statements clarify <strong>the</strong> national need for new energyinfrastructure, including for offshore wind, and how <strong>the</strong> impacts of developmentshould be mitigated to safeguard sustainability.3.88 Offshore wind projects can face delay in securing consent, while potentialimpacts on <strong>the</strong> marine environment and o<strong>the</strong>r users of <strong>the</strong> sea are consideredand resolved. In some cases, <strong>the</strong>re may be specific site-related issues, leadingto loss of <strong>the</strong> project, whilst in o<strong>the</strong>rs it will take time to measure, resolve, andmitigate impacts. Early engagement between developers and <strong>the</strong> appropriatestatutory consultees as part of <strong>the</strong> reformed approach to marine licensing, aswell as in <strong>the</strong> implementation of <strong>the</strong> new marine planning system should avoidsome delays, which are costly for developers and delay <strong>the</strong>ir revenues fromgeneration.3.89 Failing to resolve <strong>the</strong>se tensions could, in <strong>the</strong>ory, impact <strong>the</strong> 1.9 GW of newcapacity currently in planning and <strong>the</strong> additional capacity we anticipate willcome forward through <strong>the</strong> decade. Round 3 projects, in particular, will be largerin size and more complex than Rounds 1 and 2, suggesting greater potentialcumulative impacts on marine ecology in particular as projects grow in numberand greater demands on <strong>the</strong> statutory advisors and regulators who assessapplications.3.90 To clarify <strong>the</strong> impact of environmental legislation on offshore wind, DECC isworking 60 to understand, and where appropriate manage, <strong>the</strong> implications ofMarine Conservation Zones (MCZs) and <strong>the</strong> Marine Strategy FrameworkDirective (MSFD). DEFRA will consult on proposed MCZ boundaries in summer2012. In accordance with <strong>the</strong> MSFD, <strong>the</strong> <strong>UK</strong>’s determination of GoodEnvironmental Status, and associated targets and indicators, has to besubmitted to <strong>the</strong> EU Commission by July 2012. The Welsh Government will beresponsible for designating Marine Conservation Zones in Wales.3.91 To build <strong>the</strong> evidence base and fill gaps which can hamper <strong>the</strong> planningprocess, DECC is undertaking research on <strong>the</strong> likely impacts of offshore windon <strong>the</strong> environment and o<strong>the</strong>r sea users through its rolling programme ofStrategic Environmental Assessments (SEAs). The post-consultation report for<strong>the</strong> Offshore SEA 2 will be published in summer 2011.3.92 To tackle <strong>the</strong> issues and resource constraints that consenting and regulatorybodies face in response to an increasing volume of applications, <strong>the</strong> MarineManagement Organisation (MMO) has established an Offshore <strong>Renewable</strong><strong>Energy</strong> Licensing Group. This will look at strategic issues such data gaps,60 With Defra, Devolved Administrations, JNCC, Natural England and o<strong>the</strong>r stakeholders, as well as <strong>the</strong> CrownEstate56
<strong>UK</strong> <strong>Renewable</strong> <strong>Energy</strong> <strong>Roadmap</strong>cumulative impact and <strong>the</strong> survey methods used. The group includes all bodiesinvolved in <strong>the</strong> licensing and consenting of marine renewable energy and metfor <strong>the</strong> first time in June 2011.Actions:• DECC is working to understand <strong>the</strong> implications of MCZs on offshore projects.DEFRA will consult on MCZ zones in summer 2012, with designations byDecember 2012. The Welsh Government will be consulting separately in 2012.• DECC will publish a post-consultation report in summer 2011 identifying gaps inits evidence base for Offshore <strong>Energy</strong> Strategic Environmental Assessments.• MMO has established an offshore regulators group, which met for <strong>the</strong> first timein June 2011 to tackle <strong>the</strong> challenges that regulatory bodies face and manageconsenting delays.• Nor<strong>the</strong>rn Ireland will publish its final Offshore <strong>Renewable</strong> <strong>Energy</strong> StrategicAction Plan by December 2011.57
<strong>UK</strong> <strong>Renewable</strong> <strong>Energy</strong> <strong>Roadmap</strong>Marine <strong>Energy</strong>• Wave and tidal stream technologies are still at an early stage of development witharound 4 MW of prototypes currently undergoing testing in <strong>the</strong> <strong>UK</strong>.• Commercial deployment of wave and tidal stream has yet to begin but <strong>the</strong> centralrange suggests up to 300 MW (approximately 0.9 TWh) could be deployed in <strong>the</strong><strong>UK</strong> by <strong>2020</strong>. Much larger scale deployment is anticipated in <strong>the</strong> period beyond<strong>2020</strong>.• While tidal range technologies are largely proven, <strong>the</strong>y need to be deployed throughcommercial-scale construction projects to be successful. Developers are currentlyevaluating a number of specific projects but <strong>the</strong>se are unlikely to be operational andmaking a significant contribution before <strong>2020</strong> given <strong>the</strong> high costs and lead times forconstruction.• Challenges to deployment include: managing <strong>the</strong> risks and costs of RD&D; securing<strong>the</strong> investment required for commercial deployment; developing supply chaininfrastructure, securing consents.Priority actions:• Manage <strong>the</strong> risks and costs of RD&D: Deliver a co-ordinated, targeted programmeof marine innovation support over <strong>the</strong> next four years, including up to £20m ofsupport from DECC for pre-commercial array demonstration. Establishment of anoffshore renewables Technology and Innovation Centre, and new programmes tosupport R&D that will reduce <strong>the</strong> cost of marine energy. Scottish Government willannounce details of <strong>the</strong>ir joint funding programme by <strong>the</strong> end of 2011.• Secure <strong>the</strong> investment for commercial deployment: Work through <strong>the</strong> <strong>UK</strong> Marine<strong>Energy</strong> Programme to assist <strong>the</strong> sector in obtaining investment funding. Work with<strong>the</strong> Crown Estate to create a knowledge sharing network to support development.• Development supply chain infrastructure: Work with <strong>the</strong> sector to develop Marine<strong>Energy</strong> Parks through <strong>the</strong> publication of guidance by March 2012.• Planning and consenting: Finalise outcome of <strong>the</strong> Strategic EnvironmentalAssessment (SEA) consultation and input to policy on use of <strong>the</strong> sea. Work withmarine regulators to better understand and overcomes key barriers to planning andconsenting process for marine renewables.Current deployment3.93 Wave and tidal stream technologies are still at a relatively early stage ofdevelopment. There is currently one operational 1.2MW tidal stream turbine inStrangford Narrows in Nor<strong>the</strong>rn Ireland. In addition, a number of tidal streamand wave energy devices, ranging up to 1MW, have been deployed at <strong>the</strong>European Marine <strong>Energy</strong> Centre (EMEC) in Orkney for testing. There are notidal range schemes in <strong>the</strong> <strong>UK</strong> at present.58
<strong>UK</strong> <strong>Renewable</strong> <strong>Energy</strong> <strong>Roadmap</strong>Case study: <strong>UK</strong> Marine <strong>Energy</strong> Testing InfrastructureThe <strong>UK</strong> has long been viewed as afocus for activity for <strong>the</strong> developmentof wave and tidal energytechnologies, with <strong>the</strong> majority ofleading developers based here andplanning to deploy commercially in <strong>UK</strong>waters. This has been underpinned by<strong>the</strong> <strong>UK</strong> Government’s investment tocreate a unique testing and innovationinfrastructure.Pelamis P2 testing at EMECThe European Marine <strong>Energy</strong> Centre (EMEC) in <strong>the</strong> Orkneys was created through amixture public sector funding in 2003 when <strong>the</strong> wave testing site was opened, followed bya tidal testing site in 2007. The Centre provides grid connected berths for testing bothlarge scale wave and tidal energy devices. All bar one of <strong>the</strong> full scale prototypes fundedunder DECC’s Marine <strong>Renewable</strong> Proving Fund will be deployed at EMEC. DECC hasrecently funded an £8m expansion of <strong>the</strong> EMEC test site with <strong>the</strong> installation of threeadditional grid connected cables (2 tidal,1 wave) and <strong>the</strong> creation of a “nursery” testingsite which will allow developers to test part-scale wave and tidal devices in more benignmarine conditions or to practice deployment and maintenance operations prior tooperating at <strong>the</strong> main testing sites. The “nursery” site has also already been attractinginterest from o<strong>the</strong>r sectors which would benefit from testing components and structures in<strong>the</strong> marine environment (providing a potential revenue source between marine energytests).The Wave Hub wave array testing facility was deployed off <strong>the</strong> coast of Cornwall in 2010and will provide facilities to demonstrate small arrays of wave energy devices, up to a totalof 20MW. The first devices, produced by Ocean Power Technologies are due to bedeployed at Wave Hub next year.Aquamarine Oyster testing at EMECAlongside <strong>the</strong> facilities at EMEC andWave Hub <strong>the</strong> Government has alsofunded an onshore tidal drive train testingfacility at <strong>the</strong> National <strong>Renewable</strong> <strong>Energy</strong>CentreS in <strong>the</strong> North East of England.This will be completed next year andallow <strong>the</strong> onshore testing of tidal devicesprior to deployment, reducing costs ofdevelopment and leading to enhancedreliability.Deployment potential3.94 Figure 17 presents <strong>the</strong> results of recent analysis of <strong>the</strong> potential growth of waveand tidal stream generation to <strong>2020</strong>. It overlays an industry view of <strong>the</strong>deployment that could be achieved (<strong>the</strong> ‘industry high’ and ‘industry low’scenarios) around a central range.59
<strong>UK</strong> <strong>Renewable</strong> <strong>Energy</strong> <strong>Roadmap</strong>Figure 17: Deployment potential to <strong>2020</strong> for marine energy3.95 In <strong>the</strong> central range pre-commercial wave and tidal stream arraydemonstrations will be carried out between 2013 and 2015, with commercialdeployment increasing through <strong>the</strong> second half of <strong>the</strong> decade. The WelshGovernment believe that by 2025 up to 4 GW of marine energy could beinstalled and operating around its coast. A range of studies have suggestedthat given continued development of <strong>the</strong> sector, wave and tidal energy couldexpand through <strong>the</strong> <strong>2020</strong>s to achieve some 27 GW 61 by 2050.3.96 The central range does not assume a contribution from tidal range by <strong>2020</strong>given <strong>the</strong> long lead times of <strong>the</strong>se projects. However, although <strong>the</strong> <strong>UK</strong> andWelsh Governments’ Severn Tidal Power Feasibility Study did not see astrategic case for public investment at <strong>the</strong> present time, developers arecurrently assessing a number of potential future projects in <strong>the</strong> Severn area andelsewhere (e.g. <strong>the</strong> Mersey and Solway Firth).3.97 Analysis 62 suggests considerable variation in <strong>the</strong> levelised cost of marinetechnologies, ranging from £162 to £340MWh in <strong>2020</strong> 63 . This reflects costdifferences between <strong>the</strong> individual technologies considered, uncertainty aboutanticipated levels of learning, global deployment, and technology risk. Capitalcosts are expected to fall as projects move from prototype stage to commercialdeployment, but <strong>the</strong> scale of <strong>the</strong> decrease is hard to predict and depends, forexample, on <strong>the</strong> intensity of <strong>the</strong> marine resource exploited.61 Source: 2050 DECC, PIRC Offshore Valuation 2010, Carbon Trust TINA & Green <strong>Energy</strong> Growth April 2011,Ernst & Young 201062 Analysis referenced by Arup and Ernst & Young, which is summarised in section 2.2 of <strong>the</strong> <strong>Roadmap</strong>.63 Data is not available for 2010 as some marine technologies have yet to be deployed commercially. Data for<strong>2020</strong> refers to wave, tidal stream and tidal range.60
<strong>UK</strong> <strong>Renewable</strong> <strong>Energy</strong> <strong>Roadmap</strong>Deployment pipeline3.98 At present <strong>the</strong>re is no firm planning pipeline for wave and tidal stream.Progress has been made in pre-commercial deployment in recent years, withseveral large scale prototypes now in testing and active plans from <strong>the</strong>industry to deploy small arrays in <strong>the</strong> next four years.3.99 In preparation for this wider deployment, several Strategic EnvironmentalAssessments (SEAs) have been recently produced or are under developmentacross <strong>the</strong> <strong>UK</strong>. The Offshore <strong>Energy</strong> SEA for English and Welsh watersshould be completed this summer and will complement <strong>the</strong> existing SEAs forScotland, Nor<strong>the</strong>rn Ireland, and <strong>the</strong> SEAs prepared for <strong>the</strong> Severn Estuary.This should open up <strong>the</strong> whole of <strong>the</strong> <strong>UK</strong> waters for <strong>the</strong> potential deploymentof marine energy devices.3.100 Following <strong>the</strong> SEA of Scottish waters, <strong>the</strong> Crown Estate awarded commercialleases in <strong>the</strong> Pentland Firth and Orkney Waters for 1.6 GW of marinegeneration, <strong>the</strong> first of its kind anywhere in <strong>the</strong> world. Fur<strong>the</strong>r leasing roundsfor o<strong>the</strong>r parts of Scotland have since been set in motion, a Marine <strong>Energy</strong>Infrastructure Study will be undertaken shortly within Welsh waters to identifywaters suitable for <strong>the</strong> deployment of prototype to commercial scale devices,and The Crown Estate recently launched a discussion process with <strong>the</strong>renewable energy industry on <strong>the</strong> design and development of offshore windand tidal energy in Nor<strong>the</strong>rn Ireland.Journey to deployment for wave and tidal stream3.101 The technology development map set out below in Figure 18 outlines <strong>the</strong> wayin which wave and tidal stream technologies progress from concept throughprototypes and commercial trials to full-scale deployment. The map shows <strong>the</strong>next critical stage in deployment is <strong>the</strong> pre-commercial demonstration of smallscale arrays of devices, which we anticipate will be over <strong>the</strong> next four years.This will require, in particular, fur<strong>the</strong>r support for innovation, securing <strong>the</strong>investment funding for commercial demonstration, development of <strong>the</strong> supplychain and securing <strong>the</strong> planning and consenting required for <strong>the</strong>sedemonstrations.61
<strong>UK</strong> <strong>Renewable</strong> <strong>Energy</strong> <strong>Roadmap</strong>Figure 18: Technology development through to commercialisation for <strong>the</strong>period to <strong>2020</strong>Challenges to deployment and actions3.102 Our analysis of deployment and discussions with industry suggest that <strong>the</strong>reare at least four main challenges to <strong>the</strong> deployment of marine technologies in<strong>the</strong> <strong>UK</strong>. DECC have established a <strong>UK</strong> Marine <strong>Energy</strong> Programme to address<strong>the</strong>se key challenges, bringing toge<strong>the</strong>r Government across <strong>the</strong> <strong>UK</strong> and <strong>the</strong>private sector to accelerate development of <strong>the</strong> marine renewables sector.Manage <strong>the</strong> risks and costs of RD&D3.103 Demonstration projects are a crucial step towards commercial deployment butare viewed as high risk due to <strong>the</strong>ir uncertain success rates and considerablecost 64 . In addition, where demonstration projects are successful, fur<strong>the</strong>rinnovation will often be required, so that <strong>the</strong> reliability, performance anddurability of devices can be improved, before companies can move tocommercial deployment.3.104 To underpin innovation, <strong>the</strong> Government has provided support to <strong>the</strong> <strong>UK</strong>’smarine testing facilities at <strong>the</strong> NaREC, <strong>the</strong> European Marine <strong>Energy</strong> Centre64 A survey carried out for <strong>Renewable</strong><strong>UK</strong> (Wave and Tidal <strong>Energy</strong> in <strong>the</strong> <strong>UK</strong>: State of <strong>the</strong> industry report,March 2011) suggested capital costs of £42m-£84m for <strong>the</strong> first 10MW wave and tidal energy projects.62
<strong>UK</strong> <strong>Renewable</strong> <strong>Energy</strong> <strong>Roadmap</strong>(EMEC), and <strong>the</strong> Wave Hub. In particular, DECC has recently funded an £8mexpansion of EMEC (which included <strong>the</strong> provision of three more wave andtidal testing berths and <strong>the</strong> creation of a ‘nursery’ testing site) and will workwith BIS to facilitate commissioning <strong>the</strong> ‘Nautilus’ drive testing facility atNaREC. The Welsh Government has also allocated over £20 million to marineresearch and development.3.105 To facilitate demonstration projects, DECC will set-aside up to £20m of itsinnovation budget over <strong>the</strong> next 4 years to support innovation in marineenergy technologies, subject to value for money assessments. This willsupport <strong>the</strong> demonstration of up to 2 tidal and wave arrays. In addition to this,<strong>the</strong>re may be an opportunity for funding from <strong>the</strong> EU New Entrants’ ReserveFund 300 (NER300). DECC recently submitted one wave and three tidalstream array projects to <strong>the</strong> European Commission for consideration.3.106 DECC funded schemes will be part of a coordinated programme of supportprovided by <strong>the</strong> members of <strong>the</strong> Government’s Low Carbon InnovationGroup 65 and <strong>the</strong> Devolved Administrations. Details of a number of schemesare being developed and will complement existing commitments whichinclude:o <strong>Energy</strong> Technologies Institute: has a marine programme which focuses onreliability and cost reduction through design and testing of prototypes underrelevant conditions.o Technology Strategy Board (TSB): ongoing marine projects supporting costreduction and improve performance through innovation. Announcement inMay 2011 to start <strong>the</strong> competition to form an Offshore <strong>Renewable</strong> <strong>Energy</strong>Technology Innovation Centre.o Research Councils: continue with <strong>the</strong> Marine Supergen programme with itsaim being to increase knowledge and understanding of device-seainteractions of energy converters from model-scale in <strong>the</strong> laboratory to fullsize in <strong>the</strong> open sea.o Capital and revenue funding via EU convergence fund monies,administered by <strong>the</strong> Welsh European Funding Office (WEFO). The WelshGovernment is engaged with WEFO and <strong>the</strong> EU Commission to consider astructural fund programme post 2013 and how it might support <strong>the</strong> sector.Actions:• DECC will provide up to £20m of its innovation budget over <strong>the</strong> next 4 years,subject to value-for –money assessment, to support demonstration of marineenergy technologies. The application process is expected to be launched inearly 2012 (subject to State Aid approval).• BIS will commission <strong>the</strong> ‘Nautilus’ marine energy testing facility at NaREC inearly 2012.• Scottish Government will announce details of <strong>the</strong>ir joint innovation fundingprogramme with <strong>the</strong> TSB by <strong>the</strong> end of 2011.65 The Low Carbon Innovation Group core membership includes: DECC, <strong>the</strong> Department of Business Innovationand skills (BIS), <strong>the</strong> Carbon Trust, <strong>the</strong> Research Councils, <strong>the</strong> <strong>Energy</strong> Technologies Institute (ETI) and <strong>the</strong>Technology Strategy Board.63
<strong>UK</strong> <strong>Renewable</strong> <strong>Energy</strong> <strong>Roadmap</strong>Secure <strong>the</strong> investment for commercial deployment3.107 Many of <strong>the</strong> companies developing marine energy technologies in <strong>the</strong> <strong>UK</strong> arerelatively small, start-up businesses with limited financial resources. As aresult industry evidence suggests <strong>the</strong>y often struggle to secure <strong>the</strong> significantlevels of up-front investment and working capital needed to move projectsfrom demonstration to large scale commercial deployment. Access to financehas been fur<strong>the</strong>r affected, <strong>the</strong> industry indicate, by perceived uncertaintyabout <strong>the</strong> long term level of Government revenue support available for marineenergy. This is currently provided through <strong>the</strong> <strong>Renewable</strong>s Obligation (RO)which varies from 2 ROCs/MWh in England, Wales and Nor<strong>the</strong>rn Ireland forwave and tidal energy to 3 ROCs/MWh in Scotland for tidal stream and 5ROCs/MWh for wave. Nor<strong>the</strong>rn Ireland has recently consulted on supportlevels for marine power.3.108 Although Original Equipment Manufacturers (OEMs) and utilities may chooseto invest once technologies and devices are proven at prototype scale, actionis needed to improve access to finance in <strong>the</strong> more immediate term. Someutilities have already made a substantial investment in <strong>the</strong> development ofwave and tidal projects, whilst OEM’s are gradually increasing <strong>the</strong>ir interestand some are starting to take a significant position in <strong>the</strong> wave and tidalsector.3.109 To provide clarity on financial incentives, <strong>the</strong> Government has a BandingReview in place to consider <strong>the</strong> levels of support provided under <strong>the</strong> RO for allrenewable electricity technologies, including marine. The Government will nowconsult in Summer 2011 and publish its decision by <strong>the</strong> end of <strong>the</strong> year, oneyear earlier than originally planned. DECC is working with <strong>the</strong> FinanceWorking Group of <strong>the</strong> <strong>UK</strong> Marine <strong>Energy</strong> Programme to feed evidence from<strong>the</strong> sector into this Banding Review.3.110 Given <strong>the</strong> timing of large scale marine energy deployment, <strong>the</strong> supportmechanisms in <strong>the</strong> Electricity Market Reform White Paper publishedalongside this <strong>Roadmap</strong> are likely to be more relevant to <strong>the</strong> technology than<strong>the</strong> RO scheme as this will provide <strong>the</strong> long-term signals <strong>the</strong> sector requires.3.111 To reduce deployment costs for marine energy projects and unlockinvestment, DECC and The Crown Estate are developing a sector-wideknowledge sharing network, including an open access database which will beready by <strong>the</strong> end of 2011. It will look to work alongside <strong>the</strong> development of <strong>the</strong>Marine <strong>Energy</strong> Parks and <strong>the</strong> Offshore <strong>Renewable</strong>s Technology InnovationCentre, and will help to increase <strong>the</strong> level of information exchange in order toaccelerate <strong>the</strong> level of marine energy deployment.Actions:• DECC is reviewing <strong>the</strong> levels of support available under <strong>the</strong> RO, including formarine energy, and will publish its decisions in Autumn 2011.• DECC and The Crown Estate are developing a sector wide knowledgenetwork, and detailed plans for this will be presented to <strong>the</strong> Marine <strong>Energy</strong>Programme Board by <strong>the</strong> end of 201164
<strong>UK</strong> <strong>Renewable</strong> <strong>Energy</strong> <strong>Roadmap</strong>Develop supply chain infrastructure3.112 Potential manufacturers need a degree of certainty about which of <strong>the</strong>currently unproven marine technologies will be deployable by <strong>2020</strong> before<strong>the</strong>y can commit to entering <strong>the</strong> market and ramping up supply. Inherentuncertainty about technology development has constrained <strong>the</strong> developmentof <strong>the</strong> supply chain to date.3.113 DECC is working with <strong>the</strong> sector to ensure that adequate supply capacity is inplace to support commercial deployment later in <strong>the</strong> decade. For example, weare helping to develop Marine <strong>Energy</strong> Parks, which aim to acceleratedeployment by encouraging a favourable business environment for marineenergy. By clustering key manufacturing and related activities and personnel,it will help to ensure that network benefits and economies of scale arerealised.3.114 Where possible <strong>the</strong> Government’s work will build on <strong>the</strong> considerableexpertise already available in <strong>the</strong> <strong>UK</strong> maritime, offshore wind and technologysectors, and on similar work which is underway to stimulate <strong>the</strong> supply chainfor offshore wind.Actions:• DECC will publish guidance by March 2012 for organisations developingsustainable Marine <strong>Energy</strong> Parks on a regional basis which will support <strong>the</strong>growth of <strong>the</strong> sector.Planning and consenting3.115 Developers have expressed concern that <strong>the</strong> measures to protect <strong>the</strong> marineenvironment could place a financial burden on <strong>the</strong>m and unduly limit <strong>the</strong> levelof offshore resource available for development. They indicate thatdeployment could be particularly affected by <strong>the</strong> designation of a network ofMarine Conservation Zones under <strong>the</strong> Marine and Coastal Access Act 2009and possible limits on underwater noise levels under <strong>the</strong> Marine StrategyFramework Directive.3.116 Government is working to ensure that policy balances effectively its twinpriorities to exploit <strong>the</strong> <strong>UK</strong>’s natural resource in offshore renewable energyand to protect <strong>the</strong> marine environment from unacceptable damage and foro<strong>the</strong>r users. Planning reform, including <strong>the</strong> introduction of <strong>the</strong> marine planningand consent regime, is intended to enable sustainable development andprovide greater certainty through a clear and simplified regulatory framework.3.117 To support <strong>the</strong> evidence base for policy making, <strong>the</strong> <strong>UK</strong> Offshore <strong>Energy</strong>SEA 2 for wave and tidal energy in English and Welsh waters was publishedfor consultation in February 2011. This sets out <strong>the</strong> likely impacts of offshoredeployment on sea users and <strong>the</strong> environment. DECC will publish itsresponse on wave and tidal elements of <strong>the</strong> document by <strong>the</strong> end of <strong>the</strong> year.65
<strong>UK</strong> <strong>Renewable</strong> <strong>Energy</strong> <strong>Roadmap</strong>3.118 The Welsh Government has published a Marine <strong>Renewable</strong> <strong>Energy</strong> StrategicFramework identifying <strong>the</strong> exploitable resource by device type and mappingdevelopment constraints. The Welsh Government has recently givendevelopment consent to a 1.2MW tidal device demonstration in RamsaySound. The “deploy and monitor” approach under which this device will bedeployed will increase understanding of <strong>the</strong> impacts of such devices on <strong>the</strong>marine environment. Welsh Government will shortly start work on its Marine<strong>Energy</strong> Infrastructure Study to identify specific sites for deployment, and <strong>the</strong>Nor<strong>the</strong>rn Ireland Executive will publish Regional Locational Guidance over <strong>the</strong>summer.3.119 As part of <strong>the</strong> <strong>UK</strong> Marine <strong>Energy</strong> Programme, DECC is working with <strong>the</strong>Marine Management Organisation and Marine Scotland to establish a workinggroup to consider <strong>the</strong> approach to planning and consenting for marinerenewable energy. In addition, to help inform work on <strong>the</strong> designation ofappropriate Marine Conservation Zones, DECC undertook research in 2011on <strong>the</strong> implications of <strong>the</strong> proposed Zones on offshore energy deployment.Actions:• DECC will publish its response to feedback on wave and tidal energyelements of <strong>the</strong> second SEA for Offshore <strong>Energy</strong> by <strong>the</strong> end of 2011.• Welsh Government will identify specific sites for marine energy deploymentthrough <strong>the</strong> development of a Marine <strong>Energy</strong> Infrastructure study.• Nor<strong>the</strong>rn Ireland Executive will publish Regional Local Guidance on <strong>the</strong>deployment of marine power in September 2011.• DECC will set up a working group under <strong>the</strong> Marine <strong>Energy</strong> Programme Boardin coordination with <strong>the</strong> MMO, Welsh Government, and Marine Scotland toconsider how to address barriers to planning and consenting process formarine renewables. The group will report to <strong>the</strong> Programme Board by <strong>the</strong> endof 201166
<strong>UK</strong> <strong>Renewable</strong> <strong>Energy</strong> <strong>Roadmap</strong>Biomass Electricity• Biomass electricity is a predictable and non-intermittent technology. In 2010 <strong>the</strong> <strong>UK</strong>had 2.5 GW 66 of capacity in operation (generating approximately 11.9 TWh) 67 .• The central range for deployment indicates that biomass electricity could contribute up68to 6 GW by <strong>2020</strong> . Achieving this level of capacity equates to an annual growth rate of9%. The breadth of <strong>the</strong> central range reflects uncertainty about <strong>the</strong> availability ofsustainable biomass for electricity given competing demands from heat, transport andnon-energy sectors.• Conversion of coal plant to biomass is a major new development. In addition to thisand co-firing, <strong>the</strong> existing pipeline contains an additional 4.2 GW, taking into account69historic planning approval rates . When taken toge<strong>the</strong>r with existing operationalcapacity this could deliver <strong>the</strong> central range for <strong>2020</strong> if projects are brought through<strong>the</strong> pipeline in a timely manner. There is also scope for new projects to enter <strong>the</strong>pipeline.• Challenges to deployment include: minimising investment risk and de-risking <strong>the</strong>supply of sustainable feedstocks, planning and consenting, and regulatory framework.Advanced conversion technologies may, in addition, struggle to secure finance if <strong>the</strong>yare viewed as commercially untested.Priority actions:• Minimise investment risk: Accelerate RO banding review and implement proposedElectricity Market Reform to improve revenue certainty for projects. Publish a <strong>UK</strong>Bioenergy Strategy later this year articulating a clear vision for <strong>the</strong> growth of sustainablebiomass energy in <strong>the</strong> <strong>UK</strong>.• De-risking <strong>the</strong> supply chain of sustainable feedstocks: Align incentives to feedstockavailability and from 2013 make payment of incentives dependent on meeting <strong>the</strong>se.Make available for public use by <strong>the</strong> end of <strong>the</strong> year a Greenhouse Gas LifecycleAssessment Tool for biomass heat and electricity generation.• Planning and consenting: Work with Defra, <strong>the</strong> Welsh Government, <strong>the</strong> EnvironmentAgency and stakeholders to ensure that environmental legislation does not have anunintended impact on <strong>the</strong> development of renewable energy plant, including energyfrom waste. Government will work with industry to develop cost effective fuel monitoringand sampling to accurately measure renewable content of waste. Planning reform inEngland and Wales is set out in <strong>the</strong> onshore wind section above.• Access long-term waste fuel contracts: Expand supply chains for waste wood andsolid recovered fuel and provide improved information on available waste. Consult onmeasures to divert waste from landfill including possible landfill restrictions for wastewood.• Access to finance: Government has provided support for Advanced ConversionTechnology demonstration projects and has created <strong>the</strong> Green Investment Bank whichcould play a role in supporting <strong>the</strong>se technologies. DECC will announce details ofpotential funding to support innovation, in areas such as <strong>the</strong> advanced conversion ofwaste, subject to value for money assessments and conclusion of innovation needswork.66 Includes 0.4 GW of co-firing capacity67 <strong>Energy</strong> Trends June 201168 Excluding capacity for co-firing.69 Planning and post-consent success rate based on capacity from 2007-present, weighted by nation in planningstage67
<strong>UK</strong> <strong>Renewable</strong> <strong>Energy</strong> <strong>Roadmap</strong>Current deployment3.120 At <strong>the</strong> end of 2010 <strong>the</strong>re was 2.5 GW of biomass electricity capacity operatingin <strong>the</strong> <strong>UK</strong>, accounting for 11.9 TWh of generation. This is <strong>the</strong> single largestcontribution to <strong>UK</strong>’s total renewable electricity generation.3.121 The majority of generation comes from waste (62% – predominantly landfillgas), although co-firing and dedicated biomass plant are also significant (21%and 17%). Anaerobic Digestion (AD) and o<strong>the</strong>r advanced conversiontechnologies are less well established, particularly at scale. Biomasselectricity is more prevalent in England and Wales than in o<strong>the</strong>r parts of <strong>the</strong>United Kingdom, although Nor<strong>the</strong>rn Ireland is also seeing a steady increase.Box 7 provides background information on <strong>the</strong> key fuels types and conversiontechnologies available for biomass electricity.Box 7: Biomass electricity – characteristics, fuel types and conversiontechnologiesThe term biomass refers to both virgin material, such as wood residues, agriculturalcrops and farming residues, and <strong>the</strong> biogenic fraction of waste material, such asmunicipal solid waste, o<strong>the</strong>r biodegradable waste including food and landfill andsewage gas.Biomass can be used in a wide range of conversion technologies, including (for drymaterial) dedicated combustion, co-firing with fossil fuels, and waste combustion, and(for wet material) anaerobic digestion to produce a flammable biogas. All of <strong>the</strong>setechnologies can be used to produce heat and electricity toge<strong>the</strong>r in a combined heatand power (CHP) plant, where heat is recovered from <strong>the</strong> electricity generation processand put to fur<strong>the</strong>r use. A number of advanced technologies are also underdevelopment, including gasification and pyrolysis.Dedicated plant are typically built from scratch (new build), although it is also possibleto convert existing fossil fuel power stations to run on 100% solid biomass (conversion)and a number of such projects are under consideration by developers. Co-firing isusually possible within existing plant subject to technical limits on <strong>the</strong> proportion ofbiomass used.Biomass electricity has <strong>the</strong> advantage that it is both predictable and controllable and socan be used for baseload or peakload generation. <strong>Energy</strong> from waste has <strong>the</strong> addedadvantages that it extracts value from biomass at <strong>the</strong> end of its useful life and reduces<strong>the</strong> amount of waste o<strong>the</strong>rwise sent to landfill and thus reduces methane emissions.Deployment potential3.122 Figure 19 sets out <strong>the</strong> results of analysis 70 of <strong>the</strong> potential for growth inbiomass electricity generation to <strong>2020</strong>. The breadth of <strong>the</strong> central rangereflects <strong>the</strong> dynamic potential of <strong>the</strong> large-scale biomass sector and <strong>the</strong> keyissue of whe<strong>the</strong>r <strong>the</strong> global supply of sustainable feedstocks can fuel it, giventhat supplies are finite and <strong>the</strong>re are competing uses in <strong>the</strong> bio-economy. The70 These figures include electricity generation from CHP technology.68
<strong>UK</strong> <strong>Renewable</strong> <strong>Energy</strong> <strong>Roadmap</strong>low and high scenarios reflect initial views from industry on <strong>the</strong> upsidepotential and downside risks.3.123 The analysis indicates that under <strong>the</strong> central range <strong>the</strong> market has <strong>the</strong>potential to deploy up to 6 GW 71 of biomass electricity by <strong>2020</strong> (equivalent toaround 50 TWh). Achieving this 3.5 GW increase will require an annualgrowth rate of 9% for <strong>the</strong> next decade. We anticipate that <strong>the</strong> majority of thisgrowth will be met from conversion of coal plant, dedicated biomassgeneration, biomass waste combustion and anaerobic digestion. Landfill andsewage gas – which are significant in <strong>the</strong> baseline – have already beenlargely exploited. The upper end of <strong>the</strong> central range has a peak in 2011-2013reflecting <strong>the</strong> short-term conversion of specific plants to biomass usage duringthis period.Figure 19: Deployment potential to <strong>2020</strong> for biomass electricity3.124 Biomass electricity has significant upside potential and could feasibly exceed<strong>the</strong> industry high, helping to meet <strong>the</strong> 15% target cost effectively. However,<strong>the</strong> projections can only be achieved if sufficient sustainable feedstocks areavailable. The industry high scenario assumes that build rates andsustainably-sourced feedstock supply are not limiting and that <strong>the</strong> capacitycurrently in <strong>the</strong> pipeline is not subject to delays. The industry low scenarioassumes that landfill and sewage gas will not increase whilst waste isdeployed at a low build rate. It also assumes that <strong>the</strong>re are constraints to <strong>the</strong>deployment of dedicated biomass plants, meaning that growth in new build isdelayed until 2016.3.125 Analysis for DECC 72 suggests wide ranges for levelised cost of biomasselectricity – £70-£173/MWh in <strong>2020</strong>, down only slightly from £75-£194/MW in71 Without taking into account <strong>the</strong> potential for increased co-firing.72 Analysis by Arup and Ernst & Young, summarised in section 2.2 of <strong>the</strong> <strong>Roadmap</strong>.69
<strong>UK</strong> <strong>Renewable</strong> <strong>Energy</strong> <strong>Roadmap</strong>2010. Ranges are wide due to <strong>the</strong> large number of individual technologiesconsidered 73 (co-firing is generally least expensive, followed by conversion,and <strong>the</strong>n dedicated biomass), uncertainty about AD, and <strong>the</strong> wide of range ofproject-specific factors affecting plant (fuel type, scale, <strong>the</strong> proportion ofbiomass used). Cost reductions are small due to minimal learning ratesassumed for <strong>the</strong> relatively mature combustion technologies, although AD isprojected to benefit from falling hurdle rates as <strong>the</strong> technology isdemonstrated to work. There is significant innovation and cost reductionpotential for bioenergy more widely, using technologies such as gasificationand pyrolysis, as well as agri-innovation to increase feedstock yields.Case study: Dalkia Biomass PlantDalkia’s £40million Biomass Plant atChilton near Durham is expected to begingeneration in July. The 18MW new planthas been designed to be fuelled on locallysourced waste wood and, when completed,<strong>the</strong> plant will generate renewable electricityand heat.The plant can generate sufficient electricityfor around 20,000 homes and <strong>the</strong>re is anopportunity to provide renewable heat viadistrict heat networks.The Chilton plant will process waste wood on site and use around 120,000 tonnes ofwood biomass thus removing this from <strong>the</strong> waste stream and reducing <strong>the</strong> landfill burden.Dalkia estimate that <strong>the</strong> plant will also provide around 50 new local jobs during <strong>the</strong>construction phase, a fur<strong>the</strong>r 17 jobs on <strong>the</strong> site and additional jobs in <strong>the</strong> supportinginfrastructure for <strong>the</strong> site.Deployment pipeline3.126 Figure 20 illustrates that <strong>the</strong> existing pipeline – excluding conversion andincreased co-firing 74 – contains 4.2 GW of capacity taking into account historicplanning approval rates 75 . Taken with what is currently operational, this coulddeliver <strong>the</strong> central range for <strong>2020</strong> if projects are brought through <strong>the</strong> pipelinein a timely manner.3.127 The majority of <strong>the</strong> existing pipeline is from large scale dedicated plant(3.3 GW), with <strong>Energy</strong> from Waste (EfW) projects accounting for a smaller73 This range includes dedicated biomass, biomass co-firing, biomass conversion and AD of less than 5 MW. Itdoes not include bioliquids, landfill and sewage gas or <strong>the</strong> combustion of municipal solid waste.74 REPD does not currently pick up conversion from coal plant.75 Planning and post-consent success rate based on capacity from 2007-present, weighted by country inplanning stage.70
<strong>UK</strong> <strong>Renewable</strong> <strong>Energy</strong> <strong>Roadmap</strong>proportion (0.9 GW). Of <strong>the</strong> applications awaiting consent, 78% are under50MW and will be decided at local level.Figure 20: Capacity of biomass electricity projects in <strong>the</strong> planning pipeline 763.128 Figure 20 does not account for <strong>the</strong> possibility that generators will convertexisting plant to biomass or make greater use of co-firing. These options offerconsiderable scope for additional generation, which we are quantifying in <strong>the</strong>RO Banding Review.Journey to deployment3.129 Figure 21 presents a ‘developer journey map’ for new-build dedicatedbiomass plant. The map outlines <strong>the</strong> key stages of <strong>the</strong> deployment processand <strong>the</strong> parties who contribute. Key challenges are highlighted in red. Fromscoping to operation, <strong>the</strong> process can take in <strong>the</strong> order of 5-8 years dependingon <strong>the</strong> complexity of any planning conditions and <strong>the</strong> need to secure anEngineering Procurement Contract (EPC) in order to obtain finance.76 Based on historic consenting rates, <strong>the</strong> capacity shown in green could potentially be lost from <strong>the</strong> pipeline71
<strong>UK</strong> <strong>Renewable</strong> <strong>Energy</strong> <strong>Roadmap</strong>Figure 21: Developer journey map for new-build, dedicated biomasselectricity projects3.130 To shorten this process, increase build rates, and bring forward capacity in <strong>the</strong>pipeline, we must tackle constraints at each stage. Some of <strong>the</strong>se challengesdiffer according to <strong>the</strong> type of fuel and conversion technology used, so wehave outlined actions separately for waste and dedicated biomass plant.Challenges to deployment and actionsGeneration from non-waste fuels3.131 Our analysis of deployment statistics and discussions with industry suggestthat developers must overcome at least two main challenges to deploydedicated and co-firing plant in <strong>the</strong> <strong>UK</strong>:Minimise investment risk3.132 Historically, investor confidence in large scale biomass electricity projects hasbeen limited by <strong>the</strong> lack of completed projects which can be held up topotential investors as evidence that similar projects have been successful.Consequently, <strong>the</strong> financial sector has been cautious, looking to offset riskthrough EPCs and long term feedstock contracts.3.133 Confidence has been fur<strong>the</strong>r weakened by perceived uncertainty aboutGovernment policy, including <strong>the</strong> level and surety of long term financialsupport. In particular, developers have found it difficult to obtain project72
<strong>UK</strong> <strong>Renewable</strong> <strong>Energy</strong> <strong>Roadmap</strong>finance for plant which, given <strong>the</strong> relatively long lead times for biomasselectricity projects, may not be operational before new <strong>Renewable</strong>s Obligation(RO) banding levels come into force.3.134 Our work with industry suggests that <strong>the</strong>se uncertainties could impact <strong>the</strong>4 GW of projects in <strong>the</strong> pipeline but not in construction. DECC is takingvarious actions to improve investor confidence.3.135 In 2010 <strong>the</strong> Government “grandfa<strong>the</strong>red” 77 <strong>the</strong> level of support available formost dedicated-feedstock and energy from waste plant under <strong>the</strong> RO from <strong>the</strong>point of full accreditation, subject to <strong>the</strong> 2037 end date of <strong>the</strong> scheme. Inaddition, it accelerated <strong>the</strong> timetable for <strong>the</strong> 2013 Banding Review to provideclarity by <strong>the</strong> end of <strong>the</strong> year, one year earlier than previously planned aboutfuture support levels for new projects. The Review will address <strong>the</strong> issue ofgrandfa<strong>the</strong>ring remaining biomass technologies.3.136 Electricity Market Reform is designed to improve <strong>the</strong> market’s ability to finance<strong>the</strong> huge investment in low carbon electricity that is needed over <strong>the</strong> nextdecade and beyond. In implementing this change, <strong>the</strong> Government is aware of<strong>the</strong> need to ensure a smooth transition from <strong>the</strong> <strong>Renewable</strong>s Obligation.3.137 In addition, <strong>the</strong> Government is developing a Bioenergy Strategy for publicationby <strong>the</strong> end of <strong>the</strong> year. This will provide clarity on our ambition for biomasselectricity in <strong>the</strong> context of <strong>the</strong> o<strong>the</strong>r uses for biomass, including non-energyuses. It will set out an expectation of sustainable biomass from domesticsources and imports, taking into account all available evidence on <strong>the</strong> full lifecycle carbon impact of biomass, including Indirect Land-Use Change (ILUC)effects. The Scottish Government is committed to ensure impacts on existingbiomass users are mitigated as demand continues to grow, including aforthcoming review of support for large-scale electricity-only biomass under<strong>the</strong> <strong>Renewable</strong>s Obligation Scotland.Actions:• DECC will consult on banding levels for biomass electricity, including co-firingand conversion of fossil plant, in summer 2011, in order to publish finalisedlevels by <strong>the</strong> end of <strong>the</strong> year.• DECC is publishing its EMR White Paper alongside this document, settingout details of <strong>the</strong> new support mechanism and <strong>the</strong> transition from <strong>the</strong> RO.• The Government will publish its <strong>UK</strong> Bioenergy Strategy by <strong>the</strong> end of <strong>the</strong> year.De-risk <strong>the</strong> supply of sustainable feedstocks3.138 Dedicated biomass electricity offers great potential for cost effectiverenewable electricity generation, provided that it is generated from sustainablefeedstocks. As noted above, <strong>the</strong> Government’s ambition for biomasselectricity depends on <strong>the</strong> availability of suitable feedstocks. The Governmentconsiders that sustainable biomass should be cultivated, processed and77 Grandfa<strong>the</strong>ring is a policy that support levels should not change once generation has been accredited undera scheme, <strong>the</strong>reby providing investors greater certainty.73
<strong>UK</strong> <strong>Renewable</strong> <strong>Energy</strong> <strong>Roadmap</strong>transported in a way which delivers real and significant greenhouse gassavings compared to <strong>the</strong> fossil fuel it is replacing. In particular, forest andwoodlands must be sustainably managed to ensure continuing supplies infuture years. There would also be significant public concern to projectsdelivering unsustainable generation.3.139 To safeguard sustainability, <strong>the</strong> Government has ensured that from April 2011RO support is only available for bioliquids that deliver at least 35%greenhouse gas savings and do not use materials sourced from landimportant on carbon or biodiversity grounds, such as primary forest, peatlandand wetland 78 . For solid and gaseous fuels we have introduced standardsbased on a 60% reduction in GHG. Generators are required to report againstcriteria for solid and gaseous fuels from April 2011, in preparation for arequirement to meet <strong>the</strong>m from April 2013 in order to receive RO support 79 .3.140 At present, RO sustainability standards do not take into account <strong>the</strong> possiblecarbon impacts generated by ILUC. The European Commission is expected tocome forward with proposals in July 2011 for sustainability standards on <strong>the</strong>indirect emissions from bioliquids, which <strong>the</strong> <strong>UK</strong> will consider as a matter ofpriority.3.141 The supply chain for biomass feedstocks is currently too immature and mustexpand to support <strong>the</strong> level of biomass electricity generation we envisagegiven competing uses for <strong>the</strong> fuel. There is potentially a huge global capacityif properly exploited, with possibly 10% of <strong>the</strong> net international marketavailable to <strong>the</strong> <strong>UK</strong> 80 . The introduction of sustainability standards will facilitate<strong>the</strong> rapid development of <strong>the</strong> supply chains.Actions:• To safeguard sustainability, DECC will under <strong>the</strong> RO, introduce mandatorysustainability standards for all solid, liquid and gaseous biofuels used forelectricity generation in <strong>the</strong> <strong>UK</strong> by April 2013.• To improve <strong>the</strong> consideration of planning applications, DECC will make a‘GHG lifecycle assessment tool for biomass heat and electricity generation’available for public use by December 2011, and will develop acommunications plan with industry and NGOs on opportunities and risksassociated with <strong>the</strong> technology.78 There are exceptions, including for wastes.79 There is a de minimis threshold of 1MW for <strong>the</strong> requirement to meet <strong>the</strong> standards for solid and gaseousfuels.80 Report by AEA Technology for DECC, ‘<strong>UK</strong> and Global Bioenergy Resource – Final report’, available athttp://www.decc.gov.uk/assets/decc/what%20we%20do/uk%20energy%20supply/energy%20mix/renewable%20energy/policy/1464-aea-2010-uk-and-global-bioenergy-report.pdf74
<strong>UK</strong> <strong>Renewable</strong> <strong>Energy</strong> <strong>Roadmap</strong>Case study: Tilbury Power StationTilbury Power Station in Essex began full operation as a coal-fired power station in 1969.The plant burnt its last coal in May 2011 and is expected to be fully operational as abiomass plant by <strong>the</strong> end of 2011, continuing until closure due to Large CombustionPlants Directive opt-out by 2015 at <strong>the</strong> latest.Once conversion is complete, Tilbury is expected to have a capacity of around 750MW,and will use approximately 2m tonnes of sustainable biomass over its operational life.Compared to continuing to burn coal, <strong>the</strong> use of biomass at Tilbury should save at least2.6M tonnes of CO 2 , as well as reducing SOx emissions by over 80%, NOx emission byhalf, and particulate emission by around 90%.In addition to <strong>the</strong> power generated and<strong>the</strong> associated environmental benefits,Tilbury has enabled lessons to be learntto improve <strong>the</strong> process of biomassconversion. In particular, Tilbury hasmade progress on supply chains and<strong>the</strong> logistics of shipping and storingbiomass pellets, and will provideevidence for <strong>the</strong> reliability and stabilityof wood pellet combustion as an energysource over a sustained period.In addition to <strong>the</strong> energy generated by <strong>the</strong> plant, <strong>the</strong> conversion has <strong>the</strong> potential to makeTilbury – on <strong>the</strong> banks of <strong>the</strong> Thames – a hub for <strong>the</strong> import of biomass into <strong>the</strong> <strong>UK</strong>. Thejetty at Tilbury has capacity to import 4m tonnes of biomass every year which can be usedto generate heat, electricity or both. These imports are nearly double what is required by<strong>the</strong> plant.Generation from waste feedstock3.142 Our analysis suggests that developers must overcome additional challengesin relation to securing consents and permits, accessing long-term waste fuelcontracts, and securing finance in order to deploy more innovative biomasselectricity from waste. Key actions are summarised below for wastecombustion and advanced <strong>the</strong>rmal technologies, drawing on <strong>the</strong> recent WasteReview which outlines <strong>the</strong> Government’s ambition for <strong>Energy</strong> from Waste(EfW); Anaerobic Digestion (AD) is considered in <strong>the</strong> Biomass Heat section.Planning and consenting3.143 EfW projects, particularly combustion plant, can face strong opposition fromlocal communities, driven by concerns about potential impacts on a range ofissues from health and traffic generation, to whe<strong>the</strong>r waste will be divertedfrom recycling. The Government will ensure that a transparent and robustevidence base is available on <strong>the</strong> opportunities and risks posed by EfW.75
<strong>UK</strong> <strong>Renewable</strong> <strong>Energy</strong> <strong>Roadmap</strong>3.144 Approximately 80% of <strong>the</strong> 0.9 GW of electricity from waste projects in <strong>the</strong>pipeline are under 50MW and so will be decided at local level. Reform of <strong>the</strong>local and infrastructure-scale planning systems in England are discussed in<strong>the</strong> onshore wind section above, alongside measures to give localcommunities a greater stake in renewables development.3.145 Our work with industry suggests that EfW projects suffer from perceiveduncertainty about <strong>the</strong> Government’s commitment to <strong>the</strong> use of waste forelectricity generation, and <strong>the</strong> level and surety of long term financial supportwhich will be provided for this. There are concerns too about <strong>the</strong> burden ofmonitoring and sampling work required to measure <strong>the</strong> biogenic (<strong>the</strong>renewable component) content of mixed waste fuels under <strong>the</strong> RO.3.146 To address uncertainty, <strong>the</strong> Government has set out its commitment to <strong>the</strong>role of EfW within <strong>the</strong> waste hierarchy as part of <strong>the</strong> Waste Review and hasaccelerated <strong>the</strong> timetable for <strong>the</strong> RO Banding Review. In addition,Government has grandfa<strong>the</strong>red support for biomass electricity from wasteunder <strong>the</strong> RO where this is generated through CHP plant or advancedconversion technologies. To facilitate <strong>the</strong> use of mixed fuels, <strong>the</strong> Governmentis working with stakeholders to develop a more reliable and cost effective fuelmonitoring and sampling approach for application across EfW technologies.3.147 Wider concerns relate to <strong>the</strong> burden of regulation, particularly for AdvancedConversion Technologies (ACT). The novel nature of <strong>the</strong> technologies canmake it challenging for <strong>the</strong> industry to navigate <strong>the</strong> Environment Agencyguidance and environmental permitting rules which do not always recognisetechnical differences between <strong>the</strong>se and standard combustion processes. TheACT industry suggest, for example, that applying criteria intended forincinerators make some gasification projects technically infeasible and mightadd up to £1m to a small pyrolysis project. Our analysis indicates thatresolving <strong>the</strong>se issues could facilitate <strong>the</strong> deployment of up to 140 MW 81 ofACT projects currently in <strong>the</strong> planning pipeline and around a fur<strong>the</strong>r 20 MW ofpyrolysis projects.3.148 It is essential that EfW plants are regulated to provide confidence that <strong>the</strong>y areoperating safely. Government is taking action to ensure this is done in a waythat does not create unnecessary barriers to deployment.Actions• Defra will deliver <strong>the</strong> actions outlined in <strong>the</strong> recently published Waste Review,which aim to overcome barriers to growth in <strong>Energy</strong> from Waste markets andhelp facilitate community acceptance of waste infrastructure. These includepublishing a guide to <strong>the</strong> full range of energy from waste technologiesavailable to help decision-makers, and identifying commercially viable routesby which communities can realise benefits from hosting recoveryinfrastructure.81 Based on data collected by Arup for <strong>the</strong>ir report on <strong>the</strong> RO Banding review.76
<strong>UK</strong> <strong>Renewable</strong> <strong>Energy</strong> <strong>Roadmap</strong>• DECC will work with Defra, Welsh Government, EA, and industry on anongoing basis to ensure that waste management legislation does not haveunintended consequences on development of <strong>the</strong> energy recovery industry.• DECC will work with Defra, Welsh Government, industry and delivery partnersto develop cost-effective fuel monitoring and sampling systems for accuratelymeasuring <strong>the</strong> renewable content of mixed wastes and waste derived energy.Ofgem will announce a decision on <strong>the</strong> use of methodologies based oncarbon-14 dating by summer 2011.Accessing long-term waste fuel contracts3.149 Many EfW projects are financed on <strong>the</strong> basis of securing long-term wastesupply contracts with local authorities. However, by <strong>the</strong> nature of <strong>the</strong>ir longduration, as <strong>the</strong> use of EfW increases developers could find it increasinglydifficult to source appropriate feedstock through this route alone. This isbecause significant quantities of <strong>the</strong> waste required currently goes to landfill,especially commercial and industrial (C&I), and construction and demolition(C&D) wastes, including waste wood, which do not usually fall under LocalAuthority control. As a result, contracts for such waste are usually offered on ashort term basis, which can be a much more challenging environment fordevelopers when seeking investment but also represents a significantopportunity in terms of <strong>the</strong> volumes of wastes available.3.150 To address this issue, <strong>the</strong> Government is focussing on measures to divertwaste from landfill including <strong>the</strong> introduction of possible landfill restrictions forwaste wood, improved information on <strong>the</strong> location of C&I and C&D waste and<strong>the</strong> quantities available, and supply chain development.Actions• Defra will seek to expand capacity to treat C&I and C&D waste throughimproved information on waste supply and composition and developing fur<strong>the</strong>r<strong>the</strong> supply chains for waste wood and solid recovered fuel.• Defra will consult by autumn 2012 on possible measures for landfillrestrictions for waste wood.Access to finance3.151 EfW projects often struggle to secure finance, particularly if <strong>the</strong>y involve <strong>the</strong>use of advanced technologies, which are often untested at commercial scaleand <strong>the</strong>refore viewed as high risk. Historically, Private Finance Initiative (PFI)has been a key funding model for waste infrastructure, but many o<strong>the</strong>rfacilities are entirely funded by <strong>the</strong> market. Investment in combustion plant isbetter established but has been hit by <strong>the</strong> economic downturn.3.152 To tackle this problem, Government has provided support for a number ofACT demonstration projects and is considering how best to target any fundingavailable in future years. In addition, it has created <strong>the</strong> Green InvestmentBank which could play a role in supporting innovative technologies.77
<strong>UK</strong> <strong>Renewable</strong> <strong>Energy</strong> <strong>Roadmap</strong>3.153 DECC is working with fellow members of <strong>the</strong> Low Carbon Innovation Group toidentify <strong>the</strong> key innovation needs in a range of technologies, including <strong>the</strong>generation of energy from waste and biomass, to determine howGovernment’s innovation funding can best address <strong>the</strong>m. Subject to <strong>the</strong>conclusion of this work and value for money assessments, funding fromDECC’s Innovation Programme budget will be available, if needed, to supportinnovation in key technology areas such as <strong>the</strong> advanced conversion ofwaste.Actions• Over <strong>the</strong> next 12 months DECC will continue to consider measures to exploreways to reduce <strong>the</strong> commercial risk of new technologies• DECC is expecting to announce details of potential funding to supportinnovation in Autumn 2011, subject to conclusion of innovation needs workand value for money assessments.78
<strong>UK</strong> <strong>Renewable</strong> <strong>Energy</strong> <strong>Roadmap</strong>Biomass Heat• In 2010 <strong>the</strong> <strong>UK</strong> generated 12.4 TWh 82 of renewable heat from biomass, 12.1 TWh ofthis from biomass boilers and 0.3 TWh from <strong>Energy</strong> from Waste 83 .• The central range suggests that non-domestic biomass heat could contribute up to50 TWh by <strong>2020</strong>. The majority of this would come from biomass boilers (includingsome from district heating and CHP), with a smaller contribution from biogas injectionto <strong>the</strong> gas grid. This central range requires an annual growth rate of up to 17%.• The Government does not currently collect pipeline data for renewable heat on aroutine basis but will do so from <strong>the</strong> end of 2011.• Constraints on deployment include: technology cost, supply chain for sustainable fuel,air quality regulation, planning and environmental permitting, investor confidence, and<strong>the</strong> costs associated with biogas injection into <strong>the</strong> gas grid.Priority actions:• Technology costs: Implement <strong>the</strong> RHI in Great Britain to make renewable heat frombiomass boilers, municipal solid waste and onsite biogas combustion competitive withfossil fuel generation. Consult on a scheme to support renewable heat in Nor<strong>the</strong>rnIreland from April 2012 subject to <strong>the</strong> agreement of <strong>the</strong> Nor<strong>the</strong>rn Ireland Executive.• Supply chain for sustainable fuel and qualified engineers: Introduce reporting criteria in2011 for <strong>the</strong> sustainability of biomass used under <strong>the</strong> RHI and put <strong>the</strong>m on a mandatorybasis from 2013. Ensure that installations of 45 KWth or less are certified and havebeen installed by MCS (or equivalent) registered engineers.• Air quality regulation: Introduce emission performance standards for biomass boilers asa condition for receiving RHI to ensure air quality impacts are effectively managed.• Planning and environmental permitting: The Environment Agency in 2011 will vary <strong>the</strong>‘Standard Rules’ to enable more AD plant to benefit from this type of environmentalpermit, which are usually easier, quicker and cheaper to obtain than a bespoke permit.• Investor confidence: Government is supporting four AD demonstration projects toillustrate <strong>the</strong> effectiveness of this technology in practice and will make RHI available forbiomethane injection into <strong>the</strong> gas grid and heat generated by biogas produced from AD.Increase <strong>the</strong> level of support for AD under FITs for projects up to 500 kW subject tostate aids.• Costs associated with biomethane injection into <strong>the</strong> grid: RHI will include support forbiomethane injection; review permitting and planning processes with a view to reducingcompliance requirements if appropriate.Current deployment3.154 The <strong>UK</strong> generated 12.4 TWh of biomass heat in 2010, 12.1TWh of this frombiomass boilers and 0.3 TWh from <strong>Energy</strong> from Waste (EfW). The majority ofheat generation from biomass boilers is in <strong>the</strong> non-domestic sector 84 . Mostinstallations are large scale (for example, it is estimated that 74% of82The government does not currently have data on installed capacity for biomass heat. We collect data on <strong>the</strong>quantity of fuel used which is reported in D<strong>UK</strong>ES, but not on <strong>the</strong> number or size of heating units installed83 Source: <strong>Energy</strong> Trends June 2011. Measured on Gross Calorific Value basis (as opposed to <strong>Renewable</strong> <strong>Energy</strong>Directive methodology)84 Source: AEA ‘Biomass Boilers - Market size and direction’ – April 201179
<strong>UK</strong> <strong>Renewable</strong> <strong>Energy</strong> <strong>Roadmap</strong>renewable heat output in Scotland in 2008/09 was from plant of at least 1MW)and run on forestry-derived fuel 85 .3.155 In terms of EfW, <strong>the</strong> <strong>UK</strong> generates heat by <strong>the</strong> combustion of biogas andmunicipal solid waste (MSW). At <strong>the</strong> end of 2010, <strong>the</strong> <strong>UK</strong> had 46 generatingon-farm or commercial AD biogas sites, plus a fur<strong>the</strong>r 146 plants at sewagetreatment works. These use <strong>the</strong> decomposition of wet organic material toproduce methane rich ‘biogas’, which can be burnt on-site to generate heat orelectricity or cleaned and injected into <strong>the</strong> distribution gas network.Deployment potential3.156 Figure 22 presents <strong>the</strong> results of recent analysis of <strong>the</strong> potential for growth in<strong>the</strong> deployment of non-domestic sector biomass heat 86 to <strong>2020</strong>. It overlays anindustry view of <strong>the</strong> deployment that could be achieved (<strong>the</strong> ‘industry low’ and‘industry high’ scenarios) around a central range.3.157 The central range indicates that non-domestic biomass heat could contributeup to 50 TWh of renewable energy by <strong>2020</strong>. The majority of this would comefrom biomass boilers (including district heating & CHP) and biogas injectionto <strong>the</strong> gas grid. This central range requires an annual growth rate of up to17%. The industry scenarios suggests that <strong>the</strong> market has <strong>the</strong> potential tobring forward 27-55 TWh of non-domestic biomass heat by <strong>2020</strong>.Figure 22: Deployment potential to <strong>2020</strong> for non-domestic biomass heat85 The 74% figures comes from <strong>the</strong> Scottish Government <strong>Renewable</strong> Heat Action Plan, 2009. All but one of <strong>the</strong>large scale plant identified operate on forestry derived biomass.86 The analysis includes non-domestic biomass boilers, biomass district heating, and biogas injection to <strong>the</strong> gasgrid. It also includes <strong>the</strong> heat output from CHP technology.80
<strong>UK</strong> <strong>Renewable</strong> <strong>Energy</strong> <strong>Roadmap</strong>3.158 The industry low scenario reflects factors such as a low assumed take-up ofbiogas to heat in <strong>the</strong> industrial sector and low take-up of AD by <strong>the</strong> livestockwaste and energy crop industries. The high scenario is based on a set ofmore optimistic assumptions on <strong>the</strong>se variables and our level of success ifremoving barriers to <strong>the</strong> deployment of biomass boilers.3.159 Analysis by DECC 87 suggests that <strong>the</strong> levelised cost of non-domestic sectorbiomass heat could vary from £22-£159 per MWh in <strong>2020</strong>, largely unchangedfrom £22-£156 in 2010. The large ranges reflect variation in <strong>the</strong> energyefficiency of <strong>the</strong> buildings being heated 88 , and <strong>the</strong> fact that <strong>the</strong> levelised costis higher on average for biomass district heating than biogas. Costs changesover time are muted due to offsetting effects on capital, installation andoperating costs. Capital and installation costs are projected to fall slightly dueto learning effects, whilst operating prices are projected to rise with increasingfeedstock prices.Deployment pipeline3.160 At present, <strong>the</strong> Government does not routinely ga<strong>the</strong>r data on <strong>the</strong> pipeline forrenewable heat projects. However, we are looking at doing so from later in2011. In addition, we will be collecting deployment data on projects thatbenefit from <strong>the</strong> RHI and RHPP scheme, including information frompreliminary accreditations. We will use this data to provide greater insight intodeployment trends and barriers and intend to make this information publiclyavailable.Journey to deployment3.161 Biomass heat covers a range of technologies, feedstock and distributiontechniques, all of which face different development and deploymentchallenges. The process for developing two types of biomass heat project isillustrated below, with key areas of challenge to deployment highlighted in red.Non-domestic biomass boilers3.162 Discussions with industry suggest that it can take anywhere between 1 monthand several years to bring a non-domestic biomass boiler from scoping tooperation. In particular, timing will depend on <strong>the</strong> specific challenges todeployment, <strong>the</strong> scale of installation and whe<strong>the</strong>r it is linked to <strong>the</strong>development of transport infrastructure and buildings e.g. for fuel storage,which requires planning permission. Figure 23 outlines <strong>the</strong> journey for a largerscale non-domestic biomass boiler in England.87 Based on work by AEA Technology, summarised in section 2.2 of <strong>the</strong> <strong>Roadmap</strong>. Due to a lack of reliable datawe assume that costs for biogas are fixed over time.88 This affects <strong>the</strong> total quantity of heat required in <strong>the</strong> building, across which <strong>the</strong> fixed costs of <strong>the</strong> technologyare spread.81
<strong>UK</strong> <strong>Renewable</strong> <strong>Energy</strong> <strong>Roadmap</strong>Figure 23: Developer journey map for <strong>the</strong> deployment of non-domestic boilers3.163 In general, planning permission is not required for a boiler unless it is in aconservation area, but it may be required for <strong>the</strong> boiler house, fuel silo andflue (if exceeding roof height by 1m). If <strong>the</strong>re is likely to be an increase in largevehicle movement to deliver and transport fuel, planning permission is morelikely to be required. The size of installation and type of fuel used dictatewhich permissions and regulators are involved.Anaerobic digestion to produce biogas3.164 Biogas projects generally takes around two years from scoping to operation,as illustrated in Figure 24 below, although this can vary from six months forsmall on-farm plant to five years for a large municipal installation. Biogas fromAD plant can be combusted to produce heat for use on-site or cleaned toproduce biomethane for injection into <strong>the</strong> gas grid.82
<strong>UK</strong> <strong>Renewable</strong> <strong>Energy</strong> <strong>Roadmap</strong>Figure 24: Developer journey map for deployment of anaerobic digestion toproduce biogasChallenges to deployment and actionsNon-domestic biomass boilers3.165 Our analysis of deployment statistics and discussions with industry suggestthat <strong>the</strong>re are at least three main challenges to deployment for non-domesticbiomass boilers in <strong>the</strong> <strong>UK</strong>:Higher cost than fossil fuel alternatives3.166 Although fuel costs can be lower for biomass boilers than fossil fuelgeneration, equipment and installation costs are significantly higher – not leastbecause biomass units need to be larger than typical fossil fuel systems andrequire additional fuel storage and feeding systems. In addition, hurdle ratesare increased by <strong>the</strong> dependency on a new fuel source, which raises <strong>the</strong> riskof supply interruption, and for projects exporting heat, by <strong>the</strong> risk that <strong>the</strong>customer will go out of business. These are all factors which increase <strong>the</strong>implicit cost of investment.3.167 Without action to tackle cost, it is unlikely that deployment will increase muchfrom current levels. This puts much of <strong>the</strong> additional 11-21 TWh 89 of heat frombiomass boilers anticipated in <strong>the</strong> central range at risk.89 Central range for biomass boilers within composite central range for biomass heat.83
<strong>UK</strong> <strong>Renewable</strong> <strong>Energy</strong> <strong>Roadmap</strong>3.168 To address this, <strong>the</strong> Government is introducing <strong>the</strong> RHI in Great Britain toprovide support to organisations installing eligible renewable heating systems,including standard and CHP biomass boilers, biomass energy from MSW andbiogas combustion. The RHI will provide a stream of payments over a 20 yearperiod, covering its additional cost in comparison to <strong>the</strong> fossil fuel alternativeand a rate of return on investment.3.169 The Government is considering <strong>the</strong> case for supporting bioliquids under <strong>the</strong>RHI from 2012. For Combined Heat and Power – where at present <strong>the</strong>renewable heat element is recognised by an uplift to <strong>the</strong> RO – DECC will use<strong>the</strong> Banding Review to clarity <strong>the</strong> relative roles of <strong>the</strong> RO and RHI insupporting this form of generation. This will give biomass electricity producersgreater clarity about <strong>the</strong> benefits of exploiting waste renewable heat from <strong>the</strong>irelectricity generation. Nor<strong>the</strong>rn Ireland is currently considering <strong>the</strong> introductionof a scheme to encourage uptake of renewable heat.Action:• DECC have laid <strong>the</strong> regulations for establishing <strong>the</strong> RHI for Parliamentaryapproval in July 2011.• DECC will use <strong>the</strong> 2011 Banding Review to clarify <strong>the</strong> relative roles of <strong>the</strong> ROand RHI in supporting Combined Heat and Power schemes.• Nor<strong>the</strong>rn Ireland Executive will consult over <strong>the</strong> summer with <strong>the</strong> goal ofhaving a scheme in place by 1 April 2012 subject to agreement by <strong>the</strong>Nor<strong>the</strong>rn Ireland Executive.Supply chain for sustainable feedstock and qualified engineers3.170 Although national and global markets for sustainable biomass are developingrapidly, <strong>the</strong>y are still less mature than markets for conventional fossil fuels. Asa result, prospective generators of biomass heat sometimes struggle tosecure a long-term source of sustainable feedstock, ei<strong>the</strong>r from within <strong>the</strong> <strong>UK</strong>,<strong>the</strong> EU or beyond. In addition, although <strong>UK</strong> companies are increasinglyfocusing on installation, operation and maintenance, developers still report alack of qualified engineers to install and maintain biomass boilers. Thesefactors could constrain progress in deploying <strong>the</strong> additional 11 – 21 TWh ofbiomass boilers anticipated in <strong>the</strong> central range 90 .3.171 To facilitate <strong>the</strong> development of a sustainable supply chain <strong>the</strong> RHI will requiregenerators of 1MWth and above, including biomethane producers, to providequarterly reports on <strong>the</strong> biomass <strong>the</strong>y use, including <strong>the</strong> quantity, type, formand country of origin, and whe<strong>the</strong>r an environmental accreditation has beenmet. It will use this information to inform <strong>the</strong> development of mandatorycriteria, which generators must meet from 2013 onwards to qualify for supportunder <strong>the</strong> RHI.90 Central range for biomass boilers within composite central range for biomass heat.84
<strong>UK</strong> <strong>Renewable</strong> <strong>Energy</strong> <strong>Roadmap</strong>3.172 The RHI will help too in stimulating <strong>the</strong> supply chain for engineers in <strong>the</strong> <strong>UK</strong>,encouraging more installers to apply for <strong>the</strong> relevant competent personsscheme required to meet Building Regulations. In <strong>the</strong> domestic sector,installers will need to belong to <strong>the</strong> Microgeneration Certification Scheme(MCS) 91 or equivalent if homeowners wish to claim <strong>the</strong> <strong>Renewable</strong> HeatPremium Payment (RHPP).Action:• To facilitate development of sustainable feedstock <strong>the</strong> Government willintroduce reporting criteria in 2011 for <strong>the</strong> sustainability of biomass usedunder <strong>the</strong> RHI and make <strong>the</strong>se criteria mandatory from 2013 for <strong>the</strong> receipt ofRHI.• To stimulate <strong>the</strong> supply chain for qualified engineers, <strong>the</strong> Government willensure that certain installations of 45 kWth or less must be certified underMCS or equivalent and must have been installed by MCS certified engineers(or equivalent) to receive <strong>the</strong> RHI or RHPP.Air quality regulation3.173 Biomass boilers generate particulate matter and nitrogen oxides, which fallunder our legally binding EU air quality targets. However, whilst <strong>the</strong>re isregulation to control <strong>the</strong>se emissions from biomass boilers of 20 MWth ormore, <strong>the</strong>re is no similar framework for smaller units. Uncertainty overapproval rates results from a lack of clear regulation on air quality impacts forboilers under 20 MWth.Action:• DECC is planning under phase 2 of <strong>the</strong> RHI to introduce emissionperformance standards for particulate matter and nitrogen oxides as acondition for biomass boilers of less than 20MWth to be eligible for support.Anaerobic Digestion to produce biogas3.174 Whilst many of <strong>the</strong> barriers to generating heat from waste are similar to thosefor biomass electricity from waste (discussed in section 3.1.4 above), <strong>the</strong>reare a number of challenges which are specific to AD and biogas injection thatalso require attention. The Government published its Anaerobic DigestionStrategy in June 2011 92 outlining a joint programme of work with industry onbarriers to AD. Action is under way in a number of areas already.91 MCS is a <strong>UK</strong> wide scheme and any Nor<strong>the</strong>rn Ireland renewable heat incentivisation programme willalso require installers to be registered with MCS.92 http://www.decc.gov.uk/en/content/cms/news/gb_anaerobic/gb_anaerobic.aspx85
<strong>UK</strong> <strong>Renewable</strong> <strong>Energy</strong> <strong>Roadmap</strong>Case study: BV Dairy Anaerobic Digestion PlantBV Dairy in Dorset has installed a £2.3millioninnovative anaerobic digestion plant. This uses50,000 tonnes a year of liquid waste from <strong>the</strong>irdairy and food processing plant to generaterenewable heat and electricity. The biogas from<strong>the</strong> AD plant is fed to a 190kWe combined heatand power engine which generates 2.1 GWh ofelectricity and 1.7 GWh of heat per year.The electricity is used in <strong>the</strong> food manufacturing operation, and <strong>the</strong> surplus is exportedto <strong>the</strong> national grid. Some of <strong>the</strong> heat is used to keep <strong>the</strong> digester at <strong>the</strong> correcttemperature and <strong>the</strong> rest is used in <strong>the</strong> manufacturing operation to replace heat that waspreviously generated by oil burning boilers. BV Dairy will cut its carbon footprint byabout 60% - reducing its output of carbon by about 1,200 tonnes per year.Planning and environmental permitting3.175 Industry indicate that in <strong>the</strong>ir view, environmental permitting rules place anundue burden on AD projects given <strong>the</strong> typical size of plant and <strong>the</strong> limitedrisks <strong>the</strong>y pose. The factors increase development cost, introduce delays, andthreaten some of <strong>the</strong> projects that could be built by <strong>2020</strong>.3.176 To reduce regulatory burdens, <strong>the</strong> Environment Agency (EA) will this yearamend <strong>the</strong> relevant Standard Rules to enable more AD plant to benefit fromthis type of environmental permit, which are usually easier, quicker, andcheaper to obtain than a bespoke permit. The Government is reforming <strong>the</strong>planning system in England to ensure that <strong>the</strong> sustainable developmentneeded to support economic growth is able to proceed as easily as possible.This embraces a range of measures which should make it easier to obtainplanning permission for appropriately-sited AD plants.Action:• The EA will, in 2011, amend <strong>the</strong> relevant Standard Rules to enable more ADplant to benefit from this type of environmental permit.Investor confidence3.177 Large AD projects – particularly those at commercial scale or for which <strong>the</strong>biogas produced is intended for <strong>the</strong> gas grid – are at a very early stage ofdevelopment in <strong>the</strong> <strong>UK</strong> and as such are perceived as high risk by investors.3.178 To boost investor confidence, DECC and Defra are supporting four ADdemonstration projects. These projects will help demonstrate <strong>the</strong>effectiveness of AD plants working in practice.86
<strong>UK</strong> <strong>Renewable</strong> <strong>Energy</strong> <strong>Roadmap</strong>3.179 In addition, <strong>the</strong> Government will, from <strong>the</strong> start of <strong>the</strong> RHI scheme in 2011,make RHI payments available for biomethane injection into <strong>the</strong> gas grid and<strong>the</strong> generation of heat from biogas produced from all wastes through AD. Thiswill ensure a stream of payments for projects over a twenty year period,improving <strong>the</strong>ir financial attractiveness to investors. In June 2011 <strong>the</strong>Government announced that it will also be increasing <strong>the</strong> level of support forAD of up to 500kW for new entrants to <strong>the</strong> Feed-in Tariff. This change is dueto take effect from 1 st August 2011 93 , bolstering <strong>the</strong> level of financial supportavailable for farm-scale AD in <strong>the</strong> <strong>UK</strong>.Action:• Government will publish findings from its four AD demonstration projects inspring 2012 to increase <strong>the</strong> availability of information about AD to <strong>the</strong> market.• DECC will provide support for biomethane injection and all wastes used tocreate biogas through AD under <strong>the</strong> RHI from 2011.• DECC, subject to state aid clearance, will increase <strong>the</strong> level of supportavailable under <strong>the</strong> FIT scheme for new AD projects of up to 500 kW from 1 StAugust 2011.Costs associated with biogas injection into <strong>the</strong> gas grid3.180 Biogas must be cleaned and transported before it can be injected into <strong>the</strong> gasgrid on health and safety grounds. Therefore, injection is currently a morecostly option than using biogas onsite for heat generation. These costs relatefor example to <strong>the</strong> need to reduce <strong>the</strong> concentration of oxygen andcontaminants, and to obtain grid injection equipment and a gas transporterlicence. They serve as a disincentive to deployment and could risk much of<strong>the</strong> addition 3-6 TWh anticipated from biogas injection in <strong>the</strong> central range.3.181 In addition to providing RHI for biogas injection, <strong>the</strong> Government is workingwith range of delivery partners to consider whe<strong>the</strong>r it is appropriate to amendsome of <strong>the</strong> regulations which currently apply to biogas injection from ADplant.Actions:• The Health and Safety Executive is working with network companies toassess whe<strong>the</strong>r <strong>the</strong> maximum permissible levels of oxygen and contaminantmatter in grid gas can be increased safely to reduce <strong>the</strong> costs of cleaningbiogas for injection.• DECC is scoping <strong>the</strong> possibility of providing a gas transporter licenceexemption for those, including AD plant, who produce gas onshore. We hopeto have this in place by <strong>the</strong> end of 2011.93 subject to EU State Aid clearance87
<strong>UK</strong> <strong>Renewable</strong> <strong>Energy</strong> <strong>Roadmap</strong>Case study: Thames Water Biogas to <strong>the</strong> Electricity GridIn October 2010, Thames Water’s Didcot sewagetreatment works in Oxfordshire became <strong>the</strong> first <strong>UK</strong> site tofeed renewable gas into <strong>the</strong> national gas grid, so helpingto de-carbonise <strong>the</strong> grid. Sludge, <strong>the</strong> solid part of sewage,is treated in an anaerobic digester to produce biogas.This is <strong>the</strong>n cleaned to remove impurities.The resulting biomethane is of a suitable quality to be fedinto <strong>the</strong> gas grid as a replacement for natural gas. Thewhole process - from flushing a toilet to <strong>the</strong> gas entering<strong>the</strong> grid - takes around 20 days The biomethane output is sufficient to meet <strong>the</strong> needs ofup to 200 homes. The project was a joint venture between Thames Water, British Gas andScotia Gas Networks. It took six months to complete and cost £2.5m.88
<strong>UK</strong> <strong>Renewable</strong> <strong>Energy</strong> <strong>Roadmap</strong>Ground source heat pumps and air source heatpumps• There are approximately 37,000 air and ground source heat pumps installed across<strong>the</strong> <strong>UK</strong>. This equates to around 0.6 GWth in terms of installed capacity, generating0.7 TWh at <strong>the</strong> end of 2010 94 .• The central range suggests that non-domestic heat pumps could contribute up to22 TWh by <strong>2020</strong>, 14 TWh of this from ground source heat pumps and 9 TWh from airsource. This central range requires an annual growth rate of up to 41%.• Constraints on deployment include: technology cost; planning & licensing processes;thin installer base; demands on <strong>the</strong> electricity grid; and performance & technicalissues.Priority actions:• Technology costs: Introducing <strong>the</strong> RHI and <strong>the</strong> RHPP for eligible heat pumps from2011 and 2012 respectively.• Planning and licensing processes: Introducing permitted development rights for airsource heat pumps on domestic properties in England, confirmation of detailsexpected very shortly.• Availability of good quality installers and engineers: Developing national occupationalstandard and competences for installers, and consulting on extending <strong>the</strong>Microgeneration Certification Scheme (which covers heat pumps up to 45kW th ) toensure equipment meet high standards.• Demands on <strong>the</strong> electricity grid: Monitoring usage patterns and <strong>the</strong> grid impact ofexisting installations, whilst setting Government’s strategy for <strong>the</strong> future of ourdistribution networks.• Performance and technical issues: Ensure that RHI is only available to eligible heatpumps with a Coefficient of Performance of greater than 2.9. Undertaking <strong>UK</strong> studiesand field trials to gain data on <strong>the</strong> variation in performance of heat pumps acrossinstallations to ensure efficiency.Current deployment3.180 Initial analysis for DECC suggests that <strong>the</strong> <strong>UK</strong> has around 37,000 units 95(equating to around 0.6 GWth of capacity), 28,000 of which are in <strong>the</strong>domestic sector (0.2 GWth) and 8,500 in <strong>the</strong> non-domestic sector (0.4 GWth).3.181 Most of those in <strong>the</strong> domestic sector are installed in newly built housing. Theretrofit market is currently quite small but <strong>the</strong> RHPP, domestic RHI, andactions set out in <strong>the</strong> Microgeneration Strategy will help <strong>the</strong> market to expandfur<strong>the</strong>r.Deployment potential3.182 Figure 25 presents <strong>the</strong> results of recent analysis of <strong>the</strong> potential for growth in<strong>the</strong> deployment of non-domestic air and ground source heat pumps to <strong>2020</strong>.94 Source: <strong>Energy</strong> Trends June 201195 Source: AEA heat pump baseline survey information for DECC89
<strong>UK</strong> <strong>Renewable</strong> <strong>Energy</strong> <strong>Roadmap</strong>It overlays an industry view of <strong>the</strong> deployment that could be achieved (<strong>the</strong>‘industry low’ and ‘industry high’ scenarios) around a central range.3.183 The central range suggests that non-domestic heat pumps could contribute upto 22 TWh (equivalent to around 100,000 installations). Of this, ground sourceheat pumps are expected to contribute 14 TWh, with a contribution of 9 TWhfrom air source heat pumps. This central range requires an annual growth rateof up to 41%. The industry scenarios suggest that <strong>the</strong> market has <strong>the</strong> potentialto bring forward 12-51 TWh of non-domestic heat pumps by <strong>2020</strong>.3.184 The exact generation and installation levels will depend on <strong>the</strong> relativedemand for different renewables heat technologies, including <strong>the</strong> mix betweendomestic heat pumps and larger, commercial units.Figure 25: Deployment potential to <strong>2020</strong> for non-domestic heat pumps3.185 The industry low scenario is based on <strong>the</strong> assumption that annual growthrates tail off slightly from 2010 to <strong>2020</strong>, <strong>the</strong> high projection on <strong>the</strong> assumptionthat growth rates increase considerably. The large spread between <strong>the</strong>setrajectories is reflective of <strong>the</strong> opportunities and risks associated with newtechnology markets. Key uncertainties for heat pumps include <strong>the</strong> rate ofinnovation to improve technology performance, demand response to <strong>the</strong> RHI,<strong>the</strong> speed at which <strong>the</strong> installer base grows, and likely public perceptions.3.186 The industry high scenario implies a substantial increase in peak loadelectricity demand, which would require reinforcement of local grid networks.DECC monitors electricity usage patterns and has published a strategy for <strong>the</strong>future of our distribution networks alongside <strong>the</strong> EMR white paper. The high90
<strong>UK</strong> <strong>Renewable</strong> <strong>Energy</strong> <strong>Roadmap</strong>trajectory is demanding but, as analysis for <strong>the</strong> IEA 96 shows, similarly highrates of deployment have been achieved in o<strong>the</strong>r EU Member States in recentyears.3.187 Analysis by DECC 97 suggests that <strong>the</strong> cost of non-domestic sector heatpumps could range from £42-£67 per MWh for <strong>2020</strong>, down slightly from £44-£75 in 2010. These ranges reflect variation in <strong>the</strong> energy efficiency of <strong>the</strong>buildings being heated 98 , and <strong>the</strong> fact that capital cost is lower on average forair-source than ground-source heat pumps. Cost reductions over time aremuted due to conflicting changes in capital, installation and operating costs.Whilst capital and installation costs are expected to fall in response to learningeffects, operating costs are expected to rise with increasing electricity prices.Deployment pipeline3.188 Government does not currently ga<strong>the</strong>r statistics on <strong>the</strong> deployment pipeline fornew heat pump installation. We will also be collecting data on heat pumpsdeployed under <strong>the</strong> RHI and RHPP. We will use this information to providegreater insight into deployment trends and barriers, and intend to make thispublicly available.Journey to deploymentFigure 26: Developer journey maps for non-domestic sector heat pumpsGround source heat pump, open loop system96 IEA Heat Pump Centre Newsletter Volume 28 – No. 3/201097 Based on work by AEA Technology, summarised in section 2.2 of <strong>the</strong> <strong>Roadmap</strong>.98 This affects <strong>the</strong> total quantity of heat required in <strong>the</strong> building, across which <strong>the</strong> fixed costs of <strong>the</strong> technologyare spread.91
<strong>UK</strong> <strong>Renewable</strong> <strong>Energy</strong> <strong>Roadmap</strong>Ground source heat pump, closed loop systemAir source heat pump3.189 Figure 26 above outlines <strong>the</strong> process for deploying large ground and airsource heat pumps, and <strong>the</strong> groups and bodies involved, with key challengesto deployment highlighted in red.3.190 Our analysis suggests that for a non-domestic air source heat pump <strong>the</strong>average time from scoping to operation is around five months. Lead times are92
<strong>UK</strong> <strong>Renewable</strong> <strong>Energy</strong> <strong>Roadmap</strong>harder to interpret for ground source heat pumps 99 as <strong>the</strong>se are usuallyinstalled as part of wider civil or building works, but preliminary analysissuggests that this can take around six months if planning permission andenvironmental permitting are not required. If consents are needed, <strong>the</strong>process is longer with environmental permitting usually lasting at least a year.Challenges to deployment and actions3.191 Our analysis of deployment statistics and discussions with industry suggestthat developers face challenges relating to cost, performance, market infancy(on <strong>the</strong> demand and supply side) and regulation in deploying heat pumps.Some factors impact differently for domestic and non-domestic customers andfor ground- and air-source technology.Technology cost3.192 Heat pumps are more expensive to purchase and install than conventionalfossil fuel heating. Fuel bill savings are often insufficient to recoup <strong>the</strong>se costsin <strong>the</strong> short to medium term, particularly for domestic customers and thosewho were previously served by gas. Cost is a barrier for both air and groundsource technologies and could risk most, if not all, of <strong>the</strong> central deploymentrange of 16-22 TWh by <strong>2020</strong>.3.193 The RHI will provide support for <strong>the</strong> deployment of eligible non-domestic heatpumps. The scheme will cover ground and water source heat pumps, and isdue to be launched later in 2011. Air source heat pumps are not covered atpresent, but DECC is looking to include air source heat pumps from 2012,subject to feasibility, affordability, and a value for money assessment. Thescheme will be extended to include <strong>the</strong> domestic sector alongside <strong>the</strong> GreenDeal. Nor<strong>the</strong>rn Ireland is currently considering <strong>the</strong> details of <strong>the</strong>ir renewableheat incentive programme.3.194 In addition, DECC is providing up to £15million of support to householdsunder <strong>the</strong> RHPP, which will include air source and ground source heat pumps,and will be launched this Summer.Action:• The RHI for <strong>the</strong> non-domestic sector will be open for application from Autumn2011.• Nor<strong>the</strong>rn Ireland Executive will consult over <strong>the</strong> summer with <strong>the</strong> goal ofhaving a scheme in place by 1 April 2012 subject to agreement by <strong>the</strong>Nor<strong>the</strong>rn Ireland Executive.Planning and licensing processes3.195 Developers report that <strong>the</strong>re are delays in <strong>the</strong> planning process for air-sourceheat pumps and <strong>the</strong> environmental permitting process for ground source heatpumps.99 Open or closed loop93
<strong>UK</strong> <strong>Renewable</strong> <strong>Energy</strong> <strong>Roadmap</strong>3.196 Open-loop ground source heat pumps must be licensed by <strong>the</strong> EA to ensurethat <strong>the</strong>y do not have an adverse effect on <strong>the</strong> environment. The EA indicatethat this process can take up to a year to complete, including time to drill aborehole. These factors add to <strong>the</strong> cost and timing of developments, andcould prevent deployment rates from rising as anticipated in <strong>the</strong> centraldeployment range.3.197 The EA is working to streamline <strong>the</strong> licensing process for open-loop groundsource heat pumps, including through <strong>the</strong> publication of guidance fordevelopers making applications. The Government is working to deliverpermitted development rights in England for some air source heat pumpsinstalled on domestic properties, and to consider doing <strong>the</strong> same forinstallations on non-domestic premises. This will remove <strong>the</strong> requirement forexpress planning permission from <strong>the</strong> local council for some installations.Action:• The EA have issued guidance advising developers of best practice whenapplying for an environmental permit for open-loop ground source heatpumps.• DCLG will report to Parliament on <strong>the</strong> introduction of permitted developmentrights for air source heat pumps on non-domestic land in England.Performance and technical issues3.198 Field trials 100 indicate that <strong>the</strong> performance of heat pumps in <strong>the</strong> domesticsector can vary considerably across installations. There is concern too tha<strong>the</strong>at pumps can require more maintenance than standard boilers.3.199 Variation in performance is a particular issue for <strong>the</strong> domestic sector whereinstallations are not yet commonplace (installation quality is crucial todetermining performance), customers are inexperienced in using <strong>the</strong>ir heatpumps efficiently, and it is common to rely on off-<strong>the</strong>-shelf units which may notbe ideally sized. Underperformance must be tackled. Under EU rules onlyheat pumps with a coefficient of performance 101 (CoP) of 2.9 or more areeligible to count towards <strong>the</strong> 15% target. It could also impact public attitudesand limit demand.3.200 Toge<strong>the</strong>r <strong>the</strong>se factors could substantially limit <strong>the</strong> level of progress possibletowards <strong>the</strong> central deployment range of 16-22 TWh by <strong>2020</strong>.3.201 To improve data on performance, DECC has asked <strong>the</strong> <strong>Energy</strong> Saving Trustto use <strong>the</strong> second round of <strong>the</strong> heat pumps field trial to monitor modificationsto poorly performing sites and ga<strong>the</strong>r fur<strong>the</strong>r data. Government will alsoconsider emissions of hydrofluorocarbons (HFCs) used as heat pumprefrigerants to ensure consistency with existing regulations and ongoingdiscussions on phasing down of HFC production and consumption. DECC willbe closely monitoring heat pumps and o<strong>the</strong>r technologies receiving support100 http://www.energysavingtrust.org.uk/cym/Generate-your-own-energy/Heat-pump-field-trial101 The coefficient measures <strong>the</strong> ratio of heat output to electrical input for <strong>the</strong> technology.94
<strong>UK</strong> <strong>Renewable</strong> <strong>Energy</strong> <strong>Roadmap</strong>under <strong>the</strong> RHPP scheme through metering and through survey responses, tounderstand better how <strong>the</strong> systems perform in a variety of different situationsand how actual performance measures up against manufacturer and installerclaims. In addition, DECC has commissioned laboratory experiments on heatpump performance and Thermostatic Radiator Valves.3.202 To ensure that only good quality equipment and installers are incentivised,DECC will ensure only eligible heat pumps with a CoP of 2.9 or greater will beeligible for support under <strong>the</strong> RHI. Under <strong>the</strong> RHPP, households support willonly be available for households using an installer who is accredited under <strong>the</strong>Microgeneration Certification Scheme (MCS) or equivalent. To maximise <strong>the</strong>impact of <strong>the</strong> MCS, DECC will tighten its standards on training and <strong>the</strong>technical abilities of installers and will extend <strong>the</strong> scheme to heat pumps ofmore than 45kWth.Action:• DECC will ensure that, from <strong>the</strong> inception of <strong>the</strong> RHI scheme in 2011, it is onlyavailable for heat pumps with a CoP of 2.9 or greater.• DECC will ensure that, from <strong>the</strong> inception of <strong>the</strong> RHPP scheme, it is onlyavailable for households using an MCS certified installers or equivalent.• DECC will in 2011-12 use laboratory research, <strong>the</strong> RHPP, and <strong>the</strong> secondround of <strong>the</strong> EST heat pump field trial to collect data on how best to improveheat pump performance.Availability of good quality installers and engineers3.203 The Heat and Hot Water Task Force 102 indicates a lack of good-quality heatpumps installers in <strong>the</strong> <strong>UK</strong>. In particular, it suggests that <strong>the</strong> <strong>UK</strong> will need in<strong>the</strong> order of 8,000-10,000 heat pump installers to deliver <strong>the</strong> estimation levelsof generation required by <strong>2020</strong>. Installers will need to have appropriate skillsto ensure high quality installation. In addition, as illustrated in <strong>the</strong> developerjourney charts above, ground source heat pumps will require specialist inputfrom drilling and bore hole engineers.3.204 Without an increase in <strong>the</strong> availability of skilled installers and engineers, it isunlikely that heat pumps will be deployed at <strong>the</strong> rates required to meet <strong>the</strong>21TWh upper end of <strong>the</strong> central deployment range.3.205 The Government is taking action to stimulate <strong>the</strong> supply chain directly andindirectly by stimulating <strong>the</strong> demand for renewable heat technologies.3.206 The RHI and RHPP will stimulate demand for renewable heat technologies bylowering <strong>the</strong>ir effective cost for those wishing to install. We anticipate that thiswill encourage additional training and R&D in <strong>the</strong> British renewables industry,ultimately increasing <strong>the</strong> availability of skilled installers. RHI will be launchedfor <strong>the</strong> commercial and industrial sector in 2011, and we will monitor its impacton both deployment and underlying development of <strong>the</strong> market102 http://www.beama.org.uk/en/news/index.cfm/hhwt_pathways_<strong>2020</strong>_report95
<strong>UK</strong> <strong>Renewable</strong> <strong>Energy</strong> <strong>Roadmap</strong>3.207 The Sector Skills Council (Summit Skills) is developing a nationaloccupational standard and competence framework to encourage upskillingmore directly in <strong>the</strong> heat pump industry. Details of <strong>the</strong> scheme, which willinitially apply to <strong>the</strong> domestic sector, are set out in <strong>the</strong> MicrogenerationStrategy, published in June 2011.3.208 In addition, <strong>the</strong> Microgeneration Strategy sets out a full action plan for on-siterenewable heat technologies. This covers <strong>the</strong> range of non-financial barriersto deployment developed toge<strong>the</strong>r with <strong>the</strong> industry and to be taken forwardby <strong>the</strong>m including: certification; assessment; warranties; technology;information.Action:• DECC will establish <strong>the</strong> RHI from 2011 onwards to stimulate <strong>the</strong> demand forrenewable heat and with it <strong>the</strong> supply chain for high quality installers.• The Sector Skills Council (Summit Skills) will, by <strong>the</strong> end of 2011, revise <strong>the</strong>national occupational standard and competency framework for heat pumpinstallers.96
<strong>UK</strong> <strong>Renewable</strong> <strong>Energy</strong> <strong>Roadmap</strong><strong>Renewable</strong> <strong>Energy</strong> in Transport• In 2010 <strong>the</strong> <strong>UK</strong> met 14.1 TWh of its energy demand for transport from renewablesources, equivalent to 3.6% of road transport energy demand and up from 0.2% in2005 103 .• The Government is committed to meeting <strong>the</strong> transport sub-target in <strong>the</strong> <strong>Renewable</strong><strong>Energy</strong> Directive (RED).• Proposed biofuel usage to 2014 was set out in <strong>the</strong> Department for Transport’s recentconsultation on transport elements of <strong>the</strong> RED and <strong>the</strong> greenhouse gas savingsrequirements of <strong>the</strong> Fuel Quality Directive (FQD). Currently, <strong>the</strong> levels as set in <strong>the</strong><strong>Renewable</strong> Transport Fuel Obligation are for 4% in 2011/12, 4.5% in 2012/13 and 5%for 2013/14 and onwards.• For <strong>the</strong> period beyond 2014 <strong>the</strong> Government is continuing to develop its evidence baseon sustainability and deployment and, subject to <strong>the</strong> outcome of <strong>the</strong> recentconsultations, will consult in Spring 2012 on possible trajectories for biofuels supplybeyond 2014, with a fur<strong>the</strong>r consultation on proposed legislative changes in late 2012.• Challenges to <strong>the</strong> increased usage of renewable energy in transport include: potentialsustainability issues around biofuel supply and considerations for best deploymentacross modes and sectors; <strong>the</strong> need for investment in infrastructure; <strong>the</strong> currentadditional up-front cost of ultra-low emission vehicles in relation to fossil-fuelalternatives; and support for innovation.Priority actions:• Biofuel sustainability and deployment: DfT’s recent consultation on <strong>the</strong> RED and <strong>the</strong>FQD include proposals to introduce mandatory sustainability criteria for biofuels. Inaddition, DfT will examine proposals due from <strong>the</strong> EU in July 2011 for action on IndirectLand Use Change impacts and will shortly publish work on <strong>the</strong> best use of biofuelsacross modes.• Plug-In Vehicle Infrastructure: DfT, BIS and DECC (through <strong>the</strong> Office of Low EmissionVehicles – OLEV) are supporting <strong>the</strong> Plugged-In Places programme. Eight areas areinstalling charging infrastructure for plug-in vehicles and in June 2011, OLEVpublished a strategy for plug-in vehicle infrastructure in <strong>the</strong> <strong>UK</strong>.• Financial support for <strong>the</strong> purchase of ultra-low emission vehicles: OLEV launched <strong>the</strong>Plug-in Car Grant in January 2011 providing a 25% subsidy (up to £5000) for <strong>the</strong>purchase of eligible ultra-low emission cars which meet safety, environmental andperformance standards.• Support for innovation: Funding to support fur<strong>the</strong>r development of low carbon vehicletechnologies by identifying priority technologies for innovation, and funding through <strong>the</strong>SET Plan initiatives.Current deployment3.209 In 2010 <strong>the</strong> <strong>UK</strong> met 14.1 TWh of its energy demand for transport fromrenewable sources, equivalent to 3.6% of road transport demand and up from0.2% in 2005 104 .103 Under <strong>the</strong> <strong>Renewable</strong> <strong>Energy</strong> Directive measure, all renewable transport contributed 13.3 TWh, or 2.9%towards capped transport target (excluding air). Source: <strong>Energy</strong> Trends June 2011104 As above97
<strong>UK</strong> <strong>Renewable</strong> <strong>Energy</strong> <strong>Roadmap</strong>3.210 <strong>Renewable</strong> energy is more widely used at present in road transport than inrail, shipping, or aviation. The vast majority of usage in <strong>the</strong> road transportsector has been in biofuels, driven by <strong>the</strong> <strong>Renewable</strong> Transport FuelObligation, which requires that suppliers of fossil fuel for road transport tosource a proportion of <strong>the</strong>ir supply from biofuels.3.211 The RFTO target level for <strong>the</strong> financial year 2009-10 was 3.25%, againstwhich 3.33% 105 was delivered – 71% of this from biodiesel, 29% frombioethanol and under 1% from biomethane. Around 15% of <strong>the</strong> feedstock forthis fuel was waste material.3.212 At <strong>the</strong> end of 2010 <strong>the</strong>re were 11,500 low-emission (including electric)vehicles in <strong>the</strong> <strong>UK</strong>, used in road transport 106 .Deployment potential3.213 The <strong>Renewable</strong> <strong>Energy</strong> Directive (RED) sets a target for <strong>the</strong> <strong>UK</strong> to source10% of its energy used for all forms of transport 107 from renewable sources by<strong>2020</strong>. Biofuels made from wastes, residues and ligno-cellulosic material countdouble towards <strong>the</strong> 10% target, and electric vehicles by a factor of 2.5.Biofuels used must meet sustainability standards on biodiversity andembedded emissions from growth and processing (discussed in more detailbelow).3.214 Figure 27 presents a trajectory delivering up to 48 TWh of renewable energyin transport by <strong>2020</strong>. As described below, it illustrates that while <strong>the</strong>re iscertainty over <strong>the</strong> level of deployment expected to 2014, Government has notyet finalised <strong>the</strong> pathway for renewable transport for <strong>the</strong> period between2014–<strong>2020</strong> including <strong>the</strong> role of wastes, advanced biofuels and electricvehicles.3.215 Whilst renewable energy in transport is vital to help meet our ambitions forrenewable energy and carbon reduction, it must be from sustainable sources.There are concerns that <strong>the</strong> mandatory RED sustainability criteria for biofuelsdo not address key issues such as Indirect Land Use Change (ILUC), and thishas implications for <strong>the</strong> 10% transport sub-target. Until <strong>the</strong>se are resolved wemust take a cautious approach to <strong>the</strong> level of biofuels used in transport.105 Calculated on a by volume basis – not directly comparable with <strong>the</strong> <strong>Renewable</strong> <strong>Energy</strong> Directive 10% target.106 Source: DVLA/DfT http://www2.dft.gov.uk/pgr/statistics/datatablespublications/vehicles/licensing/allnew/veh0170.xls107 For <strong>the</strong> purpose of calculating <strong>the</strong> percentage of renewable energy consumed in transport, aviation isincluded in <strong>the</strong> numerator only; for <strong>the</strong> denominator, road and rail transport only are taken into account.98
<strong>UK</strong> <strong>Renewable</strong> <strong>Energy</strong> <strong>Roadmap</strong>Figure 27: Trajectory for deployment of renewable energy in transport to <strong>2020</strong>3.216 Government is currently undertaking extensive analysis and engaging withstakeholders to consider <strong>the</strong>se issues. The recent consultations on <strong>the</strong>transport elements of <strong>the</strong> RED and <strong>the</strong> greenhouse gas (GHG) savingsrequirements of <strong>the</strong> FQD, set out a proposal to place a legal obligation on <strong>the</strong>Secretary of State for Transport to consider what additional measures will berequired to ensure that <strong>the</strong> <strong>UK</strong> delivers <strong>the</strong> requirements of <strong>the</strong> RED and FQDin <strong>the</strong> period 2014 to <strong>2020</strong>. Subject to <strong>the</strong> results of this consultation, DfT willconsult in 2012 on <strong>the</strong> possible approach for renewable transport for <strong>the</strong>period between 2014–20, including <strong>the</strong> contribution from biofuels, and willmake <strong>the</strong> required legislative changes in 2013.Analytical work to define pathway beyond 20143.217 A key element of our work to define a pathway beyond 2014 is <strong>the</strong> BioenergyStrategy which Government is developing with <strong>the</strong> Devolved Administrations.This will examine <strong>the</strong> likely supply of sustainable bioenergy to <strong>the</strong> <strong>UK</strong> fromdomestic and international sources to 2050 given competing demand fromabroad and o<strong>the</strong>r sectors, and will look at how best to apportion this resourcebetween transport, heat and electricity in <strong>the</strong> <strong>UK</strong> considering issues of costeffectivenessand potential GHG savings. It will consider <strong>the</strong> importance ofexploiting <strong>UK</strong> feedstocks such as waste, which do not present obvioussustainability concerns.3.218 For <strong>the</strong> transport sector specifically, DfT has commissioned analytical work toproduce scenarios for <strong>the</strong> cost-effective deployment of biofuels across <strong>UK</strong>aviation, rail, shipping, and various form of road transport out to 2050. This will99
<strong>UK</strong> <strong>Renewable</strong> <strong>Energy</strong> <strong>Roadmap</strong>look at <strong>the</strong> relative cost-effectiveness of using <strong>the</strong> available resource indifferent modes given, for example, <strong>the</strong> availability – or not – of o<strong>the</strong>r optionsfor reducing emissions. DfT will publish a suite of research reports from thiswork in summer 2011.3.219 On aviation, DfT published a call for evidence document 108 in March 2011outlining <strong>the</strong> proposed scope of its work to develop a long term, sustainableframework for <strong>UK</strong> aviation. The call for evidence, which closes on 30 thSeptember 2011, outlines <strong>the</strong> range of issues which DfT propose to consider,including <strong>the</strong> potentially crucial role of biofuels in this sector given <strong>the</strong> lack ofo<strong>the</strong>r options available for reducing emissions.3.220 The Government will use <strong>the</strong>se pieces of work and advice from <strong>the</strong> Committeeon Climate Change on <strong>the</strong> best use of bioenergy in <strong>the</strong> <strong>UK</strong> (expected inNovember) to inform its strategy for renewable transport.Challenges to deployment and actions3.221 The <strong>UK</strong> will need to overcome four main challenges in order to increase <strong>the</strong>usage of sustainable renewable energy in transport in line with <strong>the</strong> 10%transport sub-target.Assuring <strong>the</strong> sustainability of biofuel supplies3.222 For biofuels to be beneficial <strong>the</strong>y must be produced sustainability. It particular,<strong>the</strong>ir production should not place undue pressure on areas of highbiodiversity, and <strong>the</strong>y must deliver real emissions savings in comparison to<strong>the</strong> fossil fuels <strong>the</strong>y are replacing.3.223 The RED and FQD contain mandatory sustainability criteria for biofuels.These criteria include that biofuels, with some exceptions, must delivergreenhouse gas savings of at least 35% when compared to fossil fuels andthat biofuels must not be sourced from areas of high biodiversity, or from highcarbon soils (e.g. rainforests or wetlands). DfT consulted on <strong>the</strong>implementation of <strong>the</strong>se criteria, proposing that only biofuels meeting <strong>the</strong>required standards would count towards <strong>Renewable</strong> Transport FuelObligation 109 . The consultation closed on 2 June.3.224 On <strong>the</strong> issue of ILUC, where <strong>the</strong> cultivation of biofuel feedstock on existingagricultural land results in <strong>the</strong> displacement of production on to previouslyuncultivated land, <strong>the</strong> European Commission will bring forward proposals by<strong>the</strong> end of July 2011. The <strong>UK</strong> will examine <strong>the</strong>se proposals as a matter ofpriority in <strong>the</strong> light of its own analytical work on this issue.108 Developing a Sustainable Framework for <strong>UK</strong> Aviation: Scoping Document –http://www.dft.gov.uk/consultations/open/2011-09/consultationdocument.pdf109 The exception is biofuels produced from waste and residues (o<strong>the</strong>r than agricultural, aquaculture, fisheriesand forestry residues), which are treated differently. As <strong>the</strong>se are not derived from crops, <strong>the</strong>y are viewed asprima facie sustainable and must only meet <strong>the</strong> criterion of delivering a GHG savings of at least 35%.100
<strong>UK</strong> <strong>Renewable</strong> <strong>Energy</strong> <strong>Roadmap</strong>3.225 Consideration also needs to be given to <strong>the</strong> role of advanced biofuels andthose produced from waste that count twice towards targets under <strong>the</strong> RED.Actions:• Government will assess <strong>the</strong> European Commission’s proposals due to bepublished in July 2011. We will consider whe<strong>the</strong>r <strong>the</strong> proposals areappropriate with a view to ensuring effective standards on Indirect Land UseChange.Infrastructure and supply chain development3.226 Investment will be needed in infrastructure and <strong>the</strong> <strong>UK</strong> supply chain to support<strong>the</strong> increased usage of plug-in vehicles to <strong>2020</strong> and beyond. For plug-invehicles, investment in charging infrastructure may be needed so thatmotorists can charge <strong>the</strong>ir plug-in vehicles safely and conveniently across <strong>the</strong>country.3.227 The Plugged-In Places programme provides match-funding to consortia ofbusiness and <strong>the</strong> public sector for eight schemes across <strong>the</strong> <strong>UK</strong> (London,Milton Keynes, <strong>the</strong> North East of England, Nor<strong>the</strong>rn Ireland, Scotland, GreaterManchester, <strong>the</strong> Midlands and <strong>the</strong> East of England), to support <strong>the</strong> installationof a critical mass of charging points in each area.3.228 The Office of Low Emission Vehicles have recently published Making <strong>the</strong>Connection: <strong>the</strong> Plug in Infrastructure Strategy drawing on evidencegenerated about driver behaviour from <strong>the</strong> Plugged-In Places programme ando<strong>the</strong>r trials taking place in <strong>the</strong> <strong>UK</strong> and overseas.Actions:• Government has made available up to £30m available for to support <strong>the</strong>Plugged-in Places programme.Upfront cost of Ultra Low Emission Vehicles3.229 Ultra low-emission vehicles such as electric vehicles are still an emergingtechnology and are not yet produced in large numbers. As a result, <strong>the</strong>irupfront cost to customers is currently higher than that of conventionally fuelledvehicles.3.230 The Government believes that ultra-low emission vehicles have an importantrole to play in <strong>the</strong> long term decarbonisation of <strong>UK</strong> transport. It is taking actionto create a more level playing field between <strong>the</strong> cost of new and existingtechnologies, until scale effects drive <strong>the</strong> cost of new technologies down to amore competitive level.3.231 In its 2011 Spending Review <strong>the</strong> Government confirmed more than £400m ofsupport for <strong>the</strong> Ultra Low Emission Vehicles (ULEVs) for <strong>the</strong> lifetime of thisParliament. This includes funding for <strong>the</strong> ‘Plug-in Car Grant’ scheme whichwas launched in January 2011 to provide customers buying an electric, plug-101
<strong>UK</strong> <strong>Renewable</strong> <strong>Energy</strong> <strong>Roadmap</strong>in hybrid, or hydrogen-fuelled car with a grant equal to 25% of <strong>the</strong> vehiclepurchase price, up to a value of £5,000. The scheme is available for privateand business customers, and cars bought must comply with performance,environmental and safety standards in order to be eligible.Actions:• In <strong>the</strong> 2011 Spending Review, <strong>the</strong> Government confirmed more than £400mof support for Ultra Low Emission Vehicles (ULEVs) over <strong>the</strong> lifetime of thisParliament.• In January 2011 DfT launched <strong>the</strong> ‘Plug-in Car Grant’, providing a 25% grant– up to £5000 – for <strong>the</strong> purchase of electric, plug-in hybrid, or hydrogenfuelledcars.Case study: Supporting <strong>the</strong> take-up of ultra-low emission carsThe Government announced <strong>the</strong> first nine electric and ultra-low emission cars eligible for<strong>the</strong> Plug-In Car Grant in December 2010. These are: <strong>the</strong> Mitsubishi i-MiEV; Smart fortwoelectric drive; Peugeot iOn; Nissan Leaf; Tata Vista; Citroen CZero; Vauxhall Ampera;Toyota Prius Plug-in Hybrid; and <strong>the</strong> Chevrolet Volt. The Renault Fluence joined <strong>the</strong> list inJune 2011.The scheme began on 1 January 2011,reducing <strong>the</strong> cost of vehicles by 25%, upto £5,000.The Plugged-In Places scheme supportseight projects around <strong>the</strong> country. Theseprojects have successfully bid for ashare of a £30 million fund aimed atencouraging a new network of plug-invehicle recharging points in streets,homes and sites such as car parks andcommercial retail and leisure facilities.The successful Plugged-In Placesconsortia are based in: <strong>the</strong> Midlands;Greater Manchester; East of England;Scotland; Nor<strong>the</strong>rn Ireland; London;Milton Keynes; and <strong>the</strong> North East.Support for innovation3.232 Ongoing research and development work is required to support <strong>the</strong>development and deployment of <strong>the</strong> emerging generation of new ultra lowcarbon vehicles. Government provides funding to support specific programmesof work in this area, including <strong>the</strong> development of new engines for plug-in hybridcars to improve vehicle performance and materials that reduce vehicle weight.This funding includes supporting <strong>the</strong> Technology Strategy Board's Low CarbonVehicle Innovation Platform which invests jointly with industry in research and102
<strong>UK</strong> <strong>Renewable</strong> <strong>Energy</strong> <strong>Roadmap</strong>development to help <strong>UK</strong>-based businesses maximise <strong>the</strong> economic benefitsassociated with a developing ULEV market.3.233 Recent studies 110 commissioned by Government indicate that advancedtechnologies may be an important element of meeting our needs to <strong>2020</strong>, andincreasingly valuable post <strong>2020</strong> as we move towards a low carbon transportsystem. Key areas already identified as potential routes include<strong>the</strong>rmochemical conversion which can produce mid-distillates such asbiodiesel and jet fuel. Developing <strong>the</strong>se fuels will reduce <strong>the</strong> use ofagricultural land needed for food, and increase <strong>the</strong> use of wastes for energy,as well as generating high lifecycle greenhouse gas savings.3.234 DfT’s recent consultation proposed introducing double rewards for biofuelsmade from wastes, residues and non-food cellulosic and ligno-cellulosicmaterials. The <strong>UK</strong> are involved in securing key future funding routes, such as<strong>the</strong> EU’s Strategic <strong>Energy</strong> Technology (SET) Plan. The SET Plan outlineswhat needs to be done from an EU perspective to achieve its <strong>2020</strong> energyand emission targets and 2050 vision. Its objectives are: sustainability;security of supply; and retaining EU competitiveness. The <strong>UK</strong> is a strongsupporter of <strong>the</strong> SET Plan and DECC is engaged with <strong>the</strong> <strong>UK</strong> fundingorganisations (Research Councils, TSB, Carbon Trust, ETI); multiplierorganisations; and individual companies and research organisations, topromote and encourage SET Plan engagement.3.235 DECC is working with fellow members of <strong>the</strong> Low Carbon Innovation Group toidentify <strong>the</strong> key innovation needs in a range of technologies, including <strong>the</strong>generation of energy from waste and biomass, to determine howGovernment’s innovation funding can best address <strong>the</strong>m. Subject to <strong>the</strong>conclusion of this work and value for money assessments, funding fromDECC’s Innovation Programme budget will be available, if needed, to supportinnovation in key technology areas such as <strong>the</strong> advanced conversion ofwaste.Actions:• The Government has made provision of around £80 million to support aprogramme of research and development of programme research anddevelopment in ultra-low carbon technologies. The most recent competition isaimed at highly innovative collaborative R&D technologies, feasibility studiesof disruptive technologies and <strong>the</strong> feasibility of automotive battery recyclingand re-use.• Government has contributed to a total award of £24 million for six projectsthrough which large vehicle manufacturers will help to grow <strong>the</strong> supply chainfor a low carbon vehicles industry within <strong>the</strong> <strong>UK</strong> by working toge<strong>the</strong>r with smallto medium sized enterprises to provide support and a potential route to agrowing market.110 Draft DfT “modes” Study and National Non-Food Crops Centre Study – ‘Advanced Biofuels: The Potentialfor a <strong>UK</strong> Industry103
<strong>UK</strong> <strong>Renewable</strong> <strong>Energy</strong> <strong>Roadmap</strong>• DECC will be announcing details of potential funding to support innovation inAutumn 2011, subject to conclusion of innovation needs work and value formoney assessments.104
<strong>UK</strong> <strong>Renewable</strong> <strong>Energy</strong> <strong>Roadmap</strong>Chapter 4: Supporting deliveryA Process for Delivery4.1 The development and publication of this <strong>Roadmap</strong> is <strong>the</strong> first step in anongoing process. We will publish a revised document annually to update onprogress, and to reflect any new additions to our evidence base which arisefrom collaborative working with stakeholders.Figure 28: Annual <strong>Roadmap</strong> cyclePUBLISHROADMAPANALYSISANDPLANNINGEVIDENCEGATHERING4.2 Through <strong>the</strong> course of Chapter 3 we have set out actions against a range ofrenewable technologies from <strong>the</strong> electricity, heat and transport sectors. Futureeditions of <strong>the</strong> <strong>Roadmap</strong> will report progress against <strong>the</strong>se activities andanalyse <strong>the</strong>ir impact in alleviating <strong>the</strong> barriers to deployment.Monitoring and Reporting Progress4.3 We will be monitoring several key areas as indicators of progress and tosupport our evidence base:• consumption of renewable energy;• renewable energy deployment and pipeline;• reasons for project failure and barriers to delivery;• impact of policy activity;• changes to technology costs.4.4 The level of overall renewable energy consumption in <strong>the</strong> <strong>UK</strong> is <strong>the</strong> keyindicator for reporting progress to <strong>the</strong> European Commission for both <strong>the</strong>interim targets and against <strong>the</strong> 15% target to be achieved by <strong>2020</strong>. The <strong>UK</strong>interim targets are set at 4% for <strong>the</strong> period 2011-12, <strong>the</strong>n 5.4% for 2013-14,7.5% for 2015-16, and 10.2% for 2017-18. Progress against <strong>the</strong>se targets will105
<strong>UK</strong> <strong>Renewable</strong> <strong>Energy</strong> <strong>Roadmap</strong>be provided on an annual basis following publication of <strong>the</strong> Digest of UnitedKingdom <strong>Energy</strong> Statistics in July each year.4.5 Government is already working to ga<strong>the</strong>r a broad range evidence onrenewables through market intelligence, commissioned studies, and for nationalenergy statistics. In areas where <strong>the</strong> market is changing or expanding, we arealso seeking to expand our evidence base. DECC will ga<strong>the</strong>r data onrenewable heat developments, as well as renewable electricity, to develop ourunderstanding of <strong>the</strong> project pipeline in this growing market.4.6 Alongside this we will continue to monitor <strong>the</strong> impacts of <strong>the</strong> barriers todeployment, and will review <strong>the</strong> progress of delivering <strong>the</strong> programme ofactions set out above in Chapter 3. Continued engagement with <strong>the</strong> market willalso enable Government to anticipate future deployment risks, innovationopportunities and changes to technology costs, and to reprioritise our deliveryactions as appropriate.4.7 Official reports to <strong>the</strong> European Commission, along with future iterations of <strong>the</strong><strong>Roadmap</strong>, will be accessible online. This will enable stakeholders and <strong>the</strong>public to access <strong>the</strong> most up-to-date evidence and analysis on renewables. Forexample, it will include deployment information from <strong>the</strong> annual Digest of <strong>UK</strong><strong>Energy</strong> Statistics, DECC’s quarterly <strong>Energy</strong> Trends publications, and <strong>the</strong><strong>Renewable</strong> <strong>Energy</strong> Planning Database.Conclusion4.8 Through implementation of <strong>the</strong> actions outlined in this <strong>Roadmap</strong> we intend totackle <strong>the</strong> key barriers which are impeding <strong>the</strong> deployment of renewables in <strong>the</strong><strong>UK</strong>. To ensure that we are focusing activity and resources effectively we willanalyse <strong>the</strong> impact of <strong>the</strong>se actions and monitor deployment progress across<strong>the</strong> sectors.4.9 Technology costs, innovation breakthroughs and barriers to deployment willchange over time. DECC will continue to work with market participants ando<strong>the</strong>rs from across <strong>the</strong> renewables sector to better understand <strong>the</strong> potential ofrenewable energy through to <strong>2020</strong>, and to identify and react to new constraintsand opportunities as <strong>the</strong>y emerge. With each edition of <strong>the</strong> <strong>Roadmap</strong> we will beone step fur<strong>the</strong>r along <strong>the</strong> path to delivering our target for <strong>2020</strong>.106
© Crown copyright 2011Department of <strong>Energy</strong> & Climate Change3 Whitehall PlaceLondon SW1A 2AWwww.decc.gov.ukURN 11D/698