Topics Covered for Exam 1
Topics Covered for Exam 1
Topics Covered for Exam 1

You also want an ePaper? Increase the reach of your titles
YUMPU automatically turns print PDFs into web optimized ePapers that Google loves.
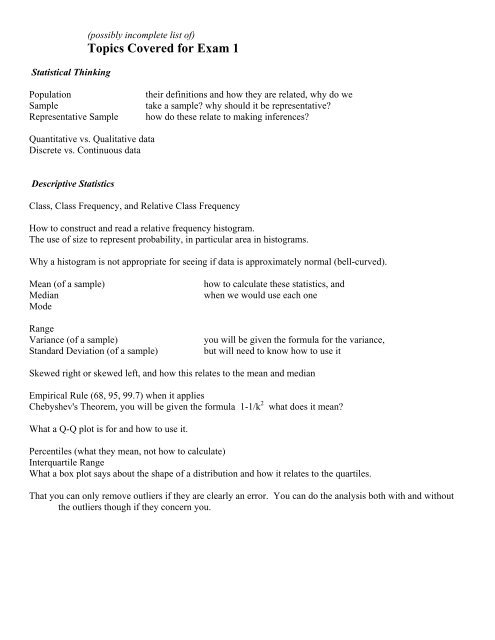
Statistical Thinking(possibly incomplete list of)<strong>Topics</strong> <strong>Covered</strong> <strong>for</strong> <strong>Exam</strong> 1PopulationSampleRepresentative Sampletheir definitions and how they are related, why do wetake a sample? why should it be representative?how do these relate to making inferences?Quantitative vs. Qualitative dataDiscrete vs. Continuous dataDescriptive StatisticsClass, Class Frequency, and Relative Class FrequencyHow to construct and read a relative frequency histogram.The use of size to represent probability, in particular area in histograms.Why a histogram is not appropriate <strong>for</strong> seeing if data is approximately normal (bell-curved).Mean (of a sample)MedianModeRangeVariance (of a sample)Standard Deviation (of a sample)how to calculate these statistics, andwhen we would use each oneyou will be given the <strong>for</strong>mula <strong>for</strong> the variance,but will need to know how to use itSkewed right or skewed left, and how this relates to the mean and medianEmpirical Rule (68, 95, 99.7) when it appliesChebyshev's Theorem, you will be given the <strong>for</strong>mula 1-1/k 2 what does it mean?What a Q-Q plot is <strong>for</strong> and how to use it.Percentiles (what they mean, not how to calculate)Interquartile RangeWhat a box plot says about the shape of a distribution and how it relates to the quartiles.That you can only remove outliers if they are clearly an error. You can do the analysis both with and withoutthe outliers though if they concern you.
ProbabilitySample PointSample SpaceEventP(A ∪ B) = P(A) + P(B) – P(A ∩ B)P(A ∩ B) = P(A)P(B|A)how to use theseMutually ExclusiveIndependentComplementConditional ProbabilityFactorialsBinomial Coefficienttheir definitions, and how they affect the multiplicativeand additive rulewhat they are, how they are usedwhat its uses are and its <strong>for</strong>mulaDiscrete Random VariablesRandom VariableDiscrete Random VariableContinuous Random VariableDiscrete Probability DistributionMean (of a discrete random variable)Expected Value (of a discrete random variable)Variance (of a discrete random variable)Standard Deviation (of a discrete random variable)if given the <strong>for</strong>mula, how to calculatethese, and what they tell usabout the variableRecognize when something follows a binomial distribution, know what the parameters mean, and how andwhen we would use them. Recognize the <strong>for</strong>mulas <strong>for</strong> the mean and variance of a binomial distribution.Continuous Random VariablesContinuous Probability DistributionNormal DistributionStandard NormalChanging a Normal to a Standard Normalyou need to remember z = (x - μ)/σKnow that probability is area <strong>for</strong> continuous random variables. Be able to use a normal table to calculateprobabilities <strong>for</strong> a Normal random variable.Using the normal distribution to approximate a binomial random variable (including the continuity correction)