1995 Financial Report - CGIAR Library
1995 Financial Report - CGIAR Library
1995 Financial Report - CGIAR Library
- No tags were found...

Create successful ePaper yourself
Turn your PDF publications into a flip-book with our unique Google optimized e-Paper software.
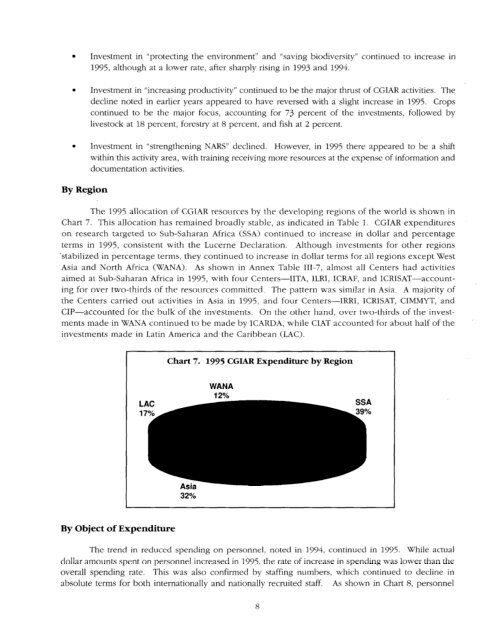
l Investment in “protecting the environment” and “saving biodiversity” continued to increase in<strong>1995</strong>, although at a lower rate, after sharply rising in 1993 and 1994.. Investment in “increasing productivity” continued to be the major thrust of <strong>CGIAR</strong> activities. Thedecline noted in earlier years appeared to have reversed with a slight increase in <strong>1995</strong>. Cropscontinued to be the major focus, accounting for 73 percent of the investments, followed bylivestock at 18 percent, forestry at 8 percent, and fish at 2 percent.. Investment in “strengthening NARS” declined. However, in <strong>1995</strong> there appeared to be a shiftwithin this activity area, with training receiving more resources at the expense of information anddocumentation activities.By RegionThe <strong>1995</strong> allocation of <strong>CGIAR</strong> resources by the developing regions of the world is shown inChart 7. This allocation has remained broadly stable, as indicated in Table 1. <strong>CGIAR</strong> expenditureson research targeted to Sub-Saharan Africa (SSA) continued to increase in dollar and percentageterms in <strong>1995</strong>, consistent with the Lucerne Declaration. Although investments for other regions‘stabilized in percentage terms, they continued to increase in dollar terms for all regions except WestAsia and North Africa (WANA). As shown in Annex Table 111-7, almost all Centers had activitiesaimed at Sub-Saharan Africa in <strong>1995</strong>, with four Centers-IITA, ILRI, ICRAF, and ICRISAT-accountingfor over two-thirds of the resources committed. The pattern was similar in Asia. A majority ofthe Centers carried out activities in Asia in <strong>1995</strong>, and four Centers-IRRI, ICRISAT, CIMMYT, andCIP-accounted for the bulk of the investments. On the other hand, over two-thirds of the investmentsmade in WANA continued to be made by ICARDA, while CIAT accounted for about half of theinvestments made in Latin America and the Caribbean (LAC).Chart 7. <strong>1995</strong> <strong>CGIAR</strong> Expenditureby RegionWANAAsla32%By Objectof ExpenditureThe trend in reduced spending on personnel, noted in 1994, continued in <strong>1995</strong>. While actualdollar amounts spent on personnel increased in <strong>1995</strong>, the rate of increase in spending was lower than theoverall spending rate. This was also confirmed by staffing numbers, which continued to decline inabsolute terms for both internationally and nationally recruited staff. As shown in Chart 8, personnel8