Water and Sanitation in Tanzania - Poverty Monitoring
Water and Sanitation in Tanzania - Poverty Monitoring
Water and Sanitation in Tanzania - Poverty Monitoring

You also want an ePaper? Increase the reach of your titles
YUMPU automatically turns print PDFs into web optimized ePapers that Google loves.
ForewordBAKARI A. MAHIZAPERMANENT SECRETARYMINISTRY OF WATER AND LIVESTOCKDEVELOPMENT<strong>Tanzania</strong>’s <strong>Poverty</strong> Reduction Strategy Paper (PRSP) recognizes, elim<strong>in</strong>at<strong>in</strong>gpoverty will not be done without provid<strong>in</strong>g every person with access to safedr<strong>in</strong>k<strong>in</strong>g water.In 2001 <strong>Tanzania</strong> developed a <strong>Poverty</strong> Monitor<strong>in</strong>g System to coord<strong>in</strong>ate thegather<strong>in</strong>g of evidence on the welfare of poor people. Sources for this evidence<strong>in</strong>clude national surveys, the census, rout<strong>in</strong>e data collected by m<strong>in</strong>istries <strong>and</strong>local government as well as specific pieces of research <strong>and</strong> analysis.Over the past year the M<strong>in</strong>istry of <strong>Water</strong> <strong>and</strong> Livestock Development hasbeen work<strong>in</strong>g with <strong>Water</strong>Aid, the Eastern Africa Statistical Tra<strong>in</strong><strong>in</strong>g Center<strong>and</strong> the National Bureau of Statistics on this study look<strong>in</strong>g at povertymonitor<strong>in</strong>g <strong>in</strong> the water <strong>and</strong> sanitation sector.The study, supported by the Department for International Development(DFID), evolved out of a water <strong>and</strong> sanitation stakeholders’ workshop, held <strong>in</strong>September 2001, which reviewed the <strong>in</strong>dicators <strong>and</strong> highlighted gaps <strong>in</strong> both thelist of <strong>in</strong>dicators <strong>and</strong> <strong>in</strong> the data collection systems designed to measure the<strong>in</strong>dicators. The poverty monitor<strong>in</strong>g study that emerged was guided by anAdvisory Team with representation from MoWLD, MoH, UNICEF, UCLAS,NETWAS, NBS, ESTAC, REPOA <strong>and</strong> Concern Worldwide.The study evaluates water <strong>and</strong> sanitation <strong>in</strong>dicators used by rout<strong>in</strong>e <strong>and</strong>survey data collections systems <strong>in</strong> <strong>Tanzania</strong> <strong>and</strong> exam<strong>in</strong>es the way <strong>in</strong> which dataon water <strong>and</strong> sanitation is recorded <strong>and</strong> collated. It also reports on trendsderived from exist<strong>in</strong>g <strong>in</strong>dicators <strong>and</strong> from those trends reflects on the utility of<strong>in</strong>dicators used. F<strong>in</strong>ally the report recommends changes to <strong>in</strong>dicators for bothrout<strong>in</strong>e data collection <strong>and</strong> national surveys.The f<strong>in</strong>d<strong>in</strong>gs were shared at the technical level at a workshop held at thePlann<strong>in</strong>g Commission on the 22nd of May 2002. The presentation was shared <strong>and</strong>discussed by staff from PO-PP, VPO, MoWLD Directors, the National Bureauof statistics, the Local Government Reform Programme, ESRF, REPOA, Bankof <strong>Tanzania</strong>, DFID, JICA, UNDP, Netherl<strong>and</strong>s International Cooperation(DGIS), Concern Worldwide <strong>and</strong> WATSANET.Cont<strong>in</strong>ued collaboration will be key to ensur<strong>in</strong>g that the necessarymodifications are consolidated <strong>in</strong> the relevant national surveys <strong>and</strong> that thequality <strong>and</strong> consistency of water <strong>and</strong> sanitation data is improved. In turn thiswill be a significant step towards strengthen<strong>in</strong>g <strong>Tanzania</strong>’s poverty monitor<strong>in</strong>gsystem <strong>and</strong> our efforts to eradicate poverty.Bakari A. MahizaPermanent SecretaryM<strong>in</strong>istry of <strong>Water</strong> <strong>and</strong> Livestock Development
AcknowledgementsThis study was a collaborative project for the water <strong>and</strong> sanitation sector led bythe M<strong>in</strong>istry of <strong>Water</strong> <strong>and</strong> Livestock Development, <strong>Water</strong>Aid - <strong>Tanzania</strong> withEastern Africa Statistical Tra<strong>in</strong><strong>in</strong>g Centre <strong>and</strong> National Bureau of Statistics.This report was written by Jenni Marshall, <strong>Water</strong>Aid-<strong>Tanzania</strong> with Dr ZakyaoMsokwa EASTC <strong>and</strong> Mr Felix Ngamlagosi, MoWLD. Mrs Naomi Lupimo ofMoWLD contributed significantly to earlier stages of the work. Mr Said Aboud<strong>and</strong> the HBS team from the National Bureau of Statistics also assisted. Theanalysis was carried out with <strong>in</strong>put from Advisory Team (as above plus MrsMary Swai, M<strong>in</strong>istry of Health; Mrs Rebecca Budimu, UNICEF; Eng RichardEvans, Concern Worldwide; Professor Kironde, UCLAS, with <strong>in</strong>put fromNETWAS <strong>and</strong> WATSANET). The study also benefited from conceptual supportfrom Alana Albee, Senior Social Development Adviser DFIDEA(T) <strong>and</strong> theResearch <strong>and</strong> Analysis Work<strong>in</strong>g Group of the <strong>Poverty</strong> Monitor<strong>in</strong>g System.© 2002 MoWLD, <strong>Water</strong>Aid, EASTC <strong>and</strong> NBS, <strong>Tanzania</strong>
Contents91.0 INTRODUCTION TO POVERTY MONITORING FOR WATER AND SANITATION1.1 <strong>Water</strong>, <strong>Sanitation</strong> <strong>and</strong> <strong>Poverty</strong> <strong>in</strong> <strong>Tanzania</strong>1.2 <strong>Water</strong> <strong>and</strong> <strong>Sanitation</strong> <strong>in</strong> <strong>Tanzania</strong>: Monitor<strong>in</strong>g for <strong>in</strong>formed poverty eradication strategies1.3 <strong>Water</strong> <strong>and</strong> <strong>Sanitation</strong> <strong>in</strong> <strong>Tanzania</strong>: <strong>Poverty</strong> Monitor<strong>in</strong>g Indicators1.4 <strong>Water</strong> <strong>and</strong> <strong>Sanitation</strong> <strong>in</strong> <strong>Tanzania</strong>: the study objectives112.0 DATA SOURCES AND THEIR COMPARABILITY2.1 National household surveys used2.1.1 Household Budget Survey 1991 <strong>and</strong> 2000/12.1.2 Demographic <strong>and</strong> Health Surveys <strong>in</strong> the 1990s2.1.3 Population Census 1978 <strong>and</strong> 19882.1.4 Surveys referenced but not <strong>in</strong>cluded <strong>in</strong> the analysis2.2 Comparability <strong>and</strong> consistency of surveys2.2.1 Compar<strong>in</strong>g sample designs2.2.2 Consistency of data sets collected through surveys2.2.3 Comparability of questions <strong>and</strong> response options2.3 Other data sources for reference2.4 Quantitative data analysis - po<strong>in</strong>ts to remember173.0 WATER IN TANZANIA3.1 Longer-term trends <strong>in</strong> dr<strong>in</strong>k<strong>in</strong>g water source use - for rural <strong>and</strong> urban areas3.1.1 Use of piped water for dr<strong>in</strong>k<strong>in</strong>g 1978 to 20013.1.2 Use of well water for dr<strong>in</strong>k<strong>in</strong>g 1978 to 20013.1.3 Use of surface water for dr<strong>in</strong>k<strong>in</strong>g 1978 to 20013.2 Use of improved water sources as an estimation of access to safe water3.2.1 What do we mean by access to safe water?3.2.2 Measur<strong>in</strong>g the PRSP <strong>in</strong>dicator: Improved water source use <strong>in</strong> <strong>Tanzania</strong> <strong>in</strong> 2000/13.2.3 Use of improved water sources for dr<strong>in</strong>k<strong>in</strong>g by rural, urban <strong>and</strong> Dar based households3.3 Distance <strong>and</strong> time to water source3.3.1 (Not) measur<strong>in</strong>g the policy target - estimat<strong>in</strong>g distance3.3.2 Trends <strong>in</strong> distance to water <strong>in</strong> the dry season3.3.2 Trends <strong>in</strong> time taken to fetch water3.4 Regional differences <strong>in</strong> use of <strong>and</strong> distance to water sources3.4.1 Regional differences <strong>in</strong> use of improved water sources3.4.2 Regional differences <strong>in</strong> time to water sources <strong>in</strong> the dry season324.0 SANITATION IN TANZANIA4.1 Use of toilets <strong>in</strong> <strong>Tanzania</strong>345.0 WATER, SANITATION, GENDER AND INCOME POVERTY5.1 Gender <strong>and</strong> water <strong>and</strong> sanitation <strong>in</strong> the surveys5.1.1 What participatory research tells us5.1.2 Female headed households <strong>and</strong> piped water5.1.3 Female headed households <strong>and</strong> use of surface water5.1.4 Female-headed households <strong>and</strong> use of improved water5.2 <strong>Water</strong> <strong>in</strong> <strong>Tanzania</strong> <strong>and</strong> basic needs poverty
5.2.1 Basic needs poverty5.2.2 Basic needs poverty <strong>and</strong> use of improved (piped <strong>and</strong> protected) water sources5.2.3 <strong>Poverty</strong> qu<strong>in</strong>tiles <strong>and</strong> use of improved water sources5.2.4 Poorer households <strong>and</strong> their distance to water5.2.5 Regional patterns: access to water <strong>and</strong> basic needs poverty5.3 <strong>Water</strong> <strong>and</strong> education456.0 SOME POLICY IMPLICATIONS OF THE FINDINGS6.1 <strong>Water</strong> <strong>and</strong> sanitation as priority sector for poverty reduction6.1.1 The state of water <strong>and</strong> sanitation <strong>in</strong> <strong>Tanzania</strong>6.1.2 Prioritis<strong>in</strong>g the sector6.2 <strong>Water</strong> <strong>and</strong> sanitation targets for poverty reduction6.2.1 Geographical <strong>in</strong>equalities <strong>in</strong> water <strong>and</strong> sanitation6.2.2 Dar es Salaam: pro poor plann<strong>in</strong>g?6.2.3 Pro-poor targets for the PRS?6.3 Quality data <strong>and</strong> <strong>in</strong>formation for <strong>Poverty</strong> Monitor<strong>in</strong>g6.3.1 Data quality <strong>and</strong> consistency6.3.2 Which data source to use?477.0 POVERTY MONITORING FOR THE SECTOR:RECOMMENDED MODIFICATIONS BASED ON THE SURVEY RESULTS7.1 Mak<strong>in</strong>g recommendations7.2 The recommendations7.3 Indicators for <strong>in</strong>form<strong>in</strong>g poverty eradication strategies - whose access?7.4 Tak<strong>in</strong>g it forward: possible research priorities7.4.1 Surveys <strong>and</strong> census7.4.2 Rout<strong>in</strong>e Data Systems7.4.3 Qualitative research7.4.4 Tak<strong>in</strong>g on the challenges as a coalition56REFERENCES59DATASETS60APPENDICIES
Executive Summary<strong>Tanzania</strong>’s <strong>Poverty</strong> Reduction Strategy Paper (PRSP) recognizes that theeradication of poverty will not be achieved without provid<strong>in</strong>g every person withaccess to safe dr<strong>in</strong>k<strong>in</strong>g water.In 2001 <strong>Tanzania</strong> developed a <strong>Poverty</strong> Monitor<strong>in</strong>g System to coord<strong>in</strong>ate thegather<strong>in</strong>g of evidence on the welfare of poor people, <strong>in</strong>clud<strong>in</strong>g their access tosafe water <strong>and</strong> sanitation. Sources for this evidence <strong>in</strong>clude national surveys, thecensus, rout<strong>in</strong>e data collected by m<strong>in</strong>istries <strong>and</strong> local government as well asspecific pieces of research <strong>and</strong> analysis.This study reviews water <strong>and</strong> sanitation <strong>in</strong>dicators used by national surveys<strong>in</strong> <strong>Tanzania</strong>. It exam<strong>in</strong>es the way <strong>in</strong> which data on water <strong>and</strong> sanitation isrecorded <strong>and</strong> collated. The study reports on trends derived from exist<strong>in</strong>g<strong>in</strong>dicators <strong>and</strong> from those trends reflects on the usefulness of exist<strong>in</strong>g <strong>in</strong>dicators.F<strong>in</strong>ally the report recommends changes to <strong>in</strong>dicators for use with nationalsurveys.“The study reports ontrends derived fromexist<strong>in</strong>g <strong>in</strong>dicators <strong>and</strong>from those trendsreflects on theusefulness of exist<strong>in</strong>g<strong>in</strong>dicators. “Compar<strong>in</strong>g surveys for analysisAnalysis of water <strong>and</strong> sanitation data collected by national surveys was carriedout us<strong>in</strong>g the Household Budget Survey (HBS), the Demographic <strong>and</strong> HealthSurvey (DHS) <strong>and</strong> the Population <strong>and</strong> Hous<strong>in</strong>g Census. Each of these studiesgives national figures <strong>and</strong> can be disaggregated by rural <strong>and</strong> urban areas. TheHBS 2001 sample allows greater disaggregation, <strong>in</strong>clud<strong>in</strong>g disaggregation atregional level.Word<strong>in</strong>g of the <strong>in</strong>dicators for water <strong>and</strong> sanitation makes comparison acrossall three surveys limited. However, where the word<strong>in</strong>g of questions wassufficiently clear <strong>and</strong> consistent - such as for ‘percentage of households us<strong>in</strong>gpiped water’ - this study demonstrates that the results of the three surveys canbe compared.Measur<strong>in</strong>g Safe <strong>Water</strong> <strong>and</strong> Effective <strong>Sanitation</strong>The def<strong>in</strong>ition of safe water used <strong>in</strong> the PRSP <strong>in</strong>dicator ‘Proportion ofhouseholds with access to safe dr<strong>in</strong>k<strong>in</strong>g water (<strong>in</strong> rural <strong>and</strong> urban areas)’ is notdirectly measured by any of the surveys. Some surveys do however measure useof improved sources, which is a commonly accepted proxy for safe watersources. In addition to piped water, improved sources <strong>in</strong>clude wells or spr<strong>in</strong>gsthat have been protected by enclos<strong>in</strong>g the source to prevent contam<strong>in</strong>ation byrun-off water. Use of improved sources has been recorded by the HBS s<strong>in</strong>ce1991 <strong>and</strong> by the DHS s<strong>in</strong>ce 1999.<strong>Sanitation</strong> data is not comparable across the three surveys. The DHSrecords ownership while the HBS records use of toilet facilities. Both surveysrecord questionably high percentages, above 90% for most regions. In additionthe response options for toilet facilities are confus<strong>in</strong>g - the term VIP (ventilatedimproved pit) be<strong>in</strong>g too specific <strong>and</strong> the term ‘pit latr<strong>in</strong>e’ be<strong>in</strong>g too broad.Notably there are no survey data on sewage systems.Trends <strong>in</strong> use of water sourcesLong-term trends for dr<strong>in</strong>k<strong>in</strong>g water sources were analysed for piped water,well water <strong>and</strong> surface water. As sources of well water <strong>in</strong>clude both protected(improved) <strong>and</strong> unprotected wells it is not possible to assess long-term trends ofaccess to safe water.Trends over the period 1978 to 2000 do not reveal significant changes <strong>in</strong> thepercentage of households served by piped or well water. However, thepopulation has grown from 17 million <strong>in</strong> 1978 to around 32 million <strong>in</strong> 2000 so theabsolute number of households served has nearly doubled.Rural-urban disparity throughout the period is very large. Households us<strong>in</strong>gpiped supplies <strong>in</strong> urban areas be<strong>in</strong>g around 80% compared to rural areas withpiped supplies <strong>in</strong> the 20-25% range for the same period.<strong>Water</strong> <strong>and</strong> <strong>Sanitation</strong> <strong>in</strong> <strong>Tanzania</strong> 20025
In rural areas the percentage of households us<strong>in</strong>g surface water (dams, lakes,ponds, rivers <strong>and</strong> streams) has dropped from just under 30% <strong>in</strong> 1991 to around17% <strong>in</strong> 2000. This is positive as surface water sources are associated with higherhealth risks than other sources.For a more detailed analysis of the proportion of households with access tosafe water this study focused on the 1991 <strong>and</strong> 2000 Household Budget Surveys.In l<strong>in</strong>e with the def<strong>in</strong>itions used for the Millennium Development Goals thisstudy analyses improved sources as a proxy for safe sources. The analysis for‘use of improved water sources’ was broken down <strong>in</strong>to three parts; rural areas,Dar es Salaam <strong>and</strong> urban centers other than Dar es Salaam.In rural areas the proportion of households us<strong>in</strong>g improved sources (piped<strong>and</strong> protected) rose by 11%. This is contributed to by a comb<strong>in</strong>ed rise <strong>in</strong> the useof piped sources (up 3%) <strong>and</strong> protected wells <strong>and</strong> spr<strong>in</strong>gs (up 8%).In Dar es Salaam the proportion of households us<strong>in</strong>g piped water dropped byjust over 7%. This drop <strong>in</strong> use of piped water has been compensated for by a shiftto protected sources (up 4%) as well as small shifts to unprotected sources (up2%), tankers <strong>and</strong> vendors.There was little change <strong>in</strong> urban areas other than Dar es Salaam with only asmall rise <strong>in</strong> the proportion households us<strong>in</strong>g improved sources (up 4%).Trends <strong>in</strong> accessDistance <strong>and</strong> time to water source give a partial <strong>in</strong>dication of the burden ofdomestic water management felt by women <strong>and</strong> children <strong>in</strong> <strong>Tanzania</strong> <strong>and</strong> is an<strong>in</strong>dication of time that could be spent on more productive <strong>and</strong> social activities.Surveys are not consistent <strong>in</strong> their measurement of time <strong>and</strong> distance towater <strong>and</strong> none of them measure the National <strong>Water</strong> Policy target of ‘with<strong>in</strong> 400meters’. This study, however, recommends ‘time to fetch water’ as a more useful<strong>in</strong>dicator than ‘distance to water source’.The <strong>in</strong>dicator ‘time to fetch water’ <strong>in</strong>cludes go<strong>in</strong>g to the water source,wait<strong>in</strong>g, collect<strong>in</strong>g water <strong>and</strong> return<strong>in</strong>g home. The Demographic <strong>and</strong> HealthSurvey, illustrates the change <strong>in</strong> ‘time to fetch water’ over the 1990s. In urbanareas there has been a 14% drop <strong>in</strong> the proportion of urban households tak<strong>in</strong>gless than 30 m<strong>in</strong>utes to fetch water. This is particularly significant given that theHBS reported that the ‘proportion of urban households with access to waterwith<strong>in</strong> less than one kilometer’ actually rose by 3%. So ‘time to fetch water’ is abetter <strong>in</strong>dicator of the chang<strong>in</strong>g dem<strong>and</strong> or stress that manag<strong>in</strong>g water puts on,particularly, women.Regional variation <strong>in</strong> use of improved water sourcesRegional differences <strong>in</strong> the use of water sources can be compared us<strong>in</strong>g the HBSdata sets. There is a clear pattern between the ‘proportions of households withimproved water sources’ <strong>and</strong> Government/donor funded water supplyprogrammes. Though this is reveal<strong>in</strong>g, <strong>in</strong>tra-regional differences are hidden asHBS data can only be disaggregated to the regional level. As districts are thepr<strong>in</strong>cipal agencies for implement<strong>in</strong>g development activities, surveys wouldideally collect sufficient data to enable analysis by district. Though the cost ofdo<strong>in</strong>g this for national surveys may be prohibitively expensive the ref<strong>in</strong>ementsto 2002 Census water <strong>in</strong>dicators should enable analysis of protected <strong>and</strong>unprotected sources by district.The HBS also records high regional disparities <strong>in</strong> household water use fromprotected sources <strong>in</strong> rural areas, L<strong>in</strong>di 11% as compared to Kilimanjaro 74%.These figures differ considerably from the M<strong>in</strong>istry of <strong>Water</strong> <strong>and</strong> LivestockDevelopment’s rout<strong>in</strong>e data figures for the same year (L<strong>in</strong>di 34% <strong>and</strong>Kilimanjaro 48%). Two factors may contribute to this. First, that rout<strong>in</strong>e data iscollected on the basis of population coverage rather than households. Second,that the HBS data is based on samples whereas rout<strong>in</strong>e data is collated fromregion wide adm<strong>in</strong>istrative sources. These differences emphasise the need tomake sources clear when quot<strong>in</strong>g national statistics.“Surveys are notconsistent <strong>in</strong> theirmeasurement oftime <strong>and</strong> distance towater <strong>and</strong> none ofthem measure theNational <strong>Water</strong> Policytarget of ‘with<strong>in</strong> 400meters’.”Gender <strong>and</strong> waterFemale headed households - as recorded by the HBS - were 7% more likely to beus<strong>in</strong>g piped water than male headed households. Surface water use by female6 <strong>Water</strong> <strong>and</strong> <strong>Sanitation</strong> <strong>in</strong> <strong>Tanzania</strong> 2002
“The fact that thisanalysis relies soheavily on the datacollected by the HBSis evidence that dataquality <strong>and</strong>consistency acrossnational surveysneeds to beimproved.”headed households was also 5% lower than that for male headed households.This suggests that women headed households tend to choose protected watersources <strong>and</strong>/or prioritise water with<strong>in</strong> the household budget. This an area forfurther research.Education <strong>and</strong> waterSchool aged children liv<strong>in</strong>g with<strong>in</strong> 15 m<strong>in</strong>utes of their dr<strong>in</strong>k<strong>in</strong>g water sourcewere 12% more likely to be attend<strong>in</strong>g school than children liv<strong>in</strong>g over one hourfrom their source of dr<strong>in</strong>k<strong>in</strong>g water.<strong>Poverty</strong> <strong>and</strong> waterThe basic needs poverty l<strong>in</strong>e (derived from expenditure data), developed by theNational Bureau of Statistics, is used by this study to look at differential accessfor households above <strong>and</strong> below the poverty l<strong>in</strong>e <strong>in</strong> the year 2000.Though poverty was greater <strong>in</strong> rural areas, <strong>in</strong>equality was greater <strong>in</strong> urbanareas. In rural areas 51% of households above the poverty l<strong>in</strong>e were us<strong>in</strong>gunprotected sources compared to 57% of households below the poverty l<strong>in</strong>e; arelatively small difference. In contrast, though only 12% of urban householdswere us<strong>in</strong>g unprotected sources, those households were twice as likely to bebelow the poverty l<strong>in</strong>e. In Dar es Salaam this <strong>in</strong>equality is even greater. Thoughonly 7% of households were recorded as us<strong>in</strong>g unprotected sources thesehouseholds were six times more likely to be those below the poverty l<strong>in</strong>e.Summary of recommendationsThe HBS recorded that 46% of rural households <strong>in</strong> the year 2000 were us<strong>in</strong>gwater from improved sources (up 11% from 1991). In urban areas the surveyrecords that 88% of households were us<strong>in</strong>g water from improved sources.However, <strong>in</strong> Dar es Salaam access to improved water sources had dropped by3% s<strong>in</strong>ce 1991. In addition the DHS recorded that urban households able to fetchwater <strong>in</strong> under 30 m<strong>in</strong>utes has dropped by 14% to 64% over the same period.The fact that this analysis relies so heavily on the data collected by the HBSis evidence that data quality <strong>and</strong> consistency across national surveys needs to beimproved. In order to improve consistency <strong>and</strong> comparability this studyrecommends a number of modifications to national surveys data collection. Ofthese, the five key recommendations are:1. differentiate between protected <strong>and</strong> unprotected water sources so thataccess to improved water sources can be measured.2. adopt the <strong>in</strong>dicator ‘time taken to fetch water’3. reth<strong>in</strong>k questions to capture the reality of the sanitation situation <strong>in</strong><strong>Tanzania</strong> e.g. ownership does not necessarily mean use of toilet facilities4. ensure that improved water <strong>and</strong> sanitation data is collected by the census<strong>and</strong> is analysed at the level of district5. ensure comparable formats of questions on water <strong>and</strong> sanitation issuesacross surveys <strong>and</strong> censuses<strong>Water</strong> <strong>and</strong> <strong>Sanitation</strong> <strong>in</strong> <strong>Tanzania</strong> 20027
AcronymsCWIQDANIDADAWASADFIDDHSDPP-MoWLDEasEASTCESRFGTZHBSHIPCJICAKfWLGRPMoHMoWLDNBSO&MOPMLPMSPRSPRSPPWMIREPOARWSDTASTCRSTSEDUCLASUNDPUNICEFURoTVIPWAWAMMACore Welfare Indicator QuestionnairesDanish International Development AgencyDar es Salaam <strong>Water</strong> <strong>and</strong> Sewerage AuthorityDepartment for International DevelopmentDemographic <strong>and</strong> Health SurveyDirectorate of Policy <strong>and</strong> Plann<strong>in</strong>g - M<strong>in</strong>istry of <strong>Water</strong> <strong>and</strong> Livestock DevelopmentEnumeration AreasEastern Africa Statistical Tra<strong>in</strong><strong>in</strong>g CentreEconomic <strong>and</strong> Social Research FoundationDeutsche Gesellschaft fur Technische ZusammenarbeitHousehold Budget SurveyHighly Indebted Poor CountryJapan International Cooperation AgencyKreditanstalt fur WiederaufbauLocal Government Reform ProgrammeM<strong>in</strong>istry of HealthM<strong>in</strong>istry of <strong>Water</strong> <strong>and</strong> Livestock DevelopmentNational Bureau of StatisticsOperation <strong>and</strong> Ma<strong>in</strong>tenanceOxford Policy Management Limited<strong>Poverty</strong> Monitor<strong>in</strong>g System<strong>Poverty</strong> Reduction Strategy<strong>Poverty</strong> Reduction Strategy Paper<strong>Poverty</strong> <strong>and</strong> Welfare Monitor<strong>in</strong>g IndicatorsResearch on <strong>Poverty</strong> AlleviationRural <strong>Water</strong> Supply Database<strong>Tanzania</strong> Assistance Strategy<strong>Tanzania</strong> Christian Refugee Services<strong>Tanzania</strong> Socioeconomic DatabaseUniversity College of L<strong>and</strong>s, Architectural SciencesUnited Nations Development ProgrammeUnited Nations Childrens FundUnited Republic of <strong>Tanzania</strong>Ventilated, Improved Pit<strong>Water</strong>AidWafadhili Maji, Maendeleo ya Jamii na Afya8 <strong>Water</strong> <strong>and</strong> <strong>Sanitation</strong> <strong>in</strong> <strong>Tanzania</strong> 2002
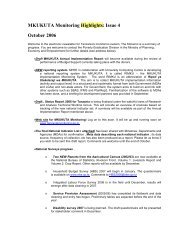
Introduction to poverty monitor<strong>in</strong>g forwater <strong>and</strong> sanitation1.01.1 <strong>Water</strong>, <strong>Sanitation</strong> <strong>and</strong> <strong>Poverty</strong> <strong>in</strong> <strong>Tanzania</strong>All of those <strong>in</strong>volved <strong>in</strong> the water <strong>and</strong> sanitation sector know from experiencethat improvements <strong>in</strong> access to clean <strong>and</strong> safe water supplies <strong>and</strong> goodsanitation have extensive <strong>and</strong> multi-dimensional impacts on people’s lives. Asimpact studies have shown, better access to water <strong>and</strong> sanitation leads toimprovements <strong>in</strong>, for example: girls, boys, women <strong>and</strong> men’s health <strong>and</strong> hygiene;rural <strong>and</strong> urban livelihoods; children’s attendance at school; people’s, especiallywomen’s, psychological wellbe<strong>in</strong>g <strong>and</strong> social <strong>in</strong>teraction (<strong>Water</strong>Aid, 2000;Narayan, 1997; MoWLD, 2002).As <strong>Tanzania</strong>’s <strong>Poverty</strong> Reduction Strategy Paper (PRSP) recognises, wecannot achieve the goals of poverty reduction <strong>and</strong> ultimately povertyelim<strong>in</strong>ation without provid<strong>in</strong>g every person with access to safe dr<strong>in</strong>k<strong>in</strong>g water(URoT, 2000). This access should be susta<strong>in</strong>able <strong>and</strong> to an improved source, thatis reliable all year round (adapted from the Millennium Development Goalssigned up to by <strong>Tanzania</strong> <strong>in</strong> 2000). To meet the aim of universal access, the watersector has been identified as a priority sector for the poverty reductionstrategies <strong>and</strong> budgets. The <strong>Poverty</strong> Monitor<strong>in</strong>g System monitors whether suchaims are be<strong>in</strong>g reached.1.2 <strong>Water</strong> <strong>and</strong> <strong>Sanitation</strong> <strong>in</strong> <strong>Tanzania</strong>:Monitor<strong>in</strong>g for <strong>in</strong>formed poverty eradication strategiesFigure 1.2.1. <strong>Water</strong> <strong>and</strong> <strong>Sanitation</strong> data<strong>and</strong> <strong>in</strong>formation collection, analysis <strong>and</strong>dissem<strong>in</strong>ation through the PMSThe <strong>Poverty</strong> Monitor<strong>in</strong>g System (PMS) was developed <strong>in</strong> 2001 to “ensure theavailability of timely <strong>and</strong> reliable evidence on poverty” <strong>in</strong> <strong>Tanzania</strong> (URoT,2001b). This evidence is required to determ<strong>in</strong>e whether activities implementedunder the National <strong>Poverty</strong> Eradication Strategy (URoT, 1997), <strong>Tanzania</strong>Assistance Strategy (TAS) (draft, 2001) <strong>and</strong> PRSP (URoT, 2000, URoT 2001a)are really improv<strong>in</strong>g the welfare of poor people <strong>in</strong> the country.The system advances a co-ord<strong>in</strong>ated national-level approach to data <strong>and</strong><strong>in</strong>formation collection, analysis <strong>and</strong> communication that focuses on the fourareas shown <strong>in</strong> figure 1.2.1 below. <strong>Water</strong> <strong>and</strong> sanitation data <strong>and</strong> <strong>in</strong>formation istherefore collected by surveys <strong>and</strong> census, through rout<strong>in</strong>e or adm<strong>in</strong>istrativesystems <strong>and</strong> through commissioned pieces of research/analysis (see Tsikata <strong>and</strong>Mbil<strong>in</strong>yi, 2001 for overview of priorities for research). Improvements to thewater <strong>and</strong> sanitation rout<strong>in</strong>e data systems (see appendix 1.2.1 for a diagram of<strong>in</strong>formation flow) are, however, still be<strong>in</strong>g developed. Partly for this reason, <strong>and</strong>because surveys are an important data collection method, we focus on<strong>in</strong>formation ga<strong>in</strong>ed from surveys <strong>and</strong> census.Rout<strong>in</strong>e Data SystemsMoWLD - eg RWSDMoH - eg MTUHALocal Government Monitor<strong>in</strong>g DatabaseResearch <strong>and</strong> AnalysisParticipatory <strong>Poverty</strong> AssessmenstOther qualitative <strong>and</strong> community based researchSurveys <strong>and</strong> CensusHousehold Budget SurveyDemographic <strong>and</strong> Health SurveysCensusDissem<strong>in</strong>ationSensitisation <strong>and</strong>Advocacy<strong>Water</strong> <strong>and</strong> <strong>Sanitation</strong> <strong>in</strong> <strong>Tanzania</strong> 20029
BOX 1.3.1 Indicators for <strong>in</strong>form<strong>in</strong>g the <strong>Poverty</strong> Reduction/Eradication Strategies<strong>Poverty</strong> Reduction Strategy Paper• Population with access to safe water (for rural <strong>and</strong> urban)<strong>Poverty</strong> <strong>and</strong> Welfare Monitor<strong>in</strong>g Indicators• Percentage of households with access to adequate amount of safe dr<strong>in</strong>k<strong>in</strong>g water with<strong>in</strong> 400m• Percentage of households with access to adequate supplies of water with<strong>in</strong> 400m• Percentage of households with (i) toilet facility (ii) access to toilet facility• Percentage of urban households with access to garbage disposal facilities• Percentage of urban households with (i)access to sewage systems (ii) cesspool empty<strong>in</strong>g (iii) access to (waste)disposal facility (suggested)• Percentage of population contribut<strong>in</strong>g to water services1.3 <strong>Water</strong> <strong>and</strong> <strong>Sanitation</strong> <strong>in</strong> <strong>Tanzania</strong>:<strong>Poverty</strong> Monitor<strong>in</strong>g IndicatorsThe Vice President’s Office <strong>Poverty</strong> <strong>and</strong> Welfare Monitor<strong>in</strong>g Indicators (URoT1999) were developed to monitor the National <strong>Poverty</strong> Eradication Strategy.The PRSP has one water <strong>in</strong>dicator <strong>in</strong> its list of core <strong>in</strong>dicators for the sector(URoT, 2000, URoT 2001a). See box 1.3.1. Other monitor<strong>in</strong>g systems <strong>and</strong>strategies conta<strong>in</strong> variations of these ma<strong>in</strong> <strong>in</strong>dicators.A water <strong>and</strong> sanitation stakeholders’ workshop was held <strong>in</strong> September2001 reviewed the <strong>in</strong>dicators <strong>and</strong> highlighted gaps <strong>in</strong> both the list of <strong>in</strong>dicators<strong>and</strong> <strong>in</strong> the data collection systems designed to measure the <strong>in</strong>dicators. Appendix1.3.1 details the f<strong>in</strong>d<strong>in</strong>gs. The plans for this study of national surveys evolvedfrom the September meet<strong>in</strong>g.1.4 <strong>Water</strong> <strong>and</strong> <strong>Sanitation</strong> <strong>in</strong> <strong>Tanzania</strong>: the study objectivesThis study was designed to <strong>in</strong>form <strong>Tanzania</strong>’s <strong>Poverty</strong> Reduction Strategy. Itexplores the changes <strong>in</strong> people’s access to water <strong>and</strong> sanitation <strong>in</strong> ma<strong>in</strong>l<strong>and</strong><strong>Tanzania</strong> <strong>and</strong> relationships between water <strong>and</strong> poverty. Due to access <strong>and</strong> thentechnical problems with some of the data, the depth of the analysis is limited <strong>in</strong>some aspects.The study brought together key national level stakeholders work<strong>in</strong>g <strong>in</strong> thewater <strong>and</strong> sanitation sector <strong>in</strong>clud<strong>in</strong>g ones with strong l<strong>in</strong>ks to District <strong>and</strong>community based stakeholders. The collaborative work was led by theDepartment of Policy <strong>and</strong> Plann<strong>in</strong>g from the M<strong>in</strong>istry of <strong>Water</strong> <strong>and</strong>Livestock Development (MoWLD) <strong>and</strong> <strong>Water</strong>Aid-<strong>Tanzania</strong> with astatistician contracted from EASTC. Other partners <strong>in</strong> the work <strong>in</strong>cluded:Government <strong>and</strong> UN• MoWLD (Departments of Rural<strong>Water</strong> Supply <strong>and</strong> <strong>Water</strong>Resources)• M<strong>in</strong>istry of Health (Departmentof Preventative Services)• UNICEF, UNDP, DFIDNGOs with water <strong>and</strong> sanitationfocus/programmes• Concern Worldwide• WATSANET• NETWASResearch organisations/ agencies• Eastern Africa StatisticalTra<strong>in</strong><strong>in</strong>g Centre (EASTC)• National Bureau of Statistics(NBS)• UCLAS• REPOAOther poverty monitor<strong>in</strong>gactors• Local Government ReformProgramme• TSED10 <strong>Water</strong> <strong>and</strong> <strong>Sanitation</strong> <strong>in</strong> <strong>Tanzania</strong> 2002
Data sources <strong>and</strong> their comparability 2.02.1 National household surveys usedSee appendix 2.1.1 for details of the surveys <strong>and</strong> their relevant variables.2.1.1 Household Budget Survey 1991 <strong>and</strong> 2000/1The Household Budget Surveys (HBS) collect data on key socio-economiccharacteristics of household members, household liv<strong>in</strong>g conditions, householdeconomic activity, <strong>in</strong>come <strong>and</strong> expenditure. The HBS has been carried out <strong>in</strong> 1969,1976/7, 1991 <strong>and</strong> 2000/1. It is planned for 2006 <strong>and</strong> 2011 (URoT 2001b). This studyonly used the 1991 <strong>and</strong> 2000/1 surveys for the follow<strong>in</strong>g reasons:• The raw data was only available <strong>in</strong> a readable format for 1991 <strong>and</strong> 2000/1surveys (see NBS <strong>and</strong> OPML, 2000 for details);• Complete sets of reports <strong>and</strong> questionnaires could not be located foreither the 1969 <strong>and</strong> 1976/7 surveys that detailed the methodology <strong>and</strong>sample weight<strong>in</strong>g used;• The questions <strong>and</strong> response options for water <strong>and</strong> sanitation used <strong>in</strong> theolder surveys are not comparable with the later surveys.Raw data sets for both the 1991 <strong>and</strong> 2000/1 surveys were obta<strong>in</strong>ed from theNational Bureau of Statistics. Both data sets used were those re-cleaned <strong>and</strong> reweightedfor the poverty analysis <strong>in</strong> 2002, rectify<strong>in</strong>g oversampl<strong>in</strong>g of certa<strong>in</strong>(particularly urban areas) <strong>and</strong> compensat<strong>in</strong>g for those areas not covered when thesample size was reduced mid-way through the HBS 2000.For water <strong>and</strong> sanitation, the key variables for the study are:• Ma<strong>in</strong> dr<strong>in</strong>k<strong>in</strong>g water supply for household• Toilet facilities used by household• Garbage disposal methods used by household• Distance (<strong>and</strong> time for 2000/1) to dr<strong>in</strong>k<strong>in</strong>g water source <strong>in</strong> the dry season• Expenditure on water2.1.2 Demographic <strong>and</strong> Health Surveys <strong>in</strong> the 1990sThe Demographic <strong>and</strong> Health Surveys (DHS) collect data on key health issuessuch as family plann<strong>in</strong>g, <strong>in</strong>fant <strong>and</strong> child mortality, maternal <strong>and</strong> child health <strong>and</strong>nutrition <strong>and</strong> HIV/AIDS <strong>in</strong> <strong>Tanzania</strong> (<strong>in</strong>clud<strong>in</strong>g Zanzibar). The surveys werecarried out <strong>in</strong> 1992, 1994, 1996 <strong>and</strong> 1999 <strong>and</strong> are planned for 2004 <strong>and</strong> 2009 (URoT2001b). This study uses <strong>in</strong>formation from the household surveys from all foursurveys carried out <strong>in</strong> the 1990s <strong>and</strong> data from the women’s survey for the DHS1996. Raw data sets for all surveys were obta<strong>in</strong>ed from Macro International(www.measuredhs.com) although the National Bureau of Statistics also holdthem. All of the data sets used were weighted us<strong>in</strong>g the appropriate weightsconta<strong>in</strong>ed <strong>in</strong> the surveys to rectify over-sampl<strong>in</strong>g of certa<strong>in</strong> areas, as directed byMacro International.Zanzibar figures have been removed for 1996 <strong>and</strong> 1999; the 1994 survey wasma<strong>in</strong>l<strong>and</strong> only <strong>and</strong> 1992 the regions are classified <strong>in</strong> zones mak<strong>in</strong>g it impossible toremove the isl<strong>and</strong>s. It should be noted that the effect of <strong>in</strong>clud<strong>in</strong>g Zanzibar <strong>in</strong> thesample for 1992 is likely to be small; <strong>in</strong> 1996 the percentage of households us<strong>in</strong>gpiped water <strong>in</strong> the sample <strong>in</strong>clud<strong>in</strong>g Zanzibar was 0.8% higher than the sample not<strong>in</strong>clud<strong>in</strong>g Zanzibar.For water <strong>and</strong> sanitation, the key variables for the study are:• Ma<strong>in</strong> dr<strong>in</strong>k<strong>in</strong>g water supply for members of the household• Toilet facilities the household has• Time taken to go to ma<strong>in</strong> dr<strong>in</strong>k<strong>in</strong>g water source, to collect water <strong>and</strong> return• Incidence of diarrhoea for <strong>in</strong>fants (past 2 weeks)<strong>Water</strong> <strong>and</strong> <strong>Sanitation</strong> <strong>in</strong> <strong>Tanzania</strong> 200211
2.1.3 Population Census 1978 <strong>and</strong> 1988The Population Census (Census) collects basic demographic data for all people <strong>in</strong><strong>Tanzania</strong> <strong>and</strong> more detailed population data plus <strong>in</strong>formation on hous<strong>in</strong>g conditionsfor a sample (about 1/4 of households). The census <strong>in</strong>formation used <strong>in</strong> the study isfrom those carried out <strong>in</strong> 1978 <strong>and</strong> 1988. The Population <strong>and</strong> Hous<strong>in</strong>g Census 2002is currently underway <strong>and</strong> the next is planned for 2012 (URoT 2001b). Onlyreports were used for the Census <strong>in</strong>formation although the vast data sets areaccessible through the NBS. The reports were sufficient for a rural <strong>and</strong> urbantrend analysis <strong>and</strong> the questions used prevented any useful more detailed analysis.For water <strong>and</strong> sanitation, the key variables are:• dr<strong>in</strong>k<strong>in</strong>g water source used <strong>and</strong>• toilet facilities owned2.1.4 Surveys referenced but not <strong>in</strong>cluded <strong>in</strong> the analysisThe Labour Force Survey (eg 2000/1) does not, <strong>in</strong> its current state, give<strong>in</strong>formation on water <strong>and</strong> sanitation. The Agricultural Surveys were not <strong>in</strong>cluded.CWIQ (Core Welfare Indicator Questionnaires) were referred to for <strong>in</strong>dicatordevelopment but no data was <strong>in</strong>cluded <strong>in</strong> the analysis as the survey’s methods arenot comparable <strong>and</strong> they are not national level surveys. Other surveys carried outby research <strong>in</strong>stitutions were also not <strong>in</strong>cluded for a range of reasons, primarilybecause the comparability of the ma<strong>in</strong> national surveys carried out by the NBSprovided enough challenges!2.2 Comparability <strong>and</strong> consistency of surveys2.2.1 Compar<strong>in</strong>g sample designsRefer to table 2.2.1 over the page, summarised below to compare the surveys used:• Coverage <strong>and</strong> estimates possible. The study must be ma<strong>in</strong>l<strong>and</strong> only <strong>in</strong>order for all surveys to be <strong>in</strong>cluded (remember<strong>in</strong>g DHS 1992 has to <strong>in</strong>clude Zanzibar).There is a huge range <strong>in</strong> survey sample size but all surveys give national (ma<strong>in</strong>l<strong>and</strong>)<strong>and</strong> rural/urban estimates. Only the HBS allows Dar to be analysed separately.• Sample designs <strong>and</strong> weights. Sample designs are different for the differentsurveys. The DHS are based on Census enumeration areas. The HBS are based onthe National Master Sample orig<strong>in</strong>ally based on agro-economic zones <strong>and</strong> created <strong>in</strong>1988. The DHS <strong>and</strong> HBS are both weighted (though us<strong>in</strong>g different weight<strong>in</strong>gsystems) to rectify over-sampl<strong>in</strong>g of urban areas <strong>and</strong> some regions. The weight<strong>in</strong>g<strong>and</strong> re-weight<strong>in</strong>g of data has a significant effect on the figures. For example,percentage of households us<strong>in</strong>g piped water <strong>in</strong> 1991 as recorded by the HBS isreported to be:- 57.4% <strong>in</strong> the HBS 1991/2 report data tables (URoT, 1994b) (known to beun-weighted valid percentages although the report does not specify this)- 40.1% <strong>in</strong> basel<strong>in</strong>e development work (NBS <strong>and</strong> OPML, 2000) (withorig<strong>in</strong>al weight<strong>in</strong>g which did not sufficiently allow for rural-urbanproportions of the population)- 35.9% (re-weighted valid percentages used for HBS 2000/1 analysis <strong>and</strong>used for this study)• Errors. Sampl<strong>in</strong>g errors are estimated to be low although water <strong>and</strong>sanitation variables are not <strong>in</strong>cluded <strong>in</strong> the estimation of sampl<strong>in</strong>g errors carried outfor the surveys (see United Republic of <strong>Tanzania</strong>, 1993; Bureau of Statistics <strong>and</strong>Macro International, 1997; National Bureau of Statistics <strong>and</strong> Macro InternationalInc., 2000; NBS <strong>and</strong> OPML, 2000). In all surveys, households <strong>in</strong> rural enumerationareas or survey clusters have reta<strong>in</strong>ed their rural status (rather than ga<strong>in</strong><strong>in</strong>g periurbanor urban status) despite the expansion of urban areas <strong>in</strong>to the countryside.This type of sample error is by nature more evident <strong>in</strong> the more recent surveys thanthose close to the 1988 Census. Similar non-sampl<strong>in</strong>g errors (for example, failure tolocate <strong>and</strong> <strong>in</strong>terview the correct household, misunderst<strong>and</strong><strong>in</strong>gs of the questions - bythe <strong>in</strong>terviewer or respondent - <strong>and</strong> data entry errors) are likely for all surveys, areimpossible to avoid <strong>and</strong> difficult to evaluate statistically (Bureau of Statistics <strong>and</strong>Macro International, 1997).12 <strong>Water</strong> <strong>and</strong> <strong>Sanitation</strong> <strong>in</strong> <strong>Tanzania</strong> 2002
TABLE 2.2.1. Compar<strong>in</strong>g survey sample size <strong>and</strong> designSURVEY SAMPLE SIZE COVERAGE AND SAMPLE DESIGN(households)DISAGGREGATION POSSIBLECensus 1978 3,555,000 National 2 stage sampl<strong>in</strong>g:(ma<strong>in</strong>l<strong>and</strong> <strong>and</strong> Zanzibar) 1) Enumeration AreasTotal/rural/urbansystematically r<strong>and</strong>omly sampled<strong>in</strong> each region. 2) Eas divided <strong>in</strong>toclusters on basis of number ofhouseholds & population(max 600 pple)Census 1988 4,420,000 National S<strong>in</strong>gle stage sampl<strong>in</strong>g(ma<strong>in</strong>l<strong>and</strong> <strong>and</strong> Zanzibar) Pre survey enumeration- mapp<strong>in</strong>gTotal/rural/urbanhouseholds to give EAs . ThoseRegionalsurveyed selected based onsystematic equal probabilitysampl<strong>in</strong>gHBS 1991/2 4924 re-cleaned Ma<strong>in</strong>l<strong>and</strong> only National Master SampleMarch 2002. 4,290,332 Total/rural/Dar/other urban of 222 E A s (100 rural, 122 urban)re-weighted Mar 02 Disaggregation by demographic<strong>and</strong> poverty related variablespossibleHBS 2000/1 22,189 re-cleaned Ma<strong>in</strong>l<strong>and</strong> only Based on National Master SampleMar 02, 6,453,755 Total/rural/Dar/other urban but budget cuts reduced numberre-weighted Mar 02 Regional of households sampled, esp rural(average 1109 hhlds each) (7627 rural, 14551 urban)Disaggregation by demographic<strong>and</strong> poverty related variablespossibleDHS 1991/2 8327 hhlds (weighted) National Census enumeration areas(Ma<strong>in</strong>l<strong>and</strong> <strong>and</strong> Zanzibar)Urban/ruralDHS 1994 4023 hhlds (weighted) Ma<strong>in</strong>l<strong>and</strong> only Census 88 enumeration areasDHS 1996 7740 hhlds (weighted) National Census 88 enumeration areas8120 women (15-49) (ma<strong>in</strong>l<strong>and</strong> <strong>and</strong> Zanzibar)Rural, urban(for hhlds/women/men)DHS 1999 3615 hhlds (weighted) National Census 88 enumeration areas(ma<strong>in</strong>l<strong>and</strong> <strong>and</strong> Zanzibar)Total/rural/urbanNOTE: Sampl<strong>in</strong>g Error was not calculated us<strong>in</strong>g water <strong>and</strong> sanitation variables <strong>in</strong> any of the surveys.St<strong>and</strong>ard Error is not possible to estimate for the survey data used, prevent<strong>in</strong>g any plott<strong>in</strong>g of confidence <strong>in</strong>tervals fordata po<strong>in</strong>ts.<strong>Water</strong> <strong>and</strong> <strong>Sanitation</strong> <strong>in</strong> <strong>Tanzania</strong> 200213
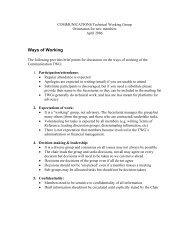
FIGURE 2.2.2. Percentage of Households us<strong>in</strong>g piped water as their ma<strong>in</strong> dr<strong>in</strong>k<strong>in</strong>g source over time45.0% of households40.035.030.025.020.022373136343536 373915.010.05.0HBS 1977HBS 1978197919801981198219831984198519861987CENSUS 198819891990HBS 1991/2DHS 19921993DHS 19941995DHS 199619971998DHS 1999HBS 20002.2.2 Consistency of data sets collected through surveysThe graph <strong>in</strong> Figure 2.2.2 above takes households us<strong>in</strong>g piped water to check thecomparability of surveys through the consistency of the data obta<strong>in</strong>ed. Use of apiped source was used as it is easier for a respondent to identify a pipe/tapsource compared to identify<strong>in</strong>g a well or surface source which sometimes getconfused (see below). The graph highlights the different figures ga<strong>in</strong>ed from thedifferent surveys <strong>and</strong>, <strong>in</strong> particular, the reason for dropp<strong>in</strong>g the HBS 1976-7from the study (see reasons given above for this difference). The other figuresare generally consistent although the differences between the HBS 1991/2 <strong>and</strong>DHS 1991/2 <strong>and</strong> the DHS 1999 <strong>and</strong> HBS 2000/1 <strong>in</strong>dicate that only general trendsshould be read from the graphs; percentage changes from one survey to the nextshould not be quoted.2.2.3 Comparability of questions <strong>and</strong> response optionsThe table <strong>in</strong> appendix 2.2.3 relates the questions <strong>and</strong> response options of thema<strong>in</strong> surveys to the ma<strong>in</strong> <strong>in</strong>dicators for water <strong>and</strong> environmental sanitation (as<strong>in</strong> Box 1.3.1 plus others that ARE measurable). It shows the lack ofcomparability of surveys <strong>in</strong> terms of the questions that they ask <strong>and</strong> theresponse options allowed. For example:• Different response options for types of water source used are given <strong>in</strong> eachof the surveys - some focus on ownership of water po<strong>in</strong>ts, some on protection.Some of these are likely to be confused by respondents, for example ‘private’ownership - is this a tap or well owned by a household or one controlled by aprivate company/<strong>in</strong>dividual sell<strong>in</strong>g water?• HBS records distance <strong>and</strong> time to dr<strong>in</strong>k<strong>in</strong>g water source <strong>in</strong> the dry season;DHS records time to fetch water from the ma<strong>in</strong> dr<strong>in</strong>k<strong>in</strong>g source• DHS measures the ownership of toilet facilities, HBS the use of facilitiesRelat<strong>in</strong>g the questions <strong>and</strong> response options to <strong>in</strong>dicators for the sectordemonstrates that:• Population with access to safe water (for rural <strong>and</strong> urban) is onlymeasured by the HBS <strong>and</strong> DHS 1999, <strong>and</strong> then only if this is taken to be use ofimproved water sources.• Percentage of households with access to water with<strong>in</strong> 400m is notmeasured by any survey14 <strong>Water</strong> <strong>and</strong> <strong>Sanitation</strong> <strong>in</strong> <strong>Tanzania</strong> 2002
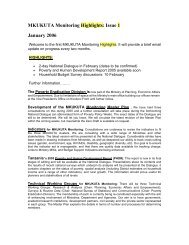
IMPLICATIONS FOR STUDY• The only classification possible for anytrend analysis us<strong>in</strong>g more than one type ofsurvey is: piped water, wells, spr<strong>in</strong>gs,ra<strong>in</strong>water, surface sources <strong>and</strong> other(unspecified or those rema<strong>in</strong><strong>in</strong>g).• Only those <strong>in</strong>dicators <strong>in</strong> Box 2.2.3 canbe measured <strong>and</strong> the study heavily relies onthe HBS data sets as these record improvedwater sources.• We need to ensure consistency withpast surveys when recommend<strong>in</strong>gmodifications for the future.• The HBS response options for garbage disposal facilities do not provideuseful <strong>in</strong>formation. No survey gives data on use of sewerage systems• Misclassifications with<strong>in</strong> the NBS dur<strong>in</strong>g data entry mean that the water<strong>and</strong> hygiene expenditure data has been miscoded <strong>and</strong> these <strong>in</strong>dicators are notmeasurable. Entries <strong>in</strong> the HBS expenditure diaries for purchases from watervendors, for example, were classified as ‘bottled dr<strong>in</strong>ks, fruit juices <strong>and</strong> icecream’!S<strong>in</strong>ce the late 1990s, there has been a noticeable effort with<strong>in</strong> the NationalBureau of Statistics to make their survey questions more comparable (see DHS1999, HBS 2000/1, forthcom<strong>in</strong>g Census 2002). This is a positive move but itshould be noted that chang<strong>in</strong>g the response options for a questionnaire can haveserious implications for data consistency. The graph <strong>in</strong> Figure 2.2.3 below showsthe effect of chang<strong>in</strong>g the response options offered to those tak<strong>in</strong>g part <strong>in</strong> thedemographic <strong>and</strong> health surveys 1996 <strong>and</strong> 1999. In 1999 the well water optionswere altered to water from open or unprotected well AND water from coveredwell or borehole (<strong>in</strong> 1996 they were well <strong>in</strong> residence/yard/plot ANDpublic/private well). An open, unprotected well that is dug <strong>in</strong>to a river bed orperceived to be more of a hole <strong>in</strong> the ground rather than a public or private wellwas likely to have been classified as a surface source <strong>in</strong> 1996 but reclassified tothe well category <strong>in</strong> 1999.FIGURE 2.2.3. Change <strong>in</strong> the percentage of households us<strong>in</strong>g piped, well <strong>and</strong> surface sources for dr<strong>in</strong>k<strong>in</strong>g water from 1992 to1999 (DHS 1992-99)45.040.035.038WELL% of households30.025.020.030242923292215.010.05.013SURFACE SOURCEHBS 1992 (91/2)1993DHS 19941995DHS 199619971998DHS 1999<strong>Water</strong> <strong>and</strong> <strong>Sanitation</strong> <strong>in</strong> <strong>Tanzania</strong> 200215
BOX 2.2.3 Basic <strong>in</strong>dicators possible to use <strong>in</strong> analysis✔✔✔✔✔✔✔✔✔✔✔✔✔Percentage of households us<strong>in</strong>g different dr<strong>in</strong>k<strong>in</strong>g water sources as ma<strong>in</strong> source classified <strong>in</strong>to: piped, wells,spr<strong>in</strong>gs, surface sources, ra<strong>in</strong>water, unspecified othersPercentage of households us<strong>in</strong>g improved dr<strong>in</strong>k<strong>in</strong>g water source as ma<strong>in</strong> source (commonly used as measure of‘access to safe water’, <strong>in</strong>clud<strong>in</strong>g piped water, protected wells <strong>and</strong> covered spr<strong>in</strong>gs)Households with piped water <strong>in</strong>to the home (house or plot)Percentage of households liv<strong>in</strong>g with<strong>in</strong> 1km of a dr<strong>in</strong>k<strong>in</strong>g water supply <strong>in</strong> the dry seasonAverage distance to water supplyPercentage of households liv<strong>in</strong>g with<strong>in</strong> x number of m<strong>in</strong>utes from dr<strong>in</strong>k<strong>in</strong>g water supply <strong>in</strong> the dry seasonPercentage of households tak<strong>in</strong>g x number of m<strong>in</strong>utes to reach the source, collect water <strong>and</strong> return homeAverage time spent fetch<strong>in</strong>g waterPercentage of households us<strong>in</strong>g different toilet facilities (flush, latr<strong>in</strong>es, ‘other’ facilities)Percentage of households not us<strong>in</strong>g toilet facilitiesPercentage of households dispos<strong>in</strong>g of rubbish by throw<strong>in</strong>g it outside or by putt<strong>in</strong>g it <strong>in</strong> a pit or b<strong>in</strong>Household expenditure on water (only estimate possible due to mis-classification of water vendors)Percentage of members of households surveys suffer<strong>in</strong>g from diarrhoea <strong>in</strong> 4 weeks prior to survey.2.3 Other data sources for referenceAlthough the study focuses on data from the ma<strong>in</strong> national surveys <strong>and</strong> census,some other qualitative <strong>and</strong> quantitative research <strong>and</strong> monitor<strong>in</strong>g <strong>in</strong>formationwas <strong>in</strong>cluded:• Rout<strong>in</strong>e/adm<strong>in</strong>istrative data generated by the M<strong>in</strong>istry of <strong>Water</strong><strong>and</strong> Livestock Development. Official coverage figures for population withaccess to water from a water scheme used by the Department of Policy <strong>and</strong>Plann<strong>in</strong>g were obta<strong>in</strong>ed from the annual budget speeches given <strong>in</strong> Parliament bythe M<strong>in</strong>ister (Jamhuri ya Muungana wa <strong>Tanzania</strong>, 1986, 1988, 1992, 1996, 1998,2000, 2001; URoT, 1987). These are used to compare survey <strong>and</strong> rout<strong>in</strong>e figures.• Participatory <strong>Poverty</strong> Assessment (Narayan, 1997) <strong>and</strong> Look<strong>in</strong>gBack (<strong>Water</strong>Aid, 2000). Both participatory assessments generated<strong>in</strong>formation on water <strong>and</strong> sanitation <strong>and</strong> poverty <strong>in</strong> <strong>Tanzania</strong> that providedvaluable <strong>in</strong>sights <strong>in</strong>to some of the trends.2.4 Quantitative data analysis - po<strong>in</strong>ts to rememberThe strengths <strong>and</strong> weaknesses of survey-based approaches have been reviewedby many <strong>in</strong>clud<strong>in</strong>g Calvalho <strong>and</strong> White, 1997 (<strong>in</strong> Appleton <strong>and</strong> Booth, 2001).Surveys provide data that can be aggregated <strong>and</strong> the reliability of results can bemeasured. However, quantitative <strong>in</strong>formation should always be taken as<strong>in</strong>dicative not truth-reveal<strong>in</strong>g. This is because:• errors are <strong>in</strong>evitable <strong>in</strong> survey design, implementation <strong>and</strong> analysis,particularly <strong>in</strong> a country the size of <strong>Tanzania</strong>;• surveys miss what is not easily quantifiable;• household surveys fail to capture <strong>in</strong>tra-household allocation.The regional level disaggregation possible with the HBS also fails to capture<strong>in</strong>tra-regional, <strong>in</strong>tra-District, <strong>in</strong>tra-ward <strong>and</strong> <strong>in</strong>tra-village/street differences.Therefore, this study aims to highlight broad trends, to reveal areas for furtherexploration with qualitative research <strong>and</strong> to draw recommendations forimprov<strong>in</strong>g the way surveys capture water <strong>and</strong> sanitation data <strong>and</strong> <strong>in</strong>formation.16 <strong>Water</strong> <strong>and</strong> <strong>Sanitation</strong> <strong>in</strong> <strong>Tanzania</strong> 2002
<strong>Water</strong> <strong>in</strong> <strong>Tanzania</strong> 3.03.1 Longer-term trends <strong>in</strong> dr<strong>in</strong>k<strong>in</strong>g water source use - for rural<strong>and</strong> urban areasThe ma<strong>in</strong> trend analyses that it is possible to carry out over the differentsurveys from 1978 to 2001 (see table 3.1) are:• Households us<strong>in</strong>g piped water as the ma<strong>in</strong> source for dr<strong>in</strong>k<strong>in</strong>g 1978 to 2001• Households us<strong>in</strong>g well water as the ma<strong>in</strong> source for dr<strong>in</strong>k<strong>in</strong>g 1978 to 2001• Households us<strong>in</strong>g surface water sources as the ma<strong>in</strong> source for dr<strong>in</strong>k<strong>in</strong>g1991-2001Households us<strong>in</strong>g ra<strong>in</strong>water <strong>and</strong> spr<strong>in</strong>gs are also possible to record. Howeverthe use of ra<strong>in</strong>water as a ma<strong>in</strong> dr<strong>in</strong>k<strong>in</strong>g water source is very low (0.0-0.3%).Spr<strong>in</strong>gs will be referred to <strong>in</strong> section 3.1.2.TABLE 3.1. Percentage of households us<strong>in</strong>g piped, well, ra<strong>in</strong>, spr<strong>in</strong>g, surface <strong>and</strong> other dr<strong>in</strong>k<strong>in</strong>g water sources 1978-2000/1PIPEDWELLRAINSPRINGSURFACEOTHERTOTALRURALURBAN TOTALRURALURBAN TOTALRURALURBAN TOTALRURALURBAN TOTALRURAL URBAN TOTALRURALURBAN TOTALRURAL URBAN TOTALCensus1978*27.788.037.246.48.440.4749678Census1988*18.579.231.560.517.551.3799783HBS199124.578.835.939.213.833.90.10.10.111.80.39.423.22.418.81.24.71.9100100100DHS1991/219.478.633.835.113.329.80.30.00.211.81.39.329.94.923.93.41.83.0100100100DHS199420.282.935.434.213.529.20.10.00.116.60.712.728.92.222.50.00.70.2100100100DHS199624.777.536.432.915.428.90.20.00.115.41.912.426.94.521.90.01.10.2100100100DHS199922.079.637.146.913.838.30.00.00.013.51.810.517.32.013.30.12.80.8100100100HBS2000/128.478.939.339.715.634.50.20.20.215.32.012.415.82.112.80.71.20.8100100100* Census 1978 <strong>and</strong> 1988 gives ony ‘piped’, ‘well’ <strong>and</strong> ‘other’ as optionsNOTE: us<strong>in</strong>g valid percentages. None of the surveys show significant ‘miss<strong>in</strong>g’ data for the source variables3.1.1 Use of piped water for dr<strong>in</strong>k<strong>in</strong>g 1978 to 2001The percentage of households us<strong>in</strong>g piped water supplies often gives an<strong>in</strong>dication of :• Those covered by larger scale water schemes <strong>and</strong> therefore the recipientsof large scale government or development assistance <strong>in</strong>vestment;• Those us<strong>in</strong>g an improved source which <strong>in</strong> some, particularly urban, areasis treated for improved water quality <strong>and</strong> often brought closer to people’shomes for easier access;• Those more likely to be pay<strong>in</strong>g for water (s<strong>in</strong>ce the new water policy<strong>in</strong>volves cost shar<strong>in</strong>g) as piped schemes, especially those distribut<strong>in</strong>gwater from deep bore holes with pump eng<strong>in</strong>es, have higher operation <strong>and</strong>ma<strong>in</strong>tenance costs.It should be noted that piped water alone does not show the percentage ofhouseholds access<strong>in</strong>g improved sources as protected wells <strong>and</strong> spr<strong>in</strong>gs are usedby many, especially rural, households.<strong>Water</strong> <strong>and</strong> <strong>Sanitation</strong> <strong>in</strong> <strong>Tanzania</strong> 200217
FIGURE 3.1.1. Change <strong>in</strong> percentage of households on <strong>Tanzania</strong>n Mail<strong>and</strong> us<strong>in</strong>g piped water for dr<strong>in</strong>k<strong>in</strong>g 1978-2001 by urban<strong>and</strong> rural10090.080.070.0888079 7983778079URBAN PIPED% of households60.050.040.030.020.039373636 3735313428 2825252219 2018TOTAL PIPEDRURAL PIPED10.0CENSUS 1978197919801981198219831984198519861987CENSUS 198819891990HBS 1991/2DHS 19921993DHS 19941995DHS 199619971998DHS 1999HBS 2000Refer to graph <strong>in</strong> figure 3.1.1. It shows:• The percentage of total households <strong>in</strong> ma<strong>in</strong>l<strong>and</strong> <strong>Tanzania</strong> us<strong>in</strong>g pipedwater for dr<strong>in</strong>k<strong>in</strong>g as their ma<strong>in</strong> source fell through the 1980s but hasrisen aga<strong>in</strong> slightly through the 1990s (HBS 1991 to 2000/1 shows a 3%<strong>in</strong>crease). This rise through the 1990s was slight but steady - thefluctuations are as likely to be due to survey sample design as they are tobe due to changes <strong>in</strong> access.• This total households’ trend mirrors that of rural households due to<strong>Tanzania</strong>’s population be<strong>in</strong>g predom<strong>in</strong>antly rural. The urban trend,however, decl<strong>in</strong>es through the 1980s but rema<strong>in</strong>s more consistent throughthe 1990s rather than ris<strong>in</strong>g.The percentage figures for rural households do not show a different situation <strong>in</strong>2000/1 from 1978 (both 28%) (sources: HBS 2000/1 data <strong>and</strong> Census 1978 <strong>in</strong>URoT 1994a). The percentage of urban households us<strong>in</strong>g piped water <strong>in</strong> 2000/1appears to be lower than that <strong>in</strong> 1978. However, consider the population growthover this period. In 1978 the population of the ma<strong>in</strong>l<strong>and</strong> was around 17 million;<strong>in</strong> 2000 it was around 32 million (Bureau of Statistics, 1994; HBS 2000/1). Thismeans that <strong>in</strong> real terms more people <strong>and</strong> more households used piped supplynow than <strong>in</strong> 1978.• The rural-urban disparity is vast throughout the period covered. Compar<strong>in</strong>gthe disparity <strong>in</strong> 1978 <strong>and</strong> 2000/s shows that perhaps the gap has reduced but<strong>in</strong> rural areas <strong>in</strong> 2000/1, some 28% of households used piped water <strong>and</strong> <strong>in</strong>urban areas just under 80% used piped water (source: HBS 2000/1).WHY THE CHANGE?• Technical explanation: Many householdsclassified as rural may well be peri-urban orurban (with higher piped use). This is because,despite us<strong>in</strong>g advanced weight<strong>in</strong>g systems torectify sample design biases, the urban/ruralclassification of enumeration areas or clustersdoes not allow for all expansions of urbanareas.• Changes <strong>in</strong> <strong>in</strong>vestment <strong>and</strong> policy: In the1970s there was significant <strong>in</strong>vestment pipedschemes that gradually ceased to functiondur<strong>in</strong>g the 1980s (URoT, 1994a; DPP-MoWLDpers comm). In the 1990s a new National<strong>Water</strong> Policy that focused on improvedoperation, ma<strong>in</strong>tenance <strong>and</strong> management ofschemes was set <strong>and</strong> there has been<strong>in</strong>creased <strong>in</strong>vestment particularly <strong>in</strong> certa<strong>in</strong>geographical areas (DPP-MoWLD, pers comm;Jamhuri ya Muungana wa <strong>Tanzania</strong> 1986,1988, 1990, 2000).• Increas<strong>in</strong>g will<strong>in</strong>gness <strong>and</strong> ability topay: As many piped water schemes require apayment from the household either per bucketor on a monthly/annual basis, the <strong>in</strong>creaseduse of piped water could be the result of morehouseholds see<strong>in</strong>g the benefits (for health ortheir livelihood, for example) of us<strong>in</strong>g improvedrather than unprotected water sources <strong>and</strong>be<strong>in</strong>g more able to contribute f<strong>in</strong>ancially.18 <strong>Water</strong> <strong>and</strong> <strong>Sanitation</strong> <strong>in</strong> <strong>Tanzania</strong> 2002
FIGURE 3.1.2. Change <strong>in</strong> percentage of households us<strong>in</strong>g wells as a dr<strong>in</strong>k<strong>in</strong>g watersource <strong>in</strong> rural <strong>and</strong> urban areas of <strong>Tanzania</strong> ma<strong>in</strong>l<strong>and</strong> <strong>in</strong> (a) Census 1978-1988 <strong>and</strong> (b)HBS 1991-2000/170.060.060RURAL WELL% of households50.040.030.0464051TOTAL WELL20.018URBAN WELL10.080CENSUS 1978 CENSUS 198870.060.050.0% of households40.030.039344035RURAL WELLTOTAL WELL20.010.01416URBAN WELL0HBS 1991 HBS 2000WHY THE CHANGE IN WELL USE?It is difficult to draw out explanations <strong>in</strong>terms of <strong>in</strong>vestment <strong>in</strong> groundwaterdevelopment as there is no way of know<strong>in</strong>g<strong>in</strong> most of the surveys (especially Census)whether or not the sources have beenimproved. Households resort<strong>in</strong>g to wells fordr<strong>in</strong>k<strong>in</strong>g water as their piped waterschemes broke down <strong>in</strong> the 1980s isapparent (URoT, 1994a) but there does notappear to have been a shift back <strong>in</strong> the1990s. This could be because nosatisfactory alternative is available to thehouseholds.3.1.2 Use of well water for dr<strong>in</strong>k<strong>in</strong>g 1978 to 2001It is not possible to look at the longer-term trends <strong>in</strong> more detail than ‘use ofwells for dr<strong>in</strong>k<strong>in</strong>g water’. The trends <strong>in</strong> the data are affected by changes <strong>in</strong>survey questions <strong>in</strong> the DHS (see section 2.2.3) <strong>and</strong> by different responseoptions <strong>in</strong> the different surveys (the censuses ask about use of piped, wells orother whilst the other surveys are more specific about what the ‘other’ watersources are). For these reasons, the graphs <strong>in</strong> figures 3.1.2 (a) <strong>and</strong> (b) belowshow only Census <strong>and</strong> HBS trends <strong>and</strong> only the general trends should be notedas the percentages are not comparable. These graphs show:• The use of wells for dr<strong>in</strong>k<strong>in</strong>g water <strong>in</strong>creased through 1980s <strong>in</strong> rural <strong>and</strong>urban areas. (URoT, 1994a).• In the 1990s, there is little change evident <strong>in</strong> the percentage ofhouseholds us<strong>in</strong>g wells for dr<strong>in</strong>k<strong>in</strong>g water <strong>in</strong> both rural <strong>and</strong> urban areas.• Remember<strong>in</strong>g the <strong>in</strong>crease <strong>in</strong> population over the period studied, manymore people <strong>in</strong> <strong>Tanzania</strong> use well water for dr<strong>in</strong>k<strong>in</strong>g <strong>in</strong> 2000/1 than <strong>in</strong>1978.<strong>Water</strong> <strong>and</strong> <strong>Sanitation</strong> <strong>in</strong> <strong>Tanzania</strong> 200219
The percentage of households us<strong>in</strong>g spr<strong>in</strong>gs for dr<strong>in</strong>k<strong>in</strong>g fluctuates between 9.4-12.7% through the 1990s (see table 3.1) though the HBS shows a clearer <strong>in</strong>crease<strong>in</strong> their use. As with wells, perceptions of whether or not the source is a spr<strong>in</strong>g,well or pond differ.3.1.3 Use of surface water for dr<strong>in</strong>k<strong>in</strong>g 1978 to 2001Surface water sources (dams, lakes, ponds, rivers <strong>and</strong> streams) are generallyunprotected <strong>and</strong> often deemed to be ‘unsafe’ for dr<strong>in</strong>k<strong>in</strong>g, contam<strong>in</strong>ated byanimal, human <strong>and</strong> agricultural waste. Households us<strong>in</strong>g surface water sourcesmake up a large component of those us<strong>in</strong>g unprotected sources (the categorythat also <strong>in</strong>cludes unprotected wells <strong>and</strong> spr<strong>in</strong>gs, see section 3.2.1). Theexistence of surface water sources for use, however, depends on the area:semiarid zones are far more likely to have unprotected groundwater sourcesrather than surface ones.It is unfortunate that the Census questions do not provide data for surfacesource use from 1978 to 1988. Figures 3.1.3 (a) <strong>and</strong> (b) above show:• Between 1991 <strong>and</strong> 2001 there has been a reduction <strong>in</strong> the percentage ofhouseholds us<strong>in</strong>g surface water for dr<strong>in</strong>k<strong>in</strong>g, ma<strong>in</strong>ly <strong>in</strong> rural areaswhere more households use surface sources than <strong>in</strong> urban areas.• This trend is evident <strong>in</strong> both the DHS <strong>and</strong> the HBS. The DHS figures areaffected by question word<strong>in</strong>g but the change produced data moreconsistent with the HBS.FIGURE 3.1.3. Change <strong>in</strong> percentage of rural <strong>and</strong> urban households us<strong>in</strong>g surfacesources for dr<strong>in</strong>k<strong>in</strong>g water on <strong>Tanzania</strong> ma<strong>in</strong>l<strong>and</strong> 1991-2000 (a) DHS <strong>and</strong> (b) HBS.40.035.0% of households30.025.020.015.030 292423272217RURAL SURFACE10.013TOTAL SURFACE505242URBAN SURFACEDHS 91/2INCL. ZANZIBAR1992 1993 DHS 94 1995 DHS 96HH - SCHEDULE1997 1998 DHS 9940.035.0% of households30.025.020.015.010.023191613RURAL SURFACETOTAL SURFACE502 2URBAN SURFACEHBS 91/2 HBS 200020 <strong>Water</strong> <strong>and</strong> <strong>Sanitation</strong> <strong>in</strong> <strong>Tanzania</strong> 2002
FROM SURFACE TO PIPEDSOURCESIt is from surface to piped source use thatthe shift appears to have occurred <strong>in</strong> the1990s for possible reasons covered <strong>in</strong>section 3.1.1.It is clear that a more detailed study must focus on change over the 1990s <strong>and</strong>it must be accepted that it is necessary to rely on either the HBS or the DHS(depend<strong>in</strong>g on the <strong>in</strong>dicator be<strong>in</strong>g explored). It should be noted that <strong>in</strong> thefuture, given the move towards comparable surveys, a more <strong>in</strong>terest<strong>in</strong>g longertermanalysis should be able to be carried out.3.2 Use of improved water sources as an estimation ofaccess to safe water3.2.1 What do we mean by access to safe water?The <strong>in</strong>dicator ‘population with access to safe water’ is one of the core PRSP<strong>in</strong>dicators (URoT, 2001b). But what do we mean by safe? Ideally the waterquality of every water source <strong>in</strong> the country would be tested <strong>and</strong> recorded byDistrict level water <strong>and</strong> sanitation staff. The new national water policy <strong>and</strong> theplanned activities <strong>in</strong> the PRSP identify water quality monitor<strong>in</strong>g as a priority<strong>and</strong> databases are under construction that would store the <strong>in</strong>formation (egRural <strong>Water</strong> Supply Database). Given the issues of resources <strong>and</strong> capacity <strong>in</strong> acountry the size of <strong>Tanzania</strong>, measur<strong>in</strong>g quality is unlikely to be achieved on alarge scale for a long time. It could also be questioned whether this is a feasiblepriority for budgets aimed at poverty reduction, given the commonly acceptedpr<strong>in</strong>ciple that a larger quantity of water, rather than higher quality is likely tohave a bigger impact for people’s health (Cairncross <strong>and</strong> Feacham, 1988).In the absence of quality data, we need to take the commonly used approachof classify<strong>in</strong>g water sources <strong>in</strong>to ‘better’ <strong>and</strong> ‘worse’ for dr<strong>in</strong>k<strong>in</strong>g - at best onlyan estimation of relative safeness. Even then, there is no perfect classificationsystem. Pipes could be pip<strong>in</strong>g water from a contam<strong>in</strong>ated <strong>and</strong> untreated source.Deep boreholes <strong>and</strong> sealed shallow wells can both be polluted by nearby latr<strong>in</strong>esor sal<strong>in</strong>e water. Some open wells <strong>and</strong> surface water sources have clean waterwith very low faecal coliform counts. The suitability of ra<strong>in</strong>water for dr<strong>in</strong>k<strong>in</strong>gcan depend on air pollution levels as well as method of storage. A very generalclassification is sufficient, as, even if the water source is protected, treated <strong>and</strong>‘safe’ to dr<strong>in</strong>k, contam<strong>in</strong>ation of the water can still occur dur<strong>in</strong>g transportationor storage <strong>in</strong> the home. The general classification system outl<strong>in</strong>ed <strong>in</strong> the boxbelow was agreed upon with the Department of Policy <strong>and</strong> Plann<strong>in</strong>g <strong>and</strong> appliedfor the study (Mrs Naomi Lupimo, Mr Felix Ngamlagosi, Mr Shirima <strong>and</strong> MyNyenza, personal communication, Nov 2001-Mar 2002).WATER SOURCESImprovedPIPED• All piped water - <strong>in</strong>to the hous<strong>in</strong>gunit or plot, <strong>in</strong>to a neighbour’shouse, to a community st<strong>and</strong>post,to a privately-run water po<strong>in</strong>t.PROTECTED• Protected wells -boreholes/tubewells,medium/shallow wells withh<strong>and</strong>pumps• Covered spr<strong>in</strong>gsNot ImprovedUNPROTECTED• Unprotected wells• Uncovered spr<strong>in</strong>gs• Surface sources - dams, ponds <strong>and</strong>lakes, rivers <strong>and</strong> streamsOTHER(those not possible to classify)• Ra<strong>in</strong>water (as not recordedwhether stored <strong>in</strong> sealed or opentank)• Other unspecified sources (likelyto <strong>in</strong>clude tankers, water vendors,bottles which until recorded as aseparate category cannot beclassified.<strong>Water</strong> <strong>and</strong> <strong>Sanitation</strong> <strong>in</strong> <strong>Tanzania</strong> 200221
Interest<strong>in</strong>gly, the International Development Targets required monitor<strong>in</strong>g the“proportion of people who are unable to reach or afford safe dr<strong>in</strong>k<strong>in</strong>g water”[author’s own emphasis] (DFID, 2001). When the IDTs evolved <strong>in</strong>to MilleniumDevelopment Goals, the word<strong>in</strong>g changed to the:proportion of population with susta<strong>in</strong>able access to an improved source[author’s use of emphasis] (United Nations, 2001)These targets also provoke thought about what is meant by access. Access <strong>in</strong>volvesbe<strong>in</strong>g able to physically reach the source <strong>and</strong> be<strong>in</strong>g able to afford the water charges.It should be susta<strong>in</strong>able access - both f<strong>in</strong>ancially <strong>and</strong> <strong>in</strong> terms of the reliability of thesource yield. These concepts will be revisited <strong>in</strong> section 7.0’s recommendations formodify<strong>in</strong>g the <strong>in</strong>dicators. The important po<strong>in</strong>t here is that the national surveysmeasure access largely <strong>in</strong> terms of households’ USE of sources.In order to use the ma<strong>in</strong> national surveys to measure the PRSP core-<strong>in</strong>dicatorof ‘population with access to safe water’ we must use an estimation of households<strong>and</strong> of population us<strong>in</strong>g improved water sources (piped <strong>and</strong> protected).3.2.2 Measur<strong>in</strong>g the PRSP <strong>in</strong>dicator:Improved water source use <strong>in</strong> <strong>Tanzania</strong> <strong>in</strong> 2000/1Table 3.2.2 shows the total percentage of households us<strong>in</strong>g improved (piped plusprotected) water <strong>in</strong> 2000/1 was 55.5% (56%); 46% <strong>in</strong> rural areas <strong>and</strong> 88% <strong>in</strong> urban(source: HBS 2000/1). These are similar figures as those recorded by the DHS1999. The total ma<strong>in</strong>l<strong>and</strong> percentage has <strong>in</strong>creased by 10% from 46% <strong>in</strong> 1991.TABLE 3.2.2. Measur<strong>in</strong>g the PRSP <strong>in</strong>dicator over time19912000/2001HOUSEHOLDS % POPULATION % POP. ESTIMATE HOUSEHOLDS % POPULATION % POP. ESTIMATERural35--464611.8 milliomUrban (not Dar)84--88863.8 millionDar97--94931.7 millionTOTAL464310.5 million565417.3 millionSource: HBS 1991, 2000/1. Population calculations based on 1991 ma<strong>in</strong>l<strong>and</strong> population projected from Census 1988 figures us<strong>in</strong>g a growth rate of2.8% (Bureau of Statistics, 1994) <strong>and</strong> estimates for 2000 (personal communication with OPML <strong>and</strong> NBS, 2002).The percentages of population us<strong>in</strong>g improved sources do not differ greatly fromthe household percentages. See section 5 on household size <strong>and</strong> use of water. In2000/1, the percentage of the population us<strong>in</strong>g improved sources for dr<strong>in</strong>k<strong>in</strong>g <strong>in</strong>rural areas was 46% <strong>and</strong> <strong>in</strong> urban areas, 86%. This suggests that it cannot be saidwith confidence that many more larger households use unimproved sources thansmall - though <strong>in</strong> urban areas there is a slight suggestion <strong>in</strong> the figures that thisis the case.Note that the population figures for Dar es Salaam vastly underestimate thetotal population. The HBS suggests a total of around 1.9 million for Dar. Othersources quote 3 million as the population (eg Dar City Commission, 1999).These figures should be compared with the M<strong>in</strong>istry’s (<strong>in</strong>complete) set offigures announced <strong>in</strong> the budget speeches (see Appendix 3.2.2). In 2000 it wasreported that 50% of the rural population has access to clean water. In 1992, therural figures was 43%. In urban areas the figure <strong>in</strong> 2000 was estimated to be 68%ris<strong>in</strong>g to 70% by 2001 (Jamhuri ya Muungana wa <strong>Tanzania</strong>, 1991, 2000, 2001). Toobta<strong>in</strong> these figures, the MoWLD count the population of a village/streetcovered if a water scheme has been implemented there (be it a shallow well or apiped system with a number of tap-st<strong>and</strong>s). One might expect a household level22 <strong>Water</strong> <strong>and</strong> <strong>Sanitation</strong> <strong>in</strong> <strong>Tanzania</strong> 2002
survey to give far lower figures than the ‘one water po<strong>in</strong>t - all covered’ method- the reasons why this has not occurred need further exploration.3.2.3 Use of improved water sources for dr<strong>in</strong>k<strong>in</strong>g by rural, urban <strong>and</strong> Darbased householdsFigure 3.2.3 below shows the follow<strong>in</strong>g trends:• Use of improved water sources for dr<strong>in</strong>k<strong>in</strong>g has <strong>in</strong>creased for all areasexcept Dar es Salaam.• Rural areas show the greatest improvement between 1991 <strong>and</strong> 2000(source 1991 <strong>and</strong> 2000/1).• Urban areas (other than Dar es Salaam) show little improvement. The1991-2000 trend is affected by the 6% of households recorded as us<strong>in</strong>g‘other’ water sources <strong>in</strong> 1991 (this other figure is generally between 1 <strong>and</strong>3%)• Dar es Salaam residents use of water from improved sources (piped plusprotected) decl<strong>in</strong>ed. The percentage us<strong>in</strong>g improved sources decl<strong>in</strong>edfrom 97% to 94%. This decl<strong>in</strong>e is due to a decl<strong>in</strong>e <strong>in</strong> piped water use (93%<strong>in</strong> 1991 to 86% <strong>in</strong> 2000). People appear to have shifted water source usefrom the supply network to other types of sources.FIGURE 3.2.3. Change <strong>in</strong> use of piped protected, unprotected <strong>and</strong> other water sources for dr<strong>in</strong>k<strong>in</strong>g 1991– 2001from HBS10090.080.01%64%1%53%2%4%1%93%2%8%86%4%6%10%11%1%11%12%% of households70.060.050.040.018%73%76%30.020.010.010%25%28%OtherUnprotectedProtectedPiped1991 2000RURAL1991 2000 1991 2000DAR ES SALAAMOTHER URBAN<strong>Water</strong> <strong>and</strong> <strong>Sanitation</strong> <strong>in</strong> <strong>Tanzania</strong> 200223
REFLECTIONS ON THE TRENDSMany of the possible explanations for the trends are those given <strong>in</strong> section 3.1 on water source use, especially related to piped water: technical(sample-based) explanations, changes <strong>in</strong> <strong>in</strong>vestment <strong>and</strong> policy <strong>and</strong> possible <strong>in</strong>creased will<strong>in</strong>gness <strong>and</strong> ability to pay for improved services.However, analys<strong>in</strong>g the data us<strong>in</strong>g the piped <strong>and</strong> protected categories highlights the importance of not accept<strong>in</strong>g the trends for those us<strong>in</strong>g pipedwater as giv<strong>in</strong>g the whole picture of those us<strong>in</strong>g improved. In Dar for example, many households appear to have shifted from us<strong>in</strong>g piped waterto us<strong>in</strong>g both unprotected <strong>and</strong> protected other sources. This is likely to have been a result of the 1997 water supply emergency <strong>in</strong> Dar es Salaamdur<strong>in</strong>g which many boreholes were drilled.In rural areas, the percentage of households us<strong>in</strong>g protected sources accounts for most of the <strong>in</strong>crease <strong>in</strong> use of improved water sources (8% ofthe 11% <strong>in</strong>crease). This is partly expla<strong>in</strong>ed by the realisation by most sector players that <strong>in</strong>vestment <strong>in</strong> large scale, high ma<strong>in</strong>tenance schemes <strong>in</strong>rural areas is not susta<strong>in</strong>able. Instead many sector <strong>in</strong>vestors have turned to other solutions such as protected wells. The distance to water statistics<strong>in</strong> section 3.4 do not suggest that this move to po<strong>in</strong>t sources from piped distribution systems has led to people travel<strong>in</strong>g much longer distancesto water.Dar es SalaamThe importance of consider<strong>in</strong>g Dar separately from other urban areas is evident here. However, the figures for the city also provoke questions.<strong>Water</strong>Aid, Concern Worldwide <strong>and</strong> others <strong>in</strong> the Advisory Team have significant experience work<strong>in</strong>g with lower <strong>in</strong>come communities <strong>in</strong> Dar esSalaam. The reduction <strong>in</strong> piped water use is not surpris<strong>in</strong>g given the knowledge about the st<strong>and</strong>ard of the pipe network <strong>and</strong> the fact that DAWASAserves largely higher <strong>in</strong>come households <strong>and</strong> <strong>in</strong>dustry. What is surpris<strong>in</strong>g are the high percentages of households recorded to be us<strong>in</strong>g the pipedsystem <strong>in</strong> both years: recent <strong>Water</strong>Aid research <strong>in</strong> 3 wards of one Municipality (Temeke) estimates that only 30% of the residents use the pipedsystem. Note that the wards covered <strong>in</strong> this study all have low <strong>in</strong>come <strong>in</strong>formal settlements <strong>and</strong> that the percentage should be taken as aprelim<strong>in</strong>ary case study not a statistically representative sample. This is likely to be due <strong>in</strong> part to the rapid growth of the city over the last 10 years<strong>and</strong> the failure of the sampl<strong>in</strong>g to pick this up - section 3.2.2 <strong>in</strong>dicates that over 1 million people are miss<strong>in</strong>g from the statistics used.3.3 Distance <strong>and</strong> time to water sourceThe presence of a water source, improved or unimproved, is a poor measure ofwhether people actually have access to safe water, as the Participatory <strong>Poverty</strong>Assessment (1995) provides “dramatic evidence” to support. In addition, theHuman Resources Development Survey 1993 revealed that <strong>in</strong> two thirds ofvillages where poor households were us<strong>in</strong>g water from improved sources theystill mentioned lack of water as a major problem. Unfortunately the nationalsurveys analysed <strong>in</strong> this study do not tackle the acceptability <strong>and</strong> reliability ofsources. However, people will cite water, even from the most reliable <strong>and</strong> highquality source, as a problem if that source is located far from the home or if ittakes a long time to fetch the water. Both time <strong>and</strong> distance measures give apartial <strong>in</strong>dication of the burden of domestic water management felt ma<strong>in</strong>ly bywomen <strong>and</strong> children <strong>in</strong> <strong>Tanzania</strong> <strong>and</strong> an <strong>in</strong>dication of time that could be spent onmore productive <strong>and</strong> social activities.3.3.1 (Not) measur<strong>in</strong>g the policy target - estimat<strong>in</strong>g distanceSurveys <strong>in</strong> <strong>Tanzania</strong> are not consistent <strong>in</strong> their measurement of time <strong>and</strong>distance to water sources: the HBS focuses on time (<strong>in</strong> 2000/1 only) <strong>and</strong> distance(1991 <strong>and</strong> 2000/1) to reach the dry season dr<strong>in</strong>k<strong>in</strong>g water, the DHS records timetaken to go, collect water <strong>and</strong> return home. Despite measur<strong>in</strong>g distance, theHBS cod<strong>in</strong>g does not allow measurement of the National <strong>Water</strong> Policy target ofwater with<strong>in</strong> 400m of the home. The nearest cod<strong>in</strong>g bracket is “less than 1km”.Even if the cod<strong>in</strong>g allowed, estimation of any distance it is difficult for people toestimate distances. One method is to take an estimation of journey time,remember<strong>in</strong>g that this is time to water <strong>in</strong> the dry season. The data for time to awater source shows how people estimate their journey times <strong>in</strong>to round figures:5, 10, 15, 20, 30, 45, 60 m<strong>in</strong>utes etc. To walk 400m takes approximately 10 m<strong>in</strong>utesalthough this is unlikely to be true if you are very old, <strong>in</strong>jured, pregnant orcarry<strong>in</strong>g a very heavy bucket. If this measure is taken with HBS, 2000/1 data:• 78% of urban households travel for 10 m<strong>in</strong>utes or less for dr<strong>in</strong>k<strong>in</strong>g water<strong>in</strong> dry season• 51% of rural households travel for 10 m<strong>in</strong>utes or less for dr<strong>in</strong>k<strong>in</strong>g water<strong>in</strong> dry season24 <strong>Water</strong> <strong>and</strong> <strong>Sanitation</strong> <strong>in</strong> <strong>Tanzania</strong> 2002
• 57% of all ma<strong>in</strong>l<strong>and</strong> households travel for 10 m<strong>in</strong>utes or less for dr<strong>in</strong>k<strong>in</strong>gwater <strong>in</strong> dry season.3.3.2 Trends <strong>in</strong> distance to water <strong>in</strong> the dry seasonTable 3.3.1 shows the percentage of households with a dry season dr<strong>in</strong>k<strong>in</strong>g watersource less than 1 km from the home. It has <strong>in</strong>creased <strong>in</strong> both urban <strong>and</strong> ruralareas from 1991 to 2000 (3% <strong>and</strong> 5% respectively). The percentages ofhouseholds with the source 1km or 2km away have fallen. Those with the source3km or more have generally <strong>in</strong>creased or not changed. For households with thesource WITHIN 1KM (italics, less than 1km plus 1km), the situation has notchanged between 1991 <strong>and</strong> 2000. This figure <strong>and</strong> those with<strong>in</strong> 3km or more areplotted <strong>in</strong> Figure 3.3.1. Both urban <strong>and</strong> rural households have experiencedsimilar rates of change although the disparity between the two areas is evident.TABLE 3.3.1 Percentage of households with dr<strong>in</strong>k<strong>in</strong>g water <strong>in</strong> dry season with<strong>in</strong>certa<strong>in</strong> distance (source HBS 1991 <strong>and</strong> 2000/1)DISTANCE(km)< 1kmURBANRURAL1991 2000 1991 200073.4% 76.5% 43.8% 49%1km14.4%10.4%25%21.1%with<strong>in</strong> 1km87.8%86.9%68.8%70.1%2km6.8%5.2%11.2%9.3%3km1.5%3.9%7.1%8.8%4km1.3%1.5%3.8%2.4%5+km2.6%2.5%9.1%9.3%Total100%100%100%99.9%FIGURE 3.3.1 Change <strong>in</strong> distance travelled by households to fetch water <strong>in</strong> rural <strong>and</strong>urban areas 1991-2000/1 (HBS)80.070.07377Urban households with<strong>in</strong>less than 1km60.0% of households50.040.030.04449Rural households with<strong>in</strong>less than 1km20.02021Rural households with<strong>in</strong>3km or more10.00581991 2000Urban households with<strong>in</strong>3km or more<strong>Water</strong> <strong>and</strong> <strong>Sanitation</strong> <strong>in</strong> <strong>Tanzania</strong> 200225
3.3.2 Trends <strong>in</strong> time taken to fetch waterThe <strong>in</strong>dicator ‘time to fetch water’ is measured by the DHS <strong>and</strong> captures the roundstrip - go<strong>in</strong>g to the water source, wait<strong>in</strong>g, collect<strong>in</strong>g water <strong>and</strong> return<strong>in</strong>g home. Thedata gives a better picture of the burden of domestic water management as itcaptures wait<strong>in</strong>g times at water po<strong>in</strong>ts. For the purposes of the study, 30 m<strong>in</strong>utes wastaken as the cut-off po<strong>in</strong>t to represent those tak<strong>in</strong>g relatively less time to fetch water.Cairncross <strong>and</strong> Feacham (1993) state that observation of people’s behavior <strong>in</strong> variousrural sett<strong>in</strong>gs suggests that water use does not <strong>in</strong>crease as distance to the source isreduced until it is less than 100m. However, they (a) suggest a correlation between adistance of “with<strong>in</strong> about one kilometer” <strong>and</strong> “with<strong>in</strong> half-an-hour’s return journey ofthe home” <strong>and</strong> (b) show that consumption falls for households more than 30 m<strong>in</strong>utesreturn journey time from source.Figure 3.3.2 shows that between 1991-1999, the percentage of households tak<strong>in</strong>g30 m<strong>in</strong>utes or less fell, particularly <strong>in</strong> urban areas. Conversely, those householdstak<strong>in</strong>g more than 2 hours to fetch water has <strong>in</strong>creased, aga<strong>in</strong> the trend be<strong>in</strong>g morepronounced for urban households (source: DHS). Given that distances to water havenot <strong>in</strong>creased significantly over the 1990s it appears that pressure on the waterpo<strong>in</strong>ts, caus<strong>in</strong>g queues for water is the likely explanation. The implications for thetime <strong>and</strong> productive energy levels of women are great.FIGURE 3.3.2 Change <strong>in</strong> time taken to go, collect water <strong>and</strong> return 1992-9990.08880.0808370.060.07566716664% of households50.040.030.020.010.0019121297235DHS 92 1993 DHS 94 1995 DHS 96 1997 1998 DHS 99Urban households tak<strong>in</strong>g 30m<strong>in</strong>s or lessRural households tak<strong>in</strong>g 30m<strong>in</strong>sUrban households tak<strong>in</strong>g more than 2hrsRural households tak<strong>in</strong>g more than 2hrs3.4 Regional differences <strong>in</strong> use of <strong>and</strong> distance to water sources3.4.1 Regional differences <strong>in</strong> use of improved water sourcesRefer to table 3.4.1, map 3.4.1 <strong>and</strong> 3.4.2. The source for this whole section is the HBS2000/1. It must be recognised that this regional disaggregation hides vast <strong>in</strong>traregional(<strong>in</strong>tra-district, <strong>in</strong>tra-ward, <strong>in</strong>tra-village/street <strong>and</strong> <strong>in</strong>tra-household)differences. It is recommended that this study is supplemented by an analysis of theDistrict level data from the Census 2002 <strong>in</strong> order to produce a more useful analysisfor planners <strong>and</strong> local service providers. However, regional-level disaggregation isvery useful <strong>in</strong> provid<strong>in</strong>g <strong>in</strong>formation on geographical disparities.26 <strong>Water</strong> <strong>and</strong> <strong>Sanitation</strong> <strong>in</strong> <strong>Tanzania</strong> 2002
TABLE 3.4.1 Regional percentage of households us<strong>in</strong>g improved water sources (total <strong>and</strong> rural) <strong>in</strong> rank order(the top <strong>in</strong> each list be<strong>in</strong>g the region with the ‘better’ figuresNAME% of rural households with accessto improved water sources(piped. protected wells <strong>and</strong>covered spr<strong>in</strong>gs)NAME% of households us<strong>in</strong>g improvedwater sources <strong>in</strong> region (piped.protected wells <strong>and</strong> coveredspr<strong>in</strong>gs)(source: HBS 2000/1)(source: HBS 2000/1)Kilimanjaro74.1Dar es Salaam93.6Kigoma73.9Kilimanjaro77.3Mbeya66.0Kigoma75.8Morogoro61.6Mbeya74.9Dodoma60.4Morogoro70.2S<strong>in</strong>gida58.9Dodoma65.4Ir<strong>in</strong>ga50.5S<strong>in</strong>gida60.7Arusha48.0Arusha58.9Rukwa47.8Rukwa54.4Ruvuma46.1Ir<strong>in</strong>ga53.8Mtwara44.6Ruvuma53.1Mwanza44.6Mwanza53.1Tanga41.4Mtwara52.4Sh<strong>in</strong>yanga37.0Tanga45.5Mara29.5Mara40.1Kagera29.0Sh<strong>in</strong>yanga40.0Pwani23.4Pwani34.6Tabora13.2Kagera31.4L<strong>in</strong>di11.4Tabora24.6Dar es Salaamnot applicable *L<strong>in</strong>di19.8* accord<strong>in</strong>g to NBS Dar es Salaam classified as urban only<strong>Water</strong> <strong>and</strong> <strong>Sanitation</strong> <strong>in</strong> <strong>Tanzania</strong> 200227
MAP 3.4.1. Percentage of households (urban <strong>and</strong> rural) us<strong>in</strong>g improved (piped <strong>and</strong> protected) water sources as their ma<strong>in</strong> dr<strong>in</strong>k<strong>in</strong>gwater source by region (source: HBS 2000/1)NOTE: The b<strong>and</strong>s were created to best fit the natural group<strong>in</strong>gs with<strong>in</strong> the data as this best highlighted the patterns. Thisdoes, however, make the b<strong>and</strong> figures look odd! Furthermore, the lower figures of each b<strong>and</strong> should read 19.81, 31.41,45.51, 58.91, 70.21. Kagera for example, with 31.4% falls <strong>in</strong> the lowest b<strong>and</strong>.28 <strong>Water</strong> <strong>and</strong> <strong>Sanitation</strong> <strong>in</strong> <strong>Tanzania</strong> 2002
MAP 3.4.2. Percentage of rural households us<strong>in</strong>g improved (piped <strong>and</strong> protected) water sources as their ma<strong>in</strong> dr<strong>in</strong>k<strong>in</strong>g water sourceby region (source: HBS 2000/1)NOTE: As above, the b<strong>and</strong>s were created to best fit the natural group<strong>in</strong>gs with<strong>in</strong> the data as this best highlighted thepatterns. This does, however, make the b<strong>and</strong> figures look odd! Furthermore, the lower figures of each b<strong>and</strong> should read31.21, 37.01, 50.51, 66.01. Tabora for example, with 13.2% falls <strong>in</strong> the lowest b<strong>and</strong>.<strong>Water</strong> <strong>and</strong> <strong>Sanitation</strong> <strong>in</strong> <strong>Tanzania</strong> 200229
The follow<strong>in</strong>g patterns are visible:• The rank orders (total households <strong>and</strong> rural households, table 3.4.1) arevery similar. Despite migration <strong>in</strong>to urban areas, the majority ofhouseholds <strong>in</strong> ma<strong>in</strong>l<strong>and</strong> <strong>Tanzania</strong> are still rural.• Dar es Salaam has the highest percentage of households us<strong>in</strong>g improvedsources (around 93%). This is higher than Kilimanjaro, the region withthe next percentage, by 16%. Remember, however, our reservations overthe figures.• Kilimanjaro <strong>and</strong> Kigoma both have over 75% of total households <strong>and</strong> over73% of rural households who use improved water sources. These arefollowed by Mbeya, Morogoro, Dodoma <strong>and</strong> S<strong>in</strong>gida (60-75% of totalhouseholds <strong>and</strong> 58-66% of rural households)• The survey records that Tabora <strong>and</strong> L<strong>in</strong>di regions both have less than25% of total households <strong>and</strong> 14% of rural households us<strong>in</strong>g improvedwater sources <strong>in</strong> 2000/1. Pwani, Kagera, Mara <strong>and</strong> Sh<strong>in</strong>yanga have lessthan 42% for total households <strong>and</strong> less than 40% of rural households us<strong>in</strong>gimproved water sources.• 12 of the 20 regions have a regional percentage of households us<strong>in</strong>gimproved water sources that is beneath the national percentage of 55.5%.• Some regions show a larger 8-12% difference between the total regionalpercentage <strong>and</strong> the rural percentage. This <strong>in</strong>dicates that these regionshave large <strong>in</strong>equalities between urban <strong>and</strong> rural areas (particularly Mara,Pwani <strong>and</strong> Tabora) or very high percentages of urban households us<strong>in</strong>gimproved sources (eg Arusha).3.4.2 Regional differences <strong>in</strong> time to water sources <strong>in</strong> the dry seasonThis is not related to the improved source as above - you cannot look at thedifferent regions’ percentage of households us<strong>in</strong>g an improved water source thatis 15 m<strong>in</strong>utes away. Table 3.4.2 shows the percentage of households with adr<strong>in</strong>k<strong>in</strong>g water source <strong>in</strong> the dry season with<strong>in</strong> 15 m<strong>in</strong>utes. Note that the top fiveregions (those with more households with<strong>in</strong> 15 m<strong>in</strong>utes) are Dar, Ruvuma,Mbeya, Ir<strong>in</strong>ga <strong>and</strong> Kigoma. Compare these with those regions positions’ <strong>in</strong> therank<strong>in</strong>g for the total percentage of households us<strong>in</strong>g improved sources: Dar,Mbeya <strong>and</strong> Kigoma are consistent but Ruvuma <strong>and</strong> Ir<strong>in</strong>ga both have only 54% ofhouseholds us<strong>in</strong>g improved sources for dr<strong>in</strong>k<strong>in</strong>g, below the national figure of56%. Conversely, Kilimanjaro is near the bottom of this table but ranks veryhighly for use of improved water.30 <strong>Water</strong> <strong>and</strong> <strong>Sanitation</strong> <strong>in</strong> <strong>Tanzania</strong> 2002
WHY THESE PATTERNS?TABLE 3.4.2 Regional differences <strong>in</strong> percentage of householdswhose nearest dr<strong>in</strong>k<strong>in</strong>g water source <strong>in</strong> the dry season iswith<strong>in</strong> 15 m<strong>in</strong>utes1. Patterns of <strong>in</strong>vestmentThere is some correlation between improved access to water <strong>and</strong>large-scale government/<strong>in</strong>ternational fund<strong>in</strong>g. From the AdvisoryTeam’s collective experience, the budget speechesacknowledg<strong>in</strong>g support <strong>and</strong> Therkildsen’s (1988) assessment ofdonor funded rural water supply programmes the follow<strong>in</strong>g l<strong>in</strong>kscan be discerned:- Kilimanjaro - GTZ/KfW- Morogoro - Dutch- Mbeya - Da<strong>in</strong>ish- Dodoma - <strong>and</strong> WAMMA (government <strong>and</strong> <strong>Water</strong>Aid)- S<strong>in</strong>gida - Lutheran Church Federation <strong>and</strong> TCRSIn addition, Kigoma has had significant <strong>in</strong>vestment from thegovernment <strong>in</strong> partnership with Norway, Germany <strong>and</strong> JICA.Kigoma’s high coverage figures may also be l<strong>in</strong>ked to therefugees’ supplies <strong>and</strong> provision to the surround<strong>in</strong>g host villages.However the emergency l<strong>in</strong>k does not hold true for Kagera.Kagera has also had a lot of <strong>in</strong>vestment <strong>in</strong> partnership with SIDAthrough the HESAWA programme but surpris<strong>in</strong>gly has a very lowpercentage coverage (31%). Interest<strong>in</strong>gly, the two regions thatranked highly on the percentage of households with<strong>in</strong> dry seasonwater with<strong>in</strong> 15 m<strong>in</strong>utes - Ruvuma <strong>and</strong> Ir<strong>in</strong>ga - are mentioned <strong>in</strong>Therkildsen’s analysis of the DANIDA’s work. In L<strong>in</strong>di on the otherh<strong>and</strong>, recipient of significant F<strong>in</strong>nish support to rural water <strong>in</strong> the1970s <strong>and</strong> early 1980s, Therkildsen’s study reports that most ofthe schemes have broken down due to poor ma<strong>in</strong>tenance <strong>and</strong>management. Tabora Region has not seen much large-scale<strong>in</strong>vestment for water.2. <strong>Water</strong> resource availabilityKilimanjaro, Mbeya <strong>and</strong> Morogoro are all mounta<strong>in</strong>ous <strong>and</strong> so, atleast <strong>in</strong> parts, have more spr<strong>in</strong>gs; a water source that is relativelycheap to protect <strong>and</strong> distribute water from to settlements us<strong>in</strong>ggravity. Ma<strong>in</strong>tenacne costs <strong>in</strong> those areas are therefore likely tobe far lower than for areas reliant on pump eng<strong>in</strong>es. However,Dodoma <strong>and</strong> S<strong>in</strong>gida, both with relatively high coverage ofimproved sources, are both located <strong>in</strong> semi-arid areas <strong>and</strong> arelargely reliant on deep groundwater aquifers.3. Data issuesWe should not rule out sample design <strong>and</strong> errors when look<strong>in</strong>g forexplanations.NAMEDar es SalaamRuvumaMbeyaIr<strong>in</strong>gaKigomaDodomaMorogoroRukwaS<strong>in</strong>gidaPwaniL<strong>in</strong>diArushaKilimanjaroTaboraMwanzaKageraTangaSh<strong>in</strong>yangaMaraMtwara% of households <strong>in</strong> region whosenearest dr<strong>in</strong>k<strong>in</strong>g water supply <strong>in</strong>the dry season is with<strong>in</strong> 15m<strong>in</strong>utes(source: HBS 2000/1)89.788.377.577.172.571.370.769.768.467.367.365.861.860.155.053.853.753.351.144.1<strong>Water</strong> <strong>and</strong> <strong>Sanitation</strong> <strong>in</strong> <strong>Tanzania</strong> 200231
4.0 <strong>Sanitation</strong> <strong>in</strong> <strong>Tanzania</strong>4.1 Use of toilets <strong>in</strong> <strong>Tanzania</strong>Are we see<strong>in</strong>g vyoo vya bwana afya - the health workers latr<strong>in</strong>es?It is broadly recognized by all actors work<strong>in</strong>g <strong>in</strong> the sector that, <strong>in</strong> order to havea real impact on health, water supply programmes should <strong>in</strong>tegrate sanitation<strong>and</strong> hygiene promotion. Unfortunately, a lack of useful data on sanitationprevents a detailed consideration of trends over time <strong>and</strong> space or more detailedanalysis of the relationships between sanitation <strong>and</strong> other variables. By a lack ofuseful data, we mean:• That the earlier surveys do not have comparable data (HBS 1977 <strong>and</strong>Census 1978).• That the survey questions do not generate <strong>in</strong>formation except use (orownership) of toilet facilities• That the response options are: flush toilet (shared or private for some),VIP, pit latr<strong>in</strong>e, no facility (<strong>and</strong> bush or field) or ‘other’. Experience withcommunities tells us most people do not know what a VIP is. This isreflected <strong>in</strong> the survey figures that show very low percentages us<strong>in</strong>gVIPs, which <strong>in</strong> turn is unlikely to reflect the numbers of households thathave made improvements to their basic latr<strong>in</strong>es.• The Census, DHS <strong>and</strong> HBS, all use largely comparable response options,but differ <strong>in</strong> question word<strong>in</strong>g: Census <strong>and</strong> DHS ask about the toiletfacility that a household has, the HBS asks about use.The basic results shown <strong>in</strong> figures 4.1.1, 4.1.2 <strong>and</strong> 4.1.3 overleaf show thefollow<strong>in</strong>g results:• Not much change! The percentage of households own<strong>in</strong>g a toilet facilityfluctuates between 84% <strong>and</strong> 89% <strong>in</strong> the DHS <strong>and</strong> Census from 1988to1999.• HBS shows no change <strong>in</strong> the percentage of households us<strong>in</strong>g a toiletcompared with those not us<strong>in</strong>g a facility through the 1990s.• The use of flush toilets rema<strong>in</strong>s low.The Advisory Team generally agreed that the percentages of households us<strong>in</strong>gtoilet facilities is not likely to be as high as the figures <strong>in</strong>dicate. Perhaps what weare see<strong>in</strong>g the vyoo vya bwana afya - toilets of the health officers, that were builtbut never used, or were said to exist when they didn’t, to satisfy by-laws onsanitation established even before <strong>in</strong>dependence.Furthermore, the VIP option is too specific but the pit latr<strong>in</strong>e category (byfar the most common type of toilet used) is too broad, <strong>in</strong>clud<strong>in</strong>g both well built<strong>and</strong> well kept sanitary facilities <strong>and</strong> those latr<strong>in</strong>es with collaps<strong>in</strong>g pits, unsafelogs <strong>and</strong> mud on top <strong>and</strong> that are not kept clean.Map 4.1.1 shows regional patterns for percentage of households with toilets.The lighter the colour of the region, the more households there are withoutfacilities. The northern regions clearly have lower percentages than others.However, given the issues with the data questions, we cannot read too much <strong>in</strong>tothese patters.32 <strong>Water</strong> <strong>and</strong> <strong>Sanitation</strong> <strong>in</strong> <strong>Tanzania</strong> 2002
FIGURE 4.1.3 Percentage of households <strong>in</strong> <strong>Tanzania</strong> Ma<strong>in</strong>l<strong>and</strong> us<strong>in</strong>g different toilet facilities over time.10090.080.085858985 87LATRINE70.0% of households60.050.040.030.020.010.0123.4141.3101.2131.8121.5NONEFLUSHCENSUS 1988198919901991DHS 19921993DHS 19941995DHS 199619971998DHS 19992000MAP 4.1.1. Percentage of households with no toilet facilities by region (HBS 2000/1)<strong>Water</strong> <strong>and</strong> <strong>Sanitation</strong> <strong>in</strong> <strong>Tanzania</strong> 200233
5.0 <strong>Water</strong>, sanitation, gender<strong>and</strong> <strong>in</strong>come poverty5.1 Gender <strong>and</strong> water <strong>and</strong> sanitation <strong>in</strong> the surveys5.1.1 What participatory research tells usWomen are usually the domestic <strong>and</strong>, <strong>in</strong>creas<strong>in</strong>gly, the community-level watermanagers <strong>in</strong> <strong>Tanzania</strong>. There are an <strong>in</strong>creas<strong>in</strong>g number of female-headed households<strong>in</strong> the country, for a number of reasons <strong>in</strong>clud<strong>in</strong>g HIV/AIDS <strong>and</strong> chang<strong>in</strong>g socialbehaviour. In 2000/1 22% of households were headed by women, up from 18% <strong>in</strong> 1991(source: HBS 2000/1, HBS 1991). They are often perceived to be poorer <strong>in</strong> many waysthan male headed households. Experience from community based programme work<strong>and</strong> research <strong>in</strong>dicates that particular female-headed households can be particularlyvulnerable to be<strong>in</strong>g denied access to water services. The common unequaldistribution of physical (l<strong>and</strong>, property etc) <strong>and</strong> f<strong>in</strong>ancial assets follow<strong>in</strong>g a divorce ora man’s death is one reason given. The 1995 PPA looked at classifications of povertywith regard to impoverish<strong>in</strong>g processes for the various social groups:• “if a woman is widowed her life prospects immediately change for the worse”• “<strong>in</strong> most areas, a woman lost everyth<strong>in</strong>g <strong>in</strong> divorce”This study, however, <strong>in</strong>dicates that female headed households do not appear to beworse off than male headed households <strong>in</strong> terms of use of protected <strong>and</strong> piped watersources. In fact survey results <strong>in</strong>dicate that more female headed households useprotected sources than male headed households <strong>in</strong> both rural <strong>and</strong> urban areas. BothHBS <strong>and</strong> DHS were used for comparison, so ‘piped’ <strong>and</strong> ‘surface water’ wereanalysed.5.1.2 Female headed households <strong>and</strong> piped waterPiped water often reflects percentage us<strong>in</strong>g protected water sources <strong>and</strong>, asmost piped supplies <strong>in</strong>volve f<strong>in</strong>ancial contributions for O&M, female-headedhouseholds might be expected to have lower access than males. Yet a higherpercentage of female-headed households use piped water sources than maleheadedhouseholds (see figure 5.1.1). This may relate to the fact that theprelim<strong>in</strong>ary HBS results show that female-headed households are no poorer (<strong>in</strong>terms of the food <strong>and</strong> basic needs poverty l<strong>in</strong>es) than male headed households.FIGURE 5.1.1 Change <strong>in</strong> percentage of male <strong>and</strong> female headed households us<strong>in</strong>gpiped <strong>and</strong> surface sources for dr<strong>in</strong>k<strong>in</strong>g water 1991-2000/1 (HBS)50.045.046FEMALE PIPED40.04139MALE PIPED% of households35.030.025.020.015.010.0352019149MALE SURFACEFEMALE SURFACE50HBS 91/2 HBS 200034 <strong>Water</strong> <strong>and</strong> <strong>Sanitation</strong> <strong>in</strong> <strong>Tanzania</strong> 2002
FIGURE 5.1.2 Change <strong>in</strong> percentage of male <strong>and</strong> female headed households us<strong>in</strong>g piped <strong>and</strong> surface sources for dr<strong>in</strong>k<strong>in</strong>g water1991/2-1999 (DHS)50.045.040.035.0383339 3936 37FEMALE PIPEDMALE PIPED30.0% of households25.020.02421222015.010.01412MALE SURFACEFEMALE SURFACE5.0DHS 92 1993 1994 1995 DHS 96 1997 1998 DHS 99In 2000/1 45.8% of female-headed households, 38.6% of male headed householdsused piped water.• In rural areas 33.7% of female-headed households <strong>and</strong> 26.7% of maleheadedhouseholds use piped water. In Dar <strong>and</strong> other urban areas, thedifference is not as great (HBS 2000/1).• The higher percentage of female-headed households us<strong>in</strong>g piped water isevident throughout the 1990s.The use of piped water has <strong>in</strong>creased throughout the 1990s for both sexes ofhead of household but note that the surveys differ on the rate of change that canbe plotted (compar<strong>in</strong>g figures 5.1.1 <strong>and</strong> 5.1.2):• The HBS figures are consistently higher than the DHS (1991/1 bothsurveys carried out over same time period, then DHS <strong>in</strong> 1999 <strong>and</strong> HBS2000/1). Sampl<strong>in</strong>g differences are likely to account for this.• The HBS figures show a greater rate of change <strong>in</strong> use for all femaleheaded households:• HBS: 40.7% <strong>in</strong> 1991 to 45.8% <strong>in</strong> 2000/1 (change of 5%).• DHS: 38.5% <strong>in</strong> 1991/2 to 39% <strong>in</strong> 1999 (less than 1 % <strong>in</strong>crease)• The DHS <strong>in</strong>dicates that the <strong>in</strong>crease <strong>in</strong> use is greater for male-headedhouseholds than female. The HBS figures show the opposite. However,remember that the percentages are small.Use of piped water has <strong>in</strong>creased throughout the 1990s <strong>in</strong> all areas except Dares Salaam for both sexes of head of household. The rate of <strong>in</strong>crease is greatestfor female-headed households <strong>in</strong> rural areas as the graph 5.1.3 overleaf shows.Both male <strong>and</strong> female headed households show the same trends through the1990s:• an <strong>in</strong>crease <strong>in</strong> piped use <strong>in</strong> rural areas (5% <strong>in</strong>crease for female headedhouseholds <strong>and</strong> 3% <strong>in</strong>crease for males);• an <strong>in</strong>crease <strong>in</strong> urban areas (other than Dar) of 3.8% female <strong>and</strong> 2.4% formale headed households;• a decl<strong>in</strong>e <strong>in</strong> use of piped water <strong>in</strong> Dar (8% decrease for female, 7.1% formale).<strong>Water</strong> <strong>and</strong> <strong>Sanitation</strong> <strong>in</strong> <strong>Tanzania</strong> 200235
FIGURE 5.1.3 Change <strong>in</strong> percentage of households us<strong>in</strong>g piped water fordr<strong>in</strong>k<strong>in</strong>g by sex of head of household <strong>and</strong> strata 1991-2001 (HBS)1009590.09287FEMALE DAR PIPED86 MALE DAR PIPED80.070.0737775FEMALE OTHER URBAN PIPEDMALE OTHER URBAN PIPED60.050.0% of households40.030.020.0413529244538FEMALE TOTAL PIPEDMALE TOTAL PIPED34 FEMALE RURAL PIPED28 MALE RURAL PIPED10.00HBS 91/2 HBS 20005.1.3 Female headed households <strong>and</strong> use of surface waterFigure 5.1 shows that <strong>in</strong> 2000, a higher percentage of male-headed householdsused surface water sources for dr<strong>in</strong>k<strong>in</strong>g than female-headed households. In2000/1 9.4% of female-headed households, 19.7% of male-headed households usedsurface water. In rural areas 11.6% of female-headed households <strong>and</strong> 17% ofmale-headed households use surface water. In Dar <strong>and</strong> other urban areas, thedifference is very small (HBS 2000/1). The higher percentage of male-headedhouseholds us<strong>in</strong>g surface water is evident throughout the 1990s (except <strong>in</strong> 1991HBS which records female-headed households’ use 1% higher).Use of surface water has decreased throughout the 1990s for both sexes ofhead of household <strong>and</strong> aga<strong>in</strong> surveys differ on the rate of change (compar<strong>in</strong>g5.1.1 <strong>and</strong> 5.1.2 aga<strong>in</strong>):• Note that the HBS figures are higher than the DHS.• The HBS figures show a greater rate of change <strong>in</strong> use for all femaleheadedhouseholds: 19.7% <strong>in</strong> 1991 to 9.4% <strong>in</strong> 2000/1 (change of 10.3%).This decrease is far greater than that for male-headed households whichfell from 18.7% to 14.3% (4.4%).• The DHS shows a more similar change between the sexes: 21.2% <strong>in</strong>1991/2 to 12.4% <strong>in</strong> 1999 (a fall of 8.8%) for female-headed households <strong>and</strong>24.5% to 13.6% (10.9%) for male headed households. The DHS shows agreater rate of decl<strong>in</strong>e <strong>in</strong> the late 1990s than the early 1990s.• However remember that the word<strong>in</strong>g for the question changed for theDHS 1999, br<strong>in</strong>g<strong>in</strong>g the options offered to respondents more <strong>in</strong> l<strong>in</strong>e withthe HBS. It appears that the DHS was generally over-estimat<strong>in</strong>g surfacewater use as people classified some shallow wells as surface sources (<strong>in</strong>1999 they become open, unprotected wells).Just as the difference between male <strong>and</strong> female-headed households us<strong>in</strong>g pipedwater appears greatest <strong>in</strong> rural areas, so does the difference between thoseus<strong>in</strong>g surface water.36 <strong>Water</strong> <strong>and</strong> <strong>Sanitation</strong> <strong>in</strong> <strong>Tanzania</strong> 2002
5.1.4 Female-headed households <strong>and</strong> use of improved waterAs you might expect, this follows the general trends of piped water use (seefigure 5.1.4):• In 2000/1 a higher percentage of female-headed households <strong>in</strong> <strong>Tanzania</strong>us<strong>in</strong>g improved water sources for dr<strong>in</strong>k<strong>in</strong>g - 59.8% female-headedhouseholds, 54.2% male-headed households (HBS 2000/1)• There has been an <strong>in</strong>crease for rural <strong>and</strong> urban areas <strong>in</strong> the use ofimproved water but a decrease for Dar for both sexes. Aga<strong>in</strong>, thedifference between male <strong>and</strong> female-headed households was morepronounced for rural than for the others.• Interest<strong>in</strong>gly, when you look at protected water sources not <strong>in</strong>clud<strong>in</strong>gpiped supplies, there is very little difference at all <strong>in</strong> male <strong>and</strong> female useof the sources (protected wells <strong>and</strong> covered spr<strong>in</strong>gs).FIGURE 5.1.4 Change <strong>in</strong> use of improved water sources for dr<strong>in</strong>k<strong>in</strong>g by male <strong>and</strong>female headed households 1991 - 2000/1 (HBS)10090.080.0% of households70.060.050.040.050.4%59.8%44.9%54.2%30.020.010.0Protected with pipedFemale TotalProtected with pipedMale TotalPossible reasons for difference:• It is possible that women, when head<strong>in</strong>g a household, chose protected watersources <strong>and</strong> prioritise water with<strong>in</strong> the household budget.• Sample differences. The DHS <strong>and</strong> HBS have different purposes. The DHS isfocused on maternal <strong>and</strong> child health <strong>and</strong> enumerators actively seek outfemales for the women’s survey. Either this survey over-samples as a resultOR it f<strong>in</strong>ds some of those that the HBS misses.• Def<strong>in</strong>itions of rural <strong>and</strong> urban (as with the explanation for piped water use,the ‘rural’ sample is perhaps reflect<strong>in</strong>g peri-urban communities). Perhapsthere are more female-headed households <strong>in</strong> those areas - this is not possibleto tell from the surveys.Technical implications:The HBS generally gives a more favourable picture for female-headedhouseholds than the DHS, particularly <strong>in</strong> rural areas. The study still focuses onthe HBS as use of improved sources can be analysed, however, it should beremembered that the trends are slightly different if the DHS is used.<strong>Water</strong> <strong>and</strong> <strong>Sanitation</strong> <strong>in</strong> <strong>Tanzania</strong> 200237
5.2 <strong>Water</strong> <strong>in</strong> <strong>Tanzania</strong> <strong>and</strong> basic needs poverty5.2.1 Basic needs povertyThe National Bureau of Statistics of <strong>Tanzania</strong> with OPML developed a <strong>Poverty</strong>Basel<strong>in</strong>e for <strong>Tanzania</strong> <strong>and</strong> updated it us<strong>in</strong>g the HBS 2000/1. See NBS <strong>and</strong> OPML(2000) <strong>and</strong> the Annual <strong>Poverty</strong> <strong>and</strong> Human Development Report (2002) for anexplanation of the Food <strong>Poverty</strong> l<strong>in</strong>e <strong>and</strong> the Basic Needs <strong>Poverty</strong> l<strong>in</strong>e creation,both based on household expenditure as a proxy for <strong>in</strong>come poverty. For thisstudy, the basic needs poverty l<strong>in</strong>e is used to analyse use of water source byhousehold accord<strong>in</strong>g to wealth. The limitation <strong>in</strong>herent to apply<strong>in</strong>g this type ofanalysis is that households with very similar expenditure fall either side of thepoverty l<strong>in</strong>e as well as issues such as the expenditure levels of subsistencehouseholds not adequately captur<strong>in</strong>g relative <strong>in</strong>come (NBS <strong>and</strong> OPML 2000).For this section, the use of improved water is related to the population above<strong>and</strong> below the basic needs poverty l<strong>in</strong>e.5.2.2 Basic needs poverty <strong>and</strong> use of improved (piped <strong>and</strong> protected) watersourcesFigure 5.2.1 below shows that more households liv<strong>in</strong>g below the basic needspoverty l<strong>in</strong>e use unprotected water sources than those above. More householdsabove the poverty l<strong>in</strong>e use piped water than those below the poverty l<strong>in</strong>e. Thereis little difference for the use of protected water. Table 5.2.1 shows the use ofpiped, protected <strong>and</strong> unprotected sources by stratum.FIGURE 5.2.1 Percentage of households us<strong>in</strong>g piped, protected, unprotected <strong>and</strong> other water sources that are above <strong>and</strong>below the poverty l<strong>in</strong>e (HBS 2000/1)60.055.050.045.052.6%Households above povertyl<strong>in</strong>e us<strong>in</strong>g sourceHouseholds below povertyl<strong>in</strong>e us<strong>in</strong>g source% of households40.035.030.025.020.043.0%29.3%40.2%15.010.015.7%17.5%5.00Piped Protected Unprotected Other1.2%0.6%38 <strong>Water</strong> <strong>and</strong> <strong>Sanitation</strong> <strong>in</strong> <strong>Tanzania</strong> 2002
TABLE 5.2.1 Use of different water sources by households above <strong>and</strong> below the poverty l<strong>in</strong>e by stratum (HBS 2000/1)DAR ES SALAAM URBAN RURALAbove the BNPL Below the BNPL Above the BNPL Below the BNPL Above the BNPL Below the BNPLPiped88%72%78%65%30%24%Protected7%15%12%15%18%18%Improved95%87%90%80%48%42%Unprotected2%12%9%19%51%57%Other3%1%1%1%1%1%TOTAL100%100%100%100%100%100%The follow<strong>in</strong>g is apparent:• That those households liv<strong>in</strong>g below the basic needs poverty l<strong>in</strong>e are morelikely to use unprotected sources for dr<strong>in</strong>k<strong>in</strong>g no matter where they live.The difference is greatest between those above <strong>and</strong> those below <strong>in</strong> urbanareas (both urban <strong>and</strong> Dar). The difference <strong>in</strong> rural is less, perhapssignify<strong>in</strong>g the high level of poverty <strong>in</strong> rural areas.• That <strong>in</strong> Dar es Salaam 16% less of those households below the povertyl<strong>in</strong>e, than those households above, rely on the piped water supply. Alsonote; though only 7% of households <strong>in</strong> Dar were recorded as us<strong>in</strong>gunprotected sources these households were six times more likely to bethose below the poverty l<strong>in</strong>e.5.2.3 <strong>Poverty</strong> qu<strong>in</strong>tiles <strong>and</strong> use of improved water sourcesHousehold expenditure qu<strong>in</strong>tiles are created by sort<strong>in</strong>g households <strong>in</strong>to five b<strong>and</strong>seach correspond<strong>in</strong>g to one fifth of the households sampled; from those with lowestFIGURE 5.2.3 Percentage of households us<strong>in</strong>g piped, protected, unprotected <strong>and</strong> other water sources that are <strong>in</strong> the lowest<strong>and</strong> the highest expenditure qu<strong>in</strong>tiles (HBS 2000/1).60.055.050.045.055.7%53.9%Households <strong>in</strong> topexpenditure qu<strong>in</strong>tileHouseholds <strong>in</strong> lowestexpenditure qu<strong>in</strong>tile40.0% of households35.030.025.020.028.2%30.7%15.017.7%10.05.0012.1%1.4%0.3%Piped Protected Unprotected Other<strong>Water</strong> <strong>and</strong> <strong>Sanitation</strong> <strong>in</strong> <strong>Tanzania</strong> 200239
expenditure, to those with highest expenditure. This allows us to ga<strong>in</strong> a picture of the<strong>in</strong>equalities between households <strong>in</strong> different expenditure qu<strong>in</strong>tiles.Figure 5.2.3 compares use of piped <strong>and</strong> protected water for the two extremequ<strong>in</strong>tiles, top <strong>and</strong> bottom expenditure. However, the use of piped <strong>and</strong> protectedsources by qu<strong>in</strong>tile analysis is not markedly different to the analysis by poverty l<strong>in</strong>e.This suggests that factors other than spend<strong>in</strong>g power may be mask<strong>in</strong>g <strong>in</strong>herent<strong>in</strong>equality <strong>in</strong> the use of sources.5.2.4 Poorer households <strong>and</strong> their distance to waterTABLE 5.2.2 Distance <strong>and</strong> time to dr<strong>in</strong>k<strong>in</strong>g water sources <strong>in</strong> the dry season (HBS 2000/1)Households belowthe poverty l<strong>in</strong>eHouseholds abovethe poverty l<strong>in</strong>eHouseholds <strong>in</strong>poorest qu<strong>in</strong>tileHouseholds <strong>in</strong>richest qu<strong>in</strong>tileDISTANCE to dr<strong>in</strong>k<strong>in</strong>g water<strong>in</strong> dry seasonMean1.61.41.61.3Median1010Mode0000TIME to dr<strong>in</strong>k<strong>in</strong>g water source<strong>in</strong> the dry seasonMean26.421.826.719.9Median1010108Mode510510Poorer households travel further for their water <strong>and</strong> spend longer collect<strong>in</strong>g it.It is not accurate to use the mean as a stated average for distance to water asthe distances are classified as 0, 1km, 2km, 3km, 4km etc. However, table 5.2.2shows both the means <strong>and</strong> the medians do <strong>in</strong>dicate that more poor households(those below the basic needs l<strong>in</strong>e <strong>and</strong> <strong>in</strong> the poorest qu<strong>in</strong>tile) travel further fortheir water than richer households. The modal value (the most frequentlystated) is zero kilometers (less than 1) for both richer <strong>and</strong> poorer households.For time to water, however, the mean <strong>and</strong> median can be used directly.Poorer households spend, on average, 7 m<strong>in</strong>utes longer than richer householdscollect<strong>in</strong>g water (27 m<strong>in</strong>utes compared to 20 m<strong>in</strong>utes, us<strong>in</strong>g the means for thelowest <strong>and</strong> highest qu<strong>in</strong>tiles of households). As figure 5.2.4 illustrates, 59% ofpoorer households (<strong>in</strong> the lowest qu<strong>in</strong>tile) take 15 m<strong>in</strong>utes or less to collectdr<strong>in</strong>k<strong>in</strong>g water <strong>in</strong> the dry season. 75% of richer households (<strong>in</strong> the highestqu<strong>in</strong>tile) take 15 m<strong>in</strong>utes or less to fetch it.It is <strong>in</strong>terest<strong>in</strong>g however that the modal value aga<strong>in</strong> does not follow thispattern, actually show<strong>in</strong>g that the most common time spent by richerhouseholds to fetch water is 10 m<strong>in</strong>utes compared with 5 for poorer. Rememberthat queu<strong>in</strong>g time, not captured by this <strong>in</strong>dicator, <strong>in</strong>fluences these figures <strong>in</strong> all,but especially urban, areas.40 <strong>Water</strong> <strong>and</strong> <strong>Sanitation</strong> <strong>in</strong> <strong>Tanzania</strong> 2002
FIGURE 5.2.4 Percentage of households fetch<strong>in</strong>g water with<strong>in</strong> 15 m<strong>in</strong>utes <strong>in</strong> the dry season (source: HBS 2000/1)10090.040.9% 39.6% 39.3% 30.3% 25.5%80.0% of households70.060.050.040.030.020.010.059.1% 60.4% 60.7%69.7%74.5%Households more than15 m<strong>in</strong>utes from dr<strong>in</strong>k<strong>in</strong>gwater source <strong>in</strong> dryseasonHouseholds with<strong>in</strong> 15m<strong>in</strong>utes from dr<strong>in</strong>k<strong>in</strong>gwater source <strong>in</strong> dryseason1 -Lowest(poorest)2 3 4 5 - Highest(richest)<strong>Water</strong> <strong>and</strong> <strong>Sanitation</strong> <strong>in</strong> <strong>Tanzania</strong> 200241
5.2.5 Regional patterns: access to water <strong>and</strong> basic needs povertyAs table 5.2.5 shows, some of the poorest regions are also those with the lowerpercentage of households us<strong>in</strong>g improved water sources/with water with<strong>in</strong> 15m<strong>in</strong>utes from the home <strong>in</strong> the dry season. L<strong>in</strong>di, Sh<strong>in</strong>yanga, Pwani <strong>and</strong> Mara allhave low use of improved water figures <strong>and</strong> high numbers of the populationliv<strong>in</strong>g beneath the poverty l<strong>in</strong>e. Kilimanjaro, Dar, Mbeya <strong>and</strong> Morogoro all havefewer households below the poverty l<strong>in</strong>e <strong>and</strong> have higher percentages ofhouseholds that use improved water sources. There are, however, somesurprises like Tabora (very low use of improved water but apparently one of theregions with a low percentage of those beneath the poverty l<strong>in</strong>e) <strong>and</strong> S<strong>in</strong>gida -the opposite to Tabora. This needs further exploration.TABLE 5.2.5 Percentage of households us<strong>in</strong>g improved water sources for dr<strong>in</strong>k<strong>in</strong>g, liv<strong>in</strong>g with<strong>in</strong> 15 m<strong>in</strong>utes of their dr<strong>in</strong>k<strong>in</strong>g watersource <strong>in</strong> the dry season <strong>and</strong> households beneath the basic needs poverty l<strong>in</strong>e% of householdsus<strong>in</strong>g improvedwater sources% of householdswith water with<strong>in</strong>15 m<strong>in</strong>utes%of householdsbelow the basicneeds of povertyL<strong>in</strong>di19.8Mtwara44.1S<strong>in</strong>gida49.4Tabora24.6Mara51.1L<strong>in</strong>di43.1Kagera31.2Sh<strong>in</strong>yanga53.3Mara36.3Pwani34.6Tanga53.7Mwanza35.6Sh<strong>in</strong>yanga39.9Kagera53.8Sh<strong>in</strong>yanga34.1Mara40.1Mwanza55.0Pwani33.5Tanga45.5Tabora60.1Kigoma30.6Mtwara52.3Kilimanjaro61.8Arusha29.4Mwanza52.8Arusha65.8Ruvuma28.1Ruvuma53.1Pwani67.3Tanga27.9Ir<strong>in</strong>ga53.8L<strong>in</strong>di67.3Rukwa27.6Rukwa54.5S<strong>in</strong>gida68.4Mtwara27.0Arusha58.8Rukwa69.7Dodoma25.8S<strong>in</strong>gida60.7Morogoro70.7Ir<strong>in</strong>ga25.0Dodoma65.4Dodoma71.3Kilimanjaro23.6Morogoro70.2Kigoma72.5Kagera21.7Mbeya74.5Ir<strong>in</strong>ga77.1Morogoro21.4Kigoma75.8Mbeya77.5Tabora18.2Kilimanjaro77.2Ruvuma88.3Mbeya16.3Dar es Salaam93.3Dar es Salaam89.7Dar es Salaam11.942 <strong>Water</strong> <strong>and</strong> <strong>Sanitation</strong> <strong>in</strong> <strong>Tanzania</strong> 2002
5.3 <strong>Water</strong> <strong>and</strong> educationThe proportion of school aged children who are either <strong>in</strong> school or who havef<strong>in</strong>ished their primary education was analysed for households liv<strong>in</strong>g close to <strong>and</strong>far away from a water source. The DHS 1996 data was used. 62 % of school agedchildren who lived 15 m<strong>in</strong>utes or less from their dr<strong>in</strong>k<strong>in</strong>g water source wereattend<strong>in</strong>g school (accord<strong>in</strong>g to the DHS 1996), compared to 38% of school agedchildren who were not. Of those children liv<strong>in</strong>g over one hour from their sourceof dr<strong>in</strong>k<strong>in</strong>g water, the figure for children not <strong>in</strong> school rose to 50%, with theother 50% not attend<strong>in</strong>g school (DHS 1996).School aged children were taken as those aged 7-18 years to allow for the latestart<strong>in</strong>g of many children <strong>in</strong> the education system <strong>in</strong> <strong>Tanzania</strong>. The DHS 1996was used for this analysis as it was the most recent survey that gave the levelof <strong>in</strong>formation required to carry out this analysis. As the surveys were notcarried out <strong>in</strong> order to perform this analysis (that is the sampl<strong>in</strong>g strategy wasnot based around school aged children), the results must as po<strong>in</strong>ters for futureresearch.FIGURE 5.3a Proportion of school aged children (7-18) who live 15 m<strong>in</strong>utes or lessfrom their dr<strong>in</strong>k<strong>in</strong>g water source that are either <strong>in</strong> school or have completed primaryschool% of school aged children <strong>in</strong>school/f<strong>in</strong>ished primary38% 62%% of school aged children not <strong>in</strong>schoolFIGURE 5.3b Proportion of school aged children (7-18) who live over 1 hour from theirdr<strong>in</strong>k<strong>in</strong>g water source that are either <strong>in</strong> school or have completed primary school (DHS)% of school aged children <strong>in</strong>school/f<strong>in</strong>ished primary50% 50%% of school aged children not <strong>in</strong>school<strong>Water</strong> <strong>and</strong> <strong>Sanitation</strong> <strong>in</strong> <strong>Tanzania</strong> 200243
Disaggregat<strong>in</strong>g by gender shows that there is little difference <strong>in</strong> the percentageof girls attend<strong>in</strong>g school or hav<strong>in</strong>g completed primary school from thepercentage of all children liv<strong>in</strong>g both close <strong>and</strong> far from water sources.Proportion of school aged girls (7-18 year olds) who live 15 m<strong>in</strong>utes orless from their dr<strong>in</strong>k<strong>in</strong>g water source that are either <strong>in</strong> school or havef<strong>in</strong>ished primary school% of school aged girls <strong>in</strong> school/f<strong>in</strong>ished primary 58.8% of school aged girls not <strong>in</strong> school 41.2Proportion of school aged girls (7-18 year olds) who live more than anhour from their dr<strong>in</strong>k<strong>in</strong>g water source that are either <strong>in</strong> school or havef<strong>in</strong>ished primary school% of school aged girls <strong>in</strong> school/f<strong>in</strong>ished primary 50.8% of school aged girls not <strong>in</strong> school 49.2The reasons for these trends are complex. For example, proximity to a watersource may also be closely related to proximity to the school. This should beexplored further through more participatory <strong>and</strong> qualitative research.44 <strong>Water</strong> <strong>and</strong> <strong>Sanitation</strong> <strong>in</strong> <strong>Tanzania</strong> 2002
Some policy implications of the f<strong>in</strong>d<strong>in</strong>gs 6.0The follow<strong>in</strong>g <strong>in</strong>itial thoughts on policy implications of the f<strong>in</strong>d<strong>in</strong>gs will beexp<strong>and</strong>ed <strong>and</strong> ref<strong>in</strong>ed as the water <strong>and</strong> sanitation stakeholders take forward this<strong>and</strong> other research. <strong>Water</strong>Aid’s newly formed Policy Research <strong>and</strong>Dissem<strong>in</strong>ation Programme <strong>in</strong> partnership with the M<strong>in</strong>istry of <strong>Water</strong> is likely totake the <strong>in</strong>itial lead <strong>in</strong> this.6.1 <strong>Water</strong> <strong>and</strong> sanitation as priority sector for poverty reduction6.1.1 The state of water <strong>and</strong> sanitation <strong>in</strong> <strong>Tanzania</strong>.Accord<strong>in</strong>g to the surveys, <strong>in</strong> 2000/1, 46% of the total population of <strong>Tanzania</strong> stilldo not use an improved water source; 54% <strong>in</strong> rural areas. And, these figures donot reflect the unreliability, <strong>in</strong>accessibility <strong>and</strong> fluctuat<strong>in</strong>g costs of manysources. The percentage of households with access to piped water has not<strong>in</strong>creased significantly over the past 24 years although <strong>in</strong> absolute terms thenumber of people reached is higher <strong>and</strong> surveys do <strong>in</strong>dicate an <strong>in</strong>creased use ofimproved water sources <strong>in</strong> most areas through the 1990s. The percentage ofhouseholds tak<strong>in</strong>g over 2 hours to fetch water is <strong>in</strong>creas<strong>in</strong>g. This suggests<strong>in</strong>tensify<strong>in</strong>g pressure on water po<strong>in</strong>ts - <strong>and</strong> that <strong>in</strong>vestment <strong>in</strong> water supplydevelopment has not kept up with dem<strong>and</strong>.Although limited analysis was possible <strong>and</strong> cause-effect relationships aredifficult to determ<strong>in</strong>e due to many confound<strong>in</strong>g factors, the study suggests thatschool aged children tak<strong>in</strong>g less time to fetch water are more likely to attendschool <strong>and</strong> that poor households are more likely to use unprotected watersources <strong>and</strong> travel longer distances <strong>in</strong> do<strong>in</strong>g so, add<strong>in</strong>g the likelihood of waterrelateddiseases <strong>and</strong> a heavy burden of fetch<strong>in</strong>g water to other stresses faced bythose liv<strong>in</strong>g <strong>in</strong> poverty.6.1.2 Prioritis<strong>in</strong>g the sectorThe need for cont<strong>in</strong>ued prioritisation of water (<strong>and</strong> environmental sanitation)<strong>and</strong> <strong>in</strong>creased <strong>and</strong> effectively targeted <strong>and</strong> spent budget allocations is clear. Yetcurrent budget allocations to both the m<strong>in</strong>istry <strong>and</strong> local government authoritiesdo not reflect the importance or the state of the sector. Compared to otherpriority social service sectors, water’s allocation of the domestic <strong>and</strong> totalbudgets are low <strong>and</strong> not <strong>in</strong>creas<strong>in</strong>g at the same rate (MoF, 2002). Other research(referred to below) needs to review exist<strong>in</strong>g <strong>in</strong>formation or design new researchto explore further the impact that <strong>in</strong>vest<strong>in</strong>g heavily <strong>in</strong> water <strong>and</strong> sanitationwould have on poverty reduction for all <strong>in</strong> <strong>Tanzania</strong>.6.2 <strong>Water</strong> <strong>and</strong> sanitation targets for poverty reduction6.2.1 Geographical <strong>in</strong>equalities <strong>in</strong> water <strong>and</strong> sanitationThe disparity between urban <strong>and</strong> rural households <strong>in</strong> the survey data is large.Rural water supply development is prioritised <strong>in</strong> the PRS but not reflected <strong>in</strong>the accompany<strong>in</strong>g medium term expenditure framework (eg MoWLD 2001). Theregional, <strong>and</strong> of course, district budget allocations <strong>and</strong> expenditures need toredress the clear regional disparities <strong>in</strong> sector service provision. Furtheranalysis of public expenditure reviews for the sector is required.6.2.2 Dar es Salaam: pro poor plann<strong>in</strong>g?The situation <strong>in</strong> Dar es Salaam as depicted by the surveys is gett<strong>in</strong>g worse <strong>in</strong>terms of use of improved water sources <strong>and</strong> toilet facilities. However, the figuresdo rema<strong>in</strong> very high; far higher than <strong>Water</strong>Aid <strong>and</strong> others’ experience on the<strong>Water</strong> <strong>and</strong> <strong>Sanitation</strong> <strong>in</strong> <strong>Tanzania</strong> 200245
ground suggests. The use of piped supply by poorer households is fall<strong>in</strong>g fasterthan for those above the poverty basel<strong>in</strong>e. The PRS to date <strong>and</strong> atta<strong>in</strong>ment ofHIPC completion po<strong>in</strong>t has dem<strong>and</strong>ed progress on privatisation of DAWASA. Isthis really a pro-poor strategy? This needs further exploration.6.2.3 Pro-poor targets for the PRS?Is the poverty reduction strategy <strong>in</strong>tended to <strong>in</strong>crease the percentages of allhouseholds us<strong>in</strong>g improved water sources? Or is it <strong>in</strong>tended to ensure that thosemost vulnerable to water <strong>in</strong>security or those liv<strong>in</strong>g <strong>in</strong> extreme poverty ga<strong>in</strong>better access to improve their well-be<strong>in</strong>g?For example, one of the PRS targets set by MoWLD is the ‘rehabilitation ofall malfunction<strong>in</strong>g water sources’ (orig<strong>in</strong>ally targeted <strong>in</strong>stead of, rather than aswell as, the development of new water supplies). This target is clearly based ona need but is also a strategy designed to <strong>in</strong>crease the number of households us<strong>in</strong>gimproved supplies with m<strong>in</strong>imal capital <strong>in</strong>vestment (MoWLD, personalcommunication). Target<strong>in</strong>g the poor would <strong>in</strong>volve more significant <strong>in</strong>vestment<strong>in</strong> water supply development, a greater focus on areas where there is waterscarcity <strong>and</strong> capacity build<strong>in</strong>g of communities <strong>and</strong> other actors to manage <strong>and</strong>ma<strong>in</strong>ta<strong>in</strong> the schemes.6.3 Quality data <strong>and</strong> <strong>in</strong>formation for <strong>Poverty</strong> Monitor<strong>in</strong>g6.3.1 Data quality <strong>and</strong> consistency.The need for improved <strong>and</strong>, <strong>in</strong> some cases, more useful <strong>in</strong>formation on water <strong>and</strong>sanitation for <strong>in</strong>form<strong>in</strong>g pro-poor policy, budget<strong>in</strong>g <strong>and</strong> plann<strong>in</strong>g is clear. Surveyquestions not be<strong>in</strong>g comparable or useful <strong>and</strong> then misclassification of some keydata limited the scope of this study. The need to clarify <strong>and</strong> be consistent withdef<strong>in</strong>itions of <strong>in</strong>dicators, for example use of improved water sources, for all formsof data collection is evident.6.3.2 Which data source to use?Some 50% (HBS) OR 46% (MoWLD figures) of rural households use improvedwater sources - different figures dependent on the data used. Does it matter?Given the differences <strong>in</strong> measurement, the difference between the figures isactually very small. What appears to be important is a decision about which datasource to use when monitor<strong>in</strong>g key policy targets - which source provides goodquality data, measures useful <strong>in</strong>dicators <strong>and</strong> most effectively reflects the realsituation faced by poor women, children <strong>and</strong> men <strong>in</strong> their everyday lives.46 <strong>Water</strong> <strong>and</strong> <strong>Sanitation</strong> <strong>in</strong> <strong>Tanzania</strong> 2002
<strong>Poverty</strong> monitor<strong>in</strong>g for the Sector: recommendedmodifications based on the survey results7.07.1 Mak<strong>in</strong>g recommendationsThe stakeholder meet<strong>in</strong>g <strong>in</strong> September acknowledged a huge range of possiblewater <strong>and</strong> sanitation <strong>in</strong>dicators. These recommendations are based on thisrange plus f<strong>in</strong>d<strong>in</strong>gs of the study.As described by Bosch et al (2001- draft), <strong>in</strong>dicator types can be broken down<strong>in</strong>to:• impact <strong>in</strong>dicators that measure the f<strong>in</strong>al effects of water <strong>and</strong> sanitation<strong>in</strong>terventions on different poverty dimensions (eg reduced <strong>in</strong>fantmortality from diarrhoeal disease, attendance <strong>and</strong> atta<strong>in</strong>ment at school,household <strong>in</strong>come poverty levels).• outcome <strong>in</strong>dicators that measure the conditions required for the effectsto be achieved• <strong>in</strong>put/output <strong>in</strong>dicators that for water <strong>and</strong> sanitation <strong>in</strong>clude <strong>in</strong>vestmentor expenditure on water at different levels <strong>and</strong> measures of the servicesprovided (eg availability of spare parts).The ma<strong>in</strong> focus of these recommendations is on outcome <strong>in</strong>dicators. It wasrecognised by all participants that different <strong>in</strong>dicators are required to generate<strong>in</strong>formation for different uses <strong>and</strong> require measurement by differentcomponents of the <strong>Poverty</strong> Monitor<strong>in</strong>g System (section 1.2). Theserecommendations focus on those outcome <strong>in</strong>dicators measured by surveys <strong>and</strong>census, l<strong>in</strong>k<strong>in</strong>g where possible with rout<strong>in</strong>e data collection to enable moreeffective comparison <strong>and</strong> cross-check<strong>in</strong>g.In mak<strong>in</strong>g recommendations, the importance of the follow<strong>in</strong>g was recognised:• l<strong>in</strong>k<strong>in</strong>g <strong>in</strong>dicators to national targets (<strong>and</strong> <strong>in</strong>ternational goals) that areuseful for decision mak<strong>in</strong>g;• ma<strong>in</strong>ta<strong>in</strong><strong>in</strong>g consistency with previous surveys for trend analysis;• work<strong>in</strong>g with<strong>in</strong> space limitations of the surveys;• work<strong>in</strong>g with<strong>in</strong> the survey focus (eg health, household <strong>in</strong>come <strong>and</strong>expenditure, labour) of the national surveys;• keep<strong>in</strong>g <strong>in</strong>dicators few <strong>and</strong> simple, easy to measure <strong>and</strong> easy to translate<strong>in</strong>to Swahili;• relat<strong>in</strong>g to the basic <strong>in</strong>formation requirements that could <strong>and</strong> should befulfilled by surveys to gather <strong>in</strong>formation required for monitor<strong>in</strong>goutcomes of water <strong>and</strong> sanitation developments.For water supply, for example, key <strong>in</strong>formation to monitor <strong>in</strong>cludes:• quantity of water used <strong>in</strong> relation to that required for basic requirements(dr<strong>in</strong>k<strong>in</strong>g, hygiene, cook<strong>in</strong>g etc);• quality of water for dr<strong>in</strong>k<strong>in</strong>g• accessibility of water source (accessibility <strong>in</strong> terms of physical accessoften restricted by terra<strong>in</strong> <strong>and</strong> distance, ability to pay the costs)• reliability of water source (function<strong>in</strong>g of source every day all yearround)7.2 The recommendationsTable 7.1 below shows the <strong>in</strong>dicators that this study recommends formeasurement by the national household surveys. It highlights the exist<strong>in</strong>g<strong>in</strong>dicators that the recommendations are based on <strong>and</strong> which survey shouldmeasure them. As the exist<strong>in</strong>g outcome <strong>in</strong>dicators largely relate to the currentnational poverty reduction targets of <strong>in</strong>creased <strong>and</strong> ultimately universal access,the l<strong>in</strong>k between recommended <strong>in</strong>dicators <strong>and</strong> national targets is not stated.<strong>Water</strong> <strong>and</strong> <strong>Sanitation</strong> <strong>in</strong> <strong>Tanzania</strong> 200247
The follow<strong>in</strong>g pages outl<strong>in</strong>e each of the <strong>in</strong>dicators <strong>in</strong> more detail. We then reviewthe suggested disaggregation/target group to focus on for monitor<strong>in</strong>g.TABLE 7.1 The recommended <strong>in</strong>dicatorsASPECT OF WATER & PREVIOUS INDICATOR MEASURED TO RECOMMENDED INDICATORS MEASURED BYSANITATION (AND SOURCE) DATE?<strong>Water</strong> quality Population/percentage of ✔ HBS, DHShouseholds with access to HBS us<strong>in</strong>g Use of improved water Censussafe dr<strong>in</strong>k<strong>in</strong>g water (PRSP improved sources for dr<strong>in</strong>k<strong>in</strong>g Agricultural& PWMI), Use of safe sources Use of (a) piped supply, Plus RDSdr<strong>in</strong>k<strong>in</strong>g water (TSED)(b) protected source,(c) unprotected source,(d) other<strong>Water</strong> quantity Percentage of householdswith access to adequatesupplies of water with<strong>in</strong> Time taken to fetch water HBS400m (PWMI) (go, wait, collect <strong>and</strong> DHSreturn)Census(As proxy for waterAgricultural<strong>Water</strong> accessibility Percentage of households consumption <strong>and</strong> forwith access to safe dr<strong>in</strong>k<strong>in</strong>gwait<strong>in</strong>g/pressure on serviceswater with<strong>in</strong> 400m<strong>and</strong> for distance)As above but ‘adequatesupplies’ water’ with<strong>in</strong>400m (PWMI)<strong>Water</strong> reliability No <strong>in</strong>dicator Partly <strong>in</strong> HBS Use of improved source as HBS(dry season) reserve dur<strong>in</strong>g times of DHSwater <strong>in</strong>security (supply Plus RDS?break-down or dur<strong>in</strong>g dryseason)Other - management No <strong>in</strong>dicator Partly <strong>in</strong> HBS Use of (a) water supply <strong>in</strong> HBS, DHSof water supply <strong>and</strong> DHS home (b) water supply Censusmanaged by community, Agricultural(c) water supply managed byprivate <strong>in</strong>dividual or companyOther - Livelihoods No <strong>in</strong>dicator Number of people work<strong>in</strong>g Labour Forcedirectly dependent as water vendors Surveyon waterOther - Expenditure Percentage of population ✔ Household expenditure on HBS<strong>in</strong> Relation to contribut<strong>in</strong>g to water services but some water as proportion ofAffordability (PWMI) mis-classified total expenditure HBS, DHSNumber of people dependent Censuson service provided by watervendorsExcreta disposal Percentage of households with ✔ Use of improved toilet HBS, DHS(i) toilet facility (ii) access to facilities Censustoilet facilityAgriculturalPercentage of urban Use of toilet facilities (a) Plus RDS forhouseholds with (i)access to connected to sewage system healthsewage systems (ii) cesspool<strong>and</strong> (b) with cesspitempty<strong>in</strong>g (PWMI)that is emptiedSolid waste disposal Percentage of urban households ✔ but not useful Use of more hygienic waste HBSwith access to garbage disposal options disposal methods DHSfacilities (PWMI)Hygiene None Households wash<strong>in</strong>g their DHS plus RDSh<strong>and</strong>s with water <strong>and</strong> soapor ash after us<strong>in</strong>g thelatr<strong>in</strong>e48 <strong>Water</strong> <strong>and</strong> <strong>Sanitation</strong> <strong>in</strong> <strong>Tanzania</strong> 2002
Households us<strong>in</strong>g improved dr<strong>in</strong>k<strong>in</strong>g water source as ma<strong>in</strong> sourceUse/importance:Gives estimation of relative safeness of water sources used as well as somemeasure of quality with its health implications. Replaces ‘use of safe water’ as<strong>in</strong>dicator.Action required:1. F<strong>in</strong>al consensus regard<strong>in</strong>g the classification for ALL types of sources <strong>and</strong> aclear def<strong>in</strong>ition of this classification <strong>in</strong> any tra<strong>in</strong><strong>in</strong>g, survey manuals, reports.2. Ma<strong>in</strong>ta<strong>in</strong> basic DHS 99, HBS 00, Census 02 survey design. Allow for<strong>in</strong>creased use of vendors/other types of source that need classify<strong>in</strong>g wherepossible. Could exp<strong>and</strong> on ‘piped’ to allow classification of relative safenessof supply source.3. Rout<strong>in</strong>e Data Systems (Local Government Monitor<strong>in</strong>g Database <strong>and</strong> watersector <strong>in</strong>formation systems) to adopt.Sub-<strong>in</strong>dicators allowed by question format:1. Households us<strong>in</strong>g (a) piped supply, (b) protected source, (c) unprotectedsource <strong>and</strong> (d) other as ma<strong>in</strong> dr<strong>in</strong>k<strong>in</strong>g water source.2. Households dependent on water vendors for water supply3. Households with private water po<strong>in</strong>t <strong>in</strong> home or plot4. Households us<strong>in</strong>g community managed supply / privately managed supplyMeasur<strong>in</strong>g the <strong>in</strong>dicatorQ(i) What is the ma<strong>in</strong> source of dr<strong>in</strong>k<strong>in</strong>g water used by household?Piped ❏ If piped where does the water come from?Protected well/borehole❏Protected well ❏ Protected spr<strong>in</strong>g ❏Protected/covered spr<strong>in</strong>g ❏ Treated surface source ❏Unprotected (<strong>and</strong> untreated) source ❏Unprotected well ❏ Don’t know ❏Unprotected spr<strong>in</strong>g ❏ optionalSurface source(lake/dam/river/stream/pond) ❏Covered ra<strong>in</strong>water catchment ❏Uncovered ra<strong>in</strong>water catchment ❏<strong>Water</strong> vendor ❏ if water vendor or tanker truck where does thewater come from?Tanker truck❏Bottled water ❏ Piped or protected source ❏Other (please specify) ...................... Unprotected source ❏Don’t know❏(ii) Where is the source/who manages it?Into own house❏Into own yard/plot❏Into neighbours’ house/yard/plot ❏<strong>Water</strong> po<strong>in</strong>t managed by community ❏<strong>Water</strong> po<strong>in</strong>t managed by privatecompany/<strong>in</strong>dividual❏<strong>Water</strong> <strong>and</strong> <strong>Sanitation</strong> <strong>in</strong> <strong>Tanzania</strong> 200249
Notes on comparability1. Consistent with HBS, DHS <strong>and</strong> Census s<strong>in</strong>ce 1978 for piped, wells, spr<strong>in</strong>gs,surface, ra<strong>in</strong> & other2. Consistent with HBS 1991 & 2000/1 collapsed groups for piped, protected,unprotected, other.NB <strong>in</strong> classification, the analyst would have the option of either (a) add<strong>in</strong>g watervendors known to be collect<strong>in</strong>g from piped or protected source, tanker truck frompiped or protected source <strong>and</strong> bottled water <strong>in</strong>to the improved/safe watercategory (recommended) OR (b) leav<strong>in</strong>g them as other.3. Consistent with DHS 1999 which broadened categories used <strong>in</strong> previousDHS <strong>and</strong> with the Census 2002 water vendors response option.Households tak<strong>in</strong>g 30 m<strong>in</strong>utes or less to fetch water(to reach the source, collect water <strong>and</strong> return home)Use/importance:To more accurately estimate the time spent fetch<strong>in</strong>g water <strong>and</strong> ga<strong>in</strong> <strong>in</strong>dication ofthe pressure on water service po<strong>in</strong>ts <strong>and</strong> the likely level of water consumption.Note on selection of 30 m<strong>in</strong>utes: Cairncross <strong>and</strong> Feacham (1993) <strong>and</strong> DFID,1988 quote observations that <strong>in</strong>dicate a return travel time of 5 m<strong>in</strong>utes or less isnecessary for <strong>in</strong>creased water consumption. An estimated 30 m<strong>in</strong>utes is agenerous return journey time (<strong>in</strong>clud<strong>in</strong>g collect<strong>in</strong>g time) most people could takeus<strong>in</strong>g a water source 400 metres away or less (as per National <strong>Water</strong> Policy;MoWLD, 2001). The long-term aim should be to reduce this <strong>in</strong>dicator to 5m<strong>in</strong>utes <strong>in</strong> the future.Action required:1. Consensus that this should be measured <strong>in</strong> addition if necessary tohouseholds with<strong>in</strong> 400m (although we believe 400m to be very difficult tomonitor by surveys <strong>and</strong> rout<strong>in</strong>e data systems - how many VEOs measurethis?)2. DHS question word<strong>in</strong>g to be adopted for other surveys. Requires add<strong>in</strong>gquestion to HBS.Q: How long does it take you to fetch water from the ma<strong>in</strong> dr<strong>in</strong>k<strong>in</strong>gwater source (to go, wait, collect water <strong>and</strong> return)?................................ m<strong>in</strong>utesNotes on comparabilityThis is the exist<strong>in</strong>g DHS question with no change.To put this <strong>in</strong>to the HBS requires this question to be added immediately afterthe question on ma<strong>in</strong> water source used NOT with the other time <strong>and</strong> distancesto facilities as these ask for time <strong>and</strong> distance to go only to the dry season sourcenot the ma<strong>in</strong> source.Measur<strong>in</strong>g the 400mIf it is vital that 400m is measured for the National <strong>Water</strong> Policy, the cod<strong>in</strong>g forthe HBS should be altered to allow this to be recorded (the lowest distancecurrent coded <strong>in</strong> the HBS 2000/1 is less than 1km’). NOTE: This will relate todr<strong>in</strong>k<strong>in</strong>g water source <strong>in</strong> the dry season only.Comb<strong>in</strong>ation IndicatorHouseholds us<strong>in</strong>g improved ma<strong>in</strong> water source for dr<strong>in</strong>k<strong>in</strong>g that takes30 m<strong>in</strong>utes or less to fetch water from (go, wait, collect <strong>and</strong> return).50 <strong>Water</strong> <strong>and</strong> <strong>Sanitation</strong> <strong>in</strong> <strong>Tanzania</strong> 2002
Households us<strong>in</strong>g improved dr<strong>in</strong>k<strong>in</strong>g water source <strong>and</strong>/or tak<strong>in</strong>g30 m<strong>in</strong>utes or less to fetch water <strong>in</strong> times of water <strong>in</strong>securityUse:To <strong>in</strong>dicate household situation <strong>in</strong> times of water <strong>in</strong>security allow<strong>in</strong>g fordifferent types of water <strong>in</strong>security, the most common be<strong>in</strong>g dur<strong>in</strong>g dry season<strong>and</strong> when supply breaks down.Action required:<strong>Water</strong> source question repeated for alternative (or reserve) source. Note thatthis translates asQ: What alternative source does your household use for dr<strong>in</strong>k<strong>in</strong>g?Give same response options as aboveQ: When does your household use these sources?When ma<strong>in</strong> source dries up❏When ma<strong>in</strong> source breaks down❏Dur<strong>in</strong>g times of low household <strong>in</strong>come ❏Other - specify ................................................Q: How long does it take to fetch water from this alternative source(to go, wait, collect water <strong>and</strong> return)?......................................m<strong>in</strong>utesNote on comparabilityThis is an additional question for the DHS.For the HBS, the distance <strong>and</strong> time to water <strong>in</strong> the dry season question could beeither(i) modified to <strong>in</strong>clude wait<strong>in</strong>g time (note comparability with 91 <strong>and</strong> 00/1 wouldthen be lost) OR(ii) an additional l<strong>in</strong>e for how long does it take to wait <strong>and</strong> collect water (not<strong>in</strong>clud<strong>in</strong>g journey time) could be added which would allow the journey timemultiplied by 2, plus the wait<strong>in</strong>g/collect<strong>in</strong>g time to be added for an estimatedtotal fetch<strong>in</strong>g time.Proportion of household expenditure budget spent on waterUse:To track changes <strong>in</strong> household expenditure on water <strong>and</strong> the f<strong>in</strong>ancialimplications for households of burden on certa<strong>in</strong> householdsAction required:Correctly <strong>and</strong> logically classify so that different types of expenditure on waterrecorded <strong>in</strong> the household diary can be monitored. This could be simply a watercode that <strong>in</strong>cludes ALL expenditure on water for domestic use. It could also bea ‘water’ category with the follow<strong>in</strong>g sub groups• <strong>Water</strong> from water vendors• Contributions to water fund• <strong>Water</strong> bill• Costs of improv<strong>in</strong>g water sources/ OtherWe imag<strong>in</strong>e that it would have to be merged as most people just write ‘water’.The data <strong>in</strong>dicates that that classified as ‘water bills’ also <strong>in</strong>cludes contributions<strong>and</strong> some vendors.<strong>Water</strong> <strong>and</strong> <strong>Sanitation</strong> <strong>in</strong> <strong>Tanzania</strong> 200251
Households us<strong>in</strong>g improved toilet facilitiesHouseholds us<strong>in</strong>g toilet facilities (a) connected to sewage system<strong>and</strong> (b) with cesspit that is emptiedUse:To <strong>in</strong>dicate more hygienic methods of excreta disposal rather than just whethera household has or uses a toilet facility.Changes needed:Exp<strong>and</strong> on the ‘latr<strong>in</strong>e’ response option without los<strong>in</strong>g the ma<strong>in</strong> classification(flush, pit, none) to <strong>in</strong>clude improvements - slab, stabilised pit, vent pipe.Addition of waste disposal question (cesspit or sewerage)Amendments made to relevant RDS - eg MTUHA Health Information SystemQ: (i) What toilet facility does your household use?Flush toiletPit latr<strong>in</strong>e (traditional or improved)No facility/bush/fieldOther - specify❏❏❏❏Q: (ii) if a pit latr<strong>in</strong>e, what improvements have been made to the latr<strong>in</strong>e? (can tick more than one)None❏L<strong>in</strong>ed/stabilised pit❏Cement slab❏Vent pipe❏Durable shelter❏Q: (iii) how is the waste stored <strong>and</strong> then disposed of?Connected to sewerage systemSeptic Tank/Cesspit that can be emptied (by tanker/pump)Septic Tank/Cesspit that cannot be emptied(collapsed/not accessible)Pit that is emptied (by tanker/pump/by h<strong>and</strong> when decomposed)Pit that is filled <strong>in</strong> when fullPit that is ab<strong>and</strong>oned when full as not possible to empty or fillOther ....................................................................Don’t know❏❏❏❏❏❏❏Q: (vi) Does your household own that facility? ...................................................Yes/noNotes on comparabilityQ (i) is directly comparable with the HBS, DHS <strong>and</strong> Census surveys used <strong>in</strong> thestudy (when VIP <strong>and</strong> Latr<strong>in</strong>es are merged).The others are additions not alterations <strong>and</strong> allow a far more useful analysis.52 <strong>Water</strong> <strong>and</strong> <strong>Sanitation</strong> <strong>in</strong> <strong>Tanzania</strong> 2002
Households with h<strong>and</strong>-wash<strong>in</strong>g facilities for latr<strong>in</strong>eUse:Indication of hygiene knowledge <strong>and</strong> practiceAction required:This is a new question. Add to DHS only that currently lacks any measure ofhygiene knowledge, attitudes <strong>and</strong> practiceQ: Does your latr<strong>in</strong>e have:<strong>Water</strong> for h<strong>and</strong>wash<strong>in</strong>g<strong>Water</strong> <strong>and</strong> soap for h<strong>and</strong>wash<strong>in</strong>g<strong>Water</strong> <strong>and</strong> ash/equivalent for h<strong>and</strong>wash<strong>in</strong>gNo h<strong>and</strong>wash<strong>in</strong>g facilities❏❏❏❏Households dispos<strong>in</strong>g of rubbish by bury<strong>in</strong>g/burn<strong>in</strong>g/collectionUses:Environmental sanitationAction required:Modify exist<strong>in</strong>g HBS question to add more useful response optionsCould be added to DHS questionnaireQ: What does your household do with rubbish?Thrown outside <strong>and</strong> leftThrown outside <strong>and</strong> burntStored for collection to communal dumpStored <strong>and</strong> taken to communal dumpPut <strong>in</strong> pit <strong>and</strong> leftPut <strong>in</strong> pit <strong>and</strong> burnedPut <strong>in</strong> pit <strong>and</strong> covered❏❏❏❏❏❏❏Notes on comparabilityThis should be comparable with the current HBS survey response options ofthrown away, b<strong>in</strong>, pit which as they st<strong>and</strong> are not very useful.<strong>Water</strong> <strong>and</strong> <strong>Sanitation</strong> <strong>in</strong> <strong>Tanzania</strong> 200253
7.3 Indicators for <strong>in</strong>form<strong>in</strong>g poverty eradication strategies- whose access?By disaggregat<strong>in</strong>g the data measured for the above <strong>in</strong>dicators us<strong>in</strong>g thesuggestions below, more targeted plann<strong>in</strong>g for poverty reduction/eradicationstrategies could be achieved.Suggested levels of disaggregation for more targeted plann<strong>in</strong>gRural, Urban <strong>and</strong> Dar householdsThe disparities between rural <strong>and</strong> urban areas <strong>and</strong> between Dar es Salaam <strong>and</strong> other areas demonstrate the needto disaggregate by these strata wherever possible. At least a rural-urban disaggregation should always be applied.This should help focus attention on rural water supplies that lag beh<strong>in</strong>d urban.Regions (<strong>and</strong> where possible) districtsHouseholds<strong>in</strong> the richest <strong>and</strong> poorest expenditure qu<strong>in</strong>tiles(or households above <strong>and</strong> below the poverty l<strong>in</strong>e)Can we rely on benefits of <strong>in</strong>vestment <strong>in</strong> water <strong>and</strong> sanitation to effectively ‘trickle down’ to poor households <strong>in</strong> poorareas or should we focus our attention on key households <strong>and</strong> geographical areas, those most vulnerable to water<strong>in</strong>security <strong>and</strong> poor environmental sanitation?Are we plann<strong>in</strong>g for improved coverage figures or to improve the lives <strong>and</strong> livelihoods of those with the poorestaccess to water <strong>and</strong> sanitation facilities?As a measure of <strong>in</strong>equalities <strong>in</strong> rich <strong>and</strong> poor, expenditure qu<strong>in</strong>tiles could be used as a measure of the two extreme<strong>in</strong>come poverty b<strong>and</strong>s.Large households or those with a high dependency rateFemale headed householdsHouseholds<strong>in</strong> that are geographically remote from the decision makers at village <strong>and</strong> district levelAlthough HBS results did not show that female-headed households are worse off <strong>in</strong> terms of access to improvedwater, DHS results <strong>in</strong>dicated that their situation may be worsen<strong>in</strong>g. Both show an <strong>in</strong>creased number of femaleheadedhouseholds <strong>in</strong> the country over the 1990s. Gender disaggregation should be carried out.The HBS 2000/1 dependency ratios were not available from the NBS <strong>in</strong> time for this study <strong>and</strong> the data on thenumber of <strong>in</strong>fants <strong>and</strong> children <strong>in</strong> the household was problematic. However, the poverty analysis <strong>and</strong> many otherstudies suggest that large households are poorer (NBS <strong>and</strong> OPML, 2000). Also, the results from the study dosuggest that households headed by the elderly are less likely to use improved water sources. Look<strong>in</strong>g to the future,with the <strong>in</strong>creas<strong>in</strong>gly evident effects of HIV/AIDS on family structures, dependency ratios are likely to rise. It istherefore very important to monitor the access to water <strong>and</strong> sanitation of such groups.7.4 Tak<strong>in</strong>g it forward: possible research priorities7.4.1 Surveys <strong>and</strong> censusEASTC students can pilot the recommended questions before any modificationsmade to the questions for <strong>in</strong>clusion <strong>in</strong> the forthcom<strong>in</strong>g agricultural (2003) <strong>and</strong>demographic <strong>and</strong> health surveys (2004).Results from the Census 2002 should be <strong>in</strong>corporated <strong>in</strong>to this study (whendatasets are cleaned <strong>and</strong> completely ready for use - learn<strong>in</strong>g from ourexperiences this time!) to allow a District level analysis of households us<strong>in</strong>gimproved water sources <strong>and</strong> us<strong>in</strong>g a toilet facility.7.4.2 Rout<strong>in</strong>e Data SystemsSurvey <strong>in</strong>dicators <strong>and</strong> data collection questions <strong>and</strong> response options need to besynchronised - where appropriate <strong>and</strong> feasible - with rout<strong>in</strong>e data systems.Trials have been suggested with the Local Government Reform Monitor<strong>in</strong>gDatabase through <strong>Water</strong>Aid <strong>and</strong> UAPP’s work <strong>in</strong> S<strong>in</strong>gida Urban.54 <strong>Water</strong> <strong>and</strong> <strong>Sanitation</strong> <strong>in</strong> <strong>Tanzania</strong> 2002
7.4.3 Qualitative researchThe surveys clearly do not <strong>and</strong> cannot ever fulfil all the <strong>in</strong>formationrequirements of the sector for <strong>in</strong>form<strong>in</strong>g anti-poverty strategies <strong>in</strong> <strong>Tanzania</strong>,even if coupled with comprehensive rout<strong>in</strong>e data systems produc<strong>in</strong>g qualitydata.The voices of poor people <strong>in</strong> <strong>Tanzania</strong> need to reach decision makers throughother means that l<strong>in</strong>k micro level experiences to macro (<strong>and</strong> meso <strong>in</strong> the contextof decentralisation) policy, plans <strong>and</strong> budgets. These need to address WHY theobserved trends are occurr<strong>in</strong>g so that barriers to universal access to water <strong>and</strong>sanitation can be identified <strong>and</strong> more effective strategies to remove themdesigned. Possible areas for further research are:• Who are the water poor? Ma<strong>in</strong>ta<strong>in</strong><strong>in</strong>g the household as a unit, are elderlyheaded households, households remote from the village (<strong>and</strong> perhapsDistrict) centre, those with high dependency ratios the ‘water poor’? Doesparticipatory research support the survey <strong>in</strong>dication that female headedhouseholds are not worse off? What about <strong>in</strong>tra-household <strong>in</strong>equalitiesbetween men <strong>and</strong> women, children <strong>and</strong> adults, elderly <strong>and</strong> younger, less able<strong>and</strong> more able, children/family of the head of household <strong>and</strong> others? Do weneed to conceptualise ‘water poverty’ <strong>and</strong> its manifestations?• <strong>Water</strong> <strong>and</strong> education explor<strong>in</strong>g further the l<strong>in</strong>ks between school attendance<strong>and</strong> proximity to water, for example.• <strong>Water</strong> <strong>and</strong> <strong>in</strong>come poverty what are the l<strong>in</strong>kages?7.4.4 Tak<strong>in</strong>g on the challenges as a coalitionThe study was carried out by a work<strong>in</strong>g team <strong>in</strong> consultation with key water <strong>and</strong>sanitation stakeholders from M<strong>in</strong>istries, UN agencies, Civil Society <strong>and</strong>research <strong>in</strong>stitutions <strong>in</strong> <strong>Tanzania</strong>. Early on this ‘advisory team’ agreed that thisstudy was just the beg<strong>in</strong>n<strong>in</strong>g of longer-term <strong>and</strong> broader jo<strong>in</strong>t work on these <strong>and</strong>other sector development issues. We look forward to further <strong>and</strong> <strong>in</strong>creased coord<strong>in</strong>ation<strong>and</strong> collaboration.<strong>Water</strong> <strong>and</strong> <strong>Sanitation</strong> <strong>in</strong> <strong>Tanzania</strong> 200255
ReferencesBosch, C, Hommen, K, Rubio, G.G, Sadoff, C <strong>and</strong> Travers, L (2001), <strong>Water</strong>, <strong>Sanitation</strong> <strong>and</strong> <strong>Poverty</strong>. Draft for comments,April 2001.Bureau of Statistics (1994) <strong>Tanzania</strong> <strong>in</strong> figures. Dar es Salaam: Bureau of Statistics, President’s Office- Plann<strong>in</strong>gCommission.Bureau of Statistics <strong>and</strong> Macro International Inc (1997), <strong>Tanzania</strong> Demographic <strong>and</strong> Health Survey 1996. Calverton,Maryl<strong>and</strong>: National Bureau of Statistics <strong>and</strong> Macro International.Bureau of Statistics <strong>and</strong> Macro International Inc (1995), <strong>Tanzania</strong> Demographic <strong>and</strong> Health Survey 1994. Calverton,Maryl<strong>and</strong>: National Bureau of Statistics <strong>and</strong> Macro International.Bureau of Statistics <strong>and</strong> Macro International Inc (1993), <strong>Tanzania</strong> Demographic <strong>and</strong> Health Survey 1991/2. Calverton,Maryl<strong>and</strong>: National Bureau of Statistics <strong>and</strong> Macro International.Cairncross, S <strong>and</strong> Feacham, R (1993) Environmental Health <strong>in</strong> the Tropics. London: Wiley, 2nd edition.Carvalho, S <strong>and</strong> White, H (1997), Comb<strong>in</strong><strong>in</strong>g the quantitative <strong>and</strong> qualitative approaches to poverty measurement <strong>and</strong>analysis: the practice <strong>and</strong> the potential. World Bank Technical Paper No 336. Wash<strong>in</strong>gton, DC. In Appleton, S<strong>and</strong> Booth, D (2001), Comb<strong>in</strong><strong>in</strong>g Participatory <strong>and</strong> Survey-based Approaches to <strong>Poverty</strong> Monitor<strong>in</strong>g <strong>and</strong>Analysis Background paper for the Workdhops to be held <strong>in</strong> Entebbe, Ug<strong>and</strong>a, 30 May-1 June 2001. Seconddraft.Dar es Salaam City Commission (1999), Strategic Urban Development Plann<strong>in</strong>g Framework for the city of Dar es Salaam.Stakeholders’ Edition of August 1999: Draft.Department for International Development (DFID) (2001), Address<strong>in</strong>g the water crisis: healthier <strong>and</strong> more productivelives for poor people. London, UK: DFID.Department for International Development (1998) Guidance Manual on <strong>Water</strong> <strong>and</strong> <strong>Sanitation</strong> Programmes. London:DFID.Department of Policy <strong>and</strong> Plann<strong>in</strong>g, M<strong>in</strong>istry of <strong>Water</strong> <strong>and</strong> Livestock Development (DPP-MoWLD) (2002), personalcommunication with Plann<strong>in</strong>g Officers <strong>and</strong> Director of Policy <strong>and</strong> Plann<strong>in</strong>g)Jamhuri ya Muungana wa <strong>Tanzania</strong> (2001), Hotuba ya Waziri wa Maji na Maendeleo ya Mifugo Mhe Edward Lowasa (Mb)akiwasilisha katika Bunge Makadirio ya Matumizi ya Fedha ya Wizara ya Maji na Maendeleo ya Mifugo kwaMwaka 2001/2 (M<strong>in</strong>ister’s budget speech)Jamhuri ya Muungana wa <strong>Tanzania</strong> (2000), Hotuba ya Waziri wa Maji Mhe Alhaj Mussa S K Nkhangaa (Mb) akiwasilishakatika Bunge Makadirio ya Matumizi ya Fedha ya Wizara ya Maji kwa Mwaka 2000/1 (M<strong>in</strong>ister’s budgetspeech)Jamhuri ya Muungana wa <strong>Tanzania</strong> (1998), Hotuba ya Waziri wa Maji Mhe Balozi Dk Pius Y Ng’w<strong>and</strong>u (Mb) akiwasilishakatika Bunge Makadirio ya Matumizi ya Fedha ya Wizara ya Maji kwa Mwaka 1998/1999 (M<strong>in</strong>ister’s budgetspeech)Jamhuri ya Muungana wa <strong>Tanzania</strong> (1996), Hotuba ya Waziri wa Maji Mhe Balozi Dk Pius Y Ng’w<strong>and</strong>u (Mb) akiwasilishakatika Bunge Makadirio ya Matumizi ya Fedha ya Wizara ya Maji kwa Mwaka 1996/1997 (M<strong>in</strong>ister’s budgetspeech)Jamhuri ya Muungana wa <strong>Tanzania</strong> (1992), Hotuba ya Waziri wa Maji, Nishati na Mad<strong>in</strong>i, Mhe Luteni Kanali JakayaMrisho Kikwete (Mb) akiwasilisha katika Bunge Makadirio ya Matumizi ya Fedha ya Wizara kwa Mwaka1992/1993 (M<strong>in</strong>ister’s budget speech)56 <strong>Water</strong> <strong>and</strong> <strong>Sanitation</strong> <strong>in</strong> <strong>Tanzania</strong> 2002
Jamhuri ya Muungana wa <strong>Tanzania</strong> (1988), Hotuba ya Waziri wa Maji Ndugu Dk Pius Y Ng’w<strong>and</strong>u (Mb) akiwasilishakatika Bunge Makadirio ya Matumizi ya Fedha kwa Mwaka 1988/89. (M<strong>in</strong>ister’s budget speech)Jamhuri ya Muungana wa <strong>Tanzania</strong> (1986), Hotuba ya Waziri wa Ardhi, Maji, Nyumba na Maendeleo Mij<strong>in</strong>i, Ndugu DkPius Y Ng’w<strong>and</strong>u (Mb) akiwasilisha katika Bunge Makadirio ya Matumizi ya Fedha kwa Mwaka 1986/87.(M<strong>in</strong>ister’s budget speech)M<strong>in</strong>istry of F<strong>in</strong>ance (2002) MTEF Budget Guidel<strong>in</strong>es 2003-4M<strong>in</strong>istry of <strong>Water</strong> <strong>and</strong> Livestock Development (MoWLDa) (2002), Public Expenditure Review (PER) for F<strong>in</strong>ancial Year2002/3 DRAFT. Dar es Salaam: Economic Research Bureau.M<strong>in</strong>istry of <strong>Water</strong> <strong>and</strong> Livestock Development (2002b) Medium Term Expenditure Framework 2002-3M<strong>in</strong>istry of <strong>Water</strong> <strong>and</strong> Livestock Development (MoWLD) (2001a), National <strong>Water</strong> Policy - AUGUST 2001 DRAFTM<strong>in</strong>istry of <strong>Water</strong> <strong>and</strong> Livestock Development, (2001b) Medium Term Expenditure Framework 2001-2Narayan, D (1997), Voices of the Poor: <strong>Poverty</strong> <strong>and</strong> Social Capital <strong>in</strong> <strong>Tanzania</strong>, Environmentally <strong>and</strong> Socially Susta<strong>in</strong>ableDevelopment Studies <strong>and</strong> Monograph Series 20. Wash<strong>in</strong>gton: World Bank.National Bureau of Statistics (NBS) <strong>and</strong> Macro International Inc (2000), <strong>Tanzania</strong> Reproductive <strong>and</strong> Child Health Survey1999. Calverton, Maryl<strong>and</strong>: National Bureau of Statistics <strong>and</strong> Macro International Inc.National Bureau of Statistics (NBS) <strong>and</strong> Oxford Policy Management Limited (OPML), 2000. Develop<strong>in</strong>g a <strong>Poverty</strong>Basel<strong>in</strong>e <strong>in</strong> <strong>Tanzania</strong>. Dar es Salaam.Owens, T (2002), Analysis of the <strong>Tanzania</strong>n Household Budget Survey - Income <strong>Poverty</strong>. Technical note <strong>in</strong> estimat<strong>in</strong>gpoverty levels, March 2002. Unpublished.TASAF (2000), <strong>Tanzania</strong> Social Action Fund Operational Manual. TASAF Management Unit, Dar es Salaam.Therkildsen, O (1988) <strong>Water</strong><strong>in</strong>g White Elephants? Lessons from Donor funded Plann<strong>in</strong>g <strong>and</strong> Implementation of Rural<strong>Water</strong> Supplies <strong>in</strong> <strong>Tanzania</strong>, Centre for Development Research Publications 7. Uppsala Sc<strong>and</strong><strong>in</strong>avian Instituteof African StudiesTsikata, Y <strong>and</strong> Mbil<strong>in</strong>yi, M (2001), Towards a research framework for poverty monitor<strong>in</strong>g <strong>in</strong> <strong>Tanzania</strong>. Dar es Salaam:Economic <strong>and</strong> Social Research Foundation.United Nations (2001) Item 40 of the provisional agenda - Follow Up to the outcome of the Millennium Summit, UnitedNations General Assembly 56th Session.United Republic of <strong>Tanzania</strong> (2001a), <strong>Poverty</strong> Monitor<strong>in</strong>g Master Plan. Dar es Salaam: Government Pr<strong>in</strong>ter.United Republic of <strong>Tanzania</strong> (2001b) <strong>Poverty</strong> Reduction Strategy Paper Progress Report 2000/1. Dar es Salaam.United Republic of <strong>Tanzania</strong> (2000), <strong>Poverty</strong> Reduction Strategy Paper (PRSP). Dar es Salaam: Government Pr<strong>in</strong>ter.United Republic of <strong>Tanzania</strong> (1999), <strong>Poverty</strong> <strong>and</strong> Welfare Monitor<strong>in</strong>g Indicators. Dar es Salaam: Vice President’s Office.United Republic of <strong>Tanzania</strong> (1997), National <strong>Poverty</strong> Eradication Strategy. Dar es Salaam: Government Pr<strong>in</strong>ter.United Republic of <strong>Tanzania</strong> (1996), Household Budget Survey 1991/2: Volume IV Household Characteristics (<strong>Tanzania</strong>Ma<strong>in</strong>l<strong>and</strong>). Dar es Salaam: Bureau of Statistics, President’s Office- Plann<strong>in</strong>g Commission.United Republic of <strong>Tanzania</strong> (1994a), Household Budget Survey 1991/2: Volume III Hous<strong>in</strong>g Conditions (<strong>Tanzania</strong>Ma<strong>in</strong>l<strong>and</strong>). Dar es Salaam: Bureau of Statistics, President’s Office- Plann<strong>in</strong>g Commission.United Republic of <strong>Tanzania</strong> (1994b), 1988 Population Census National Profile: the Population of <strong>Tanzania</strong> - AnalyticalReport. Dar es Salaam: Bureau of Statistics, President’s Office- Plann<strong>in</strong>g Commission.<strong>Water</strong> <strong>and</strong> <strong>Sanitation</strong> <strong>in</strong> <strong>Tanzania</strong> 200257
United Republic of <strong>Tanzania</strong> (1993), Household Budget Survey 1991/2: Volume II Methodology (<strong>Tanzania</strong> Ma<strong>in</strong>l<strong>and</strong>). Dares Salaam: Bureau of Statistics, President’s Office- Plann<strong>in</strong>g Commission.United Republic of <strong>Tanzania</strong> (1992), Household Budget Survey 1991/2: Volume I Prelim<strong>in</strong>ary Report (<strong>Tanzania</strong>Ma<strong>in</strong>l<strong>and</strong>). Dar es Salaam: Bureau of Statistics, President’s Office- Plann<strong>in</strong>g Commission.United Republic of <strong>Tanzania</strong> (1988a), 1988 Population Census - Methodology. Dar es Salaam: Bureau of Statistics,President’s Office- Plann<strong>in</strong>g Commission.United Republic of <strong>Tanzania</strong> (1988b), 1988 Population Census - Basic Demographic <strong>and</strong> Socio-Economic Characteristics.Dar es Salaam: Bureau of Statistics, President’s Office- Plann<strong>in</strong>g Commission.United Republic of <strong>Tanzania</strong> (1987), Statement of the M<strong>in</strong>ister of <strong>Water</strong>, Hon Dr Pius Y Ng’w<strong>and</strong>u (MP) made dur<strong>in</strong>g thepresentation of the National Assembly of Estimate of Expenditure for the M<strong>in</strong>istry of <strong>Water</strong> for the Year1998/8.United Republic of <strong>Tanzania</strong> (1985), Household Budget Survey 1976-7: Volume III Methodology. Dar es Salaam: Bureauof Statistics, M<strong>in</strong>istry of Plann<strong>in</strong>g <strong>and</strong> Economic Affairs.United Republic of <strong>Tanzania</strong> (1983), Household Budget Survey 1976-7: Volume I Hous<strong>in</strong>g Conditions. Dar es Salaam:Bureau of Statistics, M<strong>in</strong>istry of Plann<strong>in</strong>g <strong>and</strong> Economic Affairs.United Republic of <strong>Tanzania</strong> (1971a), Household Budget Survey 1969: Volume II Income <strong>and</strong> Consumption. Dar esSalaam: Bureau of Statistics, M<strong>in</strong>istry of Economic Affairs <strong>and</strong> Development Plann<strong>in</strong>g.United Republic of <strong>Tanzania</strong> (1971b), Household Budget Survey 1969: Volume I Hous<strong>in</strong>g Conditions. Bureau of Statistics,M<strong>in</strong>istry of Economic Affairs <strong>and</strong> Development Plann<strong>in</strong>g, Dar es Salaam.Urban Authorities Partnership Programme (2001), CWIQ - 2000/1 Basel<strong>in</strong>e Welfare <strong>and</strong> <strong>Poverty</strong> Survey - Summary ofResults from S<strong>in</strong>gida, Mtwara <strong>and</strong> Mbeya. <strong>Tanzania</strong> Development Research Group.<strong>Water</strong>Aid-<strong>Tanzania</strong> (2000) <strong>Tanzania</strong> Look<strong>in</strong>g Back: A participatory impact assessment of older water supply <strong>and</strong>sanitation improvement projects supported by <strong>Water</strong>Aid <strong>in</strong> selected villages <strong>in</strong> Dodoma Region <strong>in</strong> <strong>Tanzania</strong>.Dodoma: <strong>Water</strong>Aid <strong>Tanzania</strong>.World Bank (2000), <strong>Tanzania</strong> Data Profile <strong>in</strong> World Development Indicators database,http://devdata.worldbank.org/external/dgprofile.asp?rmdk=82581&w=0&L=E58 <strong>Water</strong> <strong>and</strong> <strong>Sanitation</strong> <strong>in</strong> <strong>Tanzania</strong> 2002
DatasetsDemographic <strong>and</strong> Health Survey 1991/2 - from Macro International, www.measuredhs.comDemographic <strong>and</strong> Health Survey 1994- from Macro International, www.measuredhs.comDemographic <strong>and</strong> Health Survey 1996- from Macro International, www.measuredhs.comDemographic <strong>and</strong> Health Survey 1999- from Macro International, www.measuredhs.comHousehold Budget Survey 1991 - from National Bureau of Statistics, Dar es SalaamHousehold Budget Survey 2000/1- from National Bureau of Statistics, Dar es Salaam<strong>Water</strong> <strong>and</strong> <strong>Sanitation</strong> <strong>in</strong> <strong>Tanzania</strong> 200259
Appendices(Number<strong>in</strong>g relates to section <strong>in</strong> report)1.2.1 Data <strong>and</strong> <strong>in</strong>formation flow through the water <strong>and</strong> sanitation sector from community level to the national povertymonitor<strong>in</strong>g system - with <strong>in</strong>dicator use <strong>and</strong> databases <strong>in</strong> existence marked1.3.1 Indicators for <strong>Water</strong> <strong>and</strong> <strong>Sanitation</strong> <strong>and</strong> their measurement (or non-measurement) by the rout<strong>in</strong>e data <strong>and</strong> surveydata collection systems as reviewed by the Stakeholder Workshop, 14th September, Ubungo Maji, Dar es Salaam.2.1.1 Surveys used <strong>in</strong> study <strong>and</strong> their relevant variables for analysis2.1.2 <strong>Water</strong> <strong>and</strong> environmental sanitation <strong>in</strong>dicators measurable by the surveys3.2.2 Government budget speeches’ figures for water coverage60 <strong>Water</strong> <strong>and</strong> <strong>Sanitation</strong> <strong>in</strong> <strong>Tanzania</strong> 2002
APPENDIX 1.2.1. Data <strong>and</strong> <strong>in</strong>formation flow through the water <strong>and</strong> sanitation sector from comunity level to the national levelpoverty monitor<strong>in</strong>g system - with <strong>in</strong>dicator use <strong>and</strong> databases <strong>in</strong> existence markedNational level Surveys<strong>and</strong> Census (led byNational Bureau ofStatistics)Indicators for surveys thatshould be comparable withRDS but also supplementthe RDS with otherhousehold <strong>in</strong>formationNational <strong>Poverty</strong> Monitor<strong>in</strong>g System <strong>and</strong>PRSP Technical CommitteeIndicators to see whether the strategies laid out <strong>in</strong> thePRSP/other national plans are effective for reduc<strong>in</strong>g poverty &improv<strong>in</strong>g people’s lives, <strong>and</strong> if not, how to improve them<strong>Tanzania</strong> Socio-Economic DatabaseResearch <strong>and</strong> Analysis(<strong>in</strong>clud<strong>in</strong>g academic)In-depth research might beloosely based on certa<strong>in</strong><strong>in</strong>dicatorsPrivate Sector /Civil SocietyIndicators to monitorimpact of programmesfor own use <strong>and</strong> forfeed<strong>in</strong>g <strong>in</strong>to PMSLocal Government - PO RALG(receive all data com<strong>in</strong>gfrom LGA databases)Indicators to measure theprogress of Local Govt ReformProgramme <strong>and</strong> effectiveness ofLGAs as service providersUse Local GovernmentMonitor<strong>in</strong>g databaseM<strong>in</strong>istry of <strong>Water</strong>Department of Plann<strong>in</strong>g/Programme Heads (eg RWSSP)Indicators to measure water -specific impacts on poverty.To monitor implementation <strong>and</strong>impact of the national water policy(ie different strategies employed toachieve improvements <strong>in</strong>clud<strong>in</strong>gkey programmes)M<strong>in</strong>istry of HealthPublic Health Department(responsible for sanitation)same as waterUse MTUHA databaseRegional Consultative Unit/RAS SecretariatRWE, RMO, RMCDWAC, REO, RPO-RALGPrivate SectorCivil SocietyIndicators to monitorimpact ofprogrammes forown use <strong>and</strong> forfeed<strong>in</strong>g <strong>in</strong>to PMSLocal Authority levelDWEwith <strong>Water</strong> &<strong>Sanitation</strong>database <strong>and</strong>RWSDDistrict Management Team(under DED) <strong>and</strong> District CouncilIndicators to monitor service provision(us<strong>in</strong>g LGMD) <strong>and</strong> sectoral targetsCommunityDevelopmentEducation:DEONB NOTED BREAKDOWN OFCOMMUNICATION HERE – Some<strong>in</strong>fo goes straight to M<strong>in</strong>istry, someto PROLAGHealth Officer:DMO - <strong>in</strong>cl.school healthwith HIMS(MTUHA)Data usersKEYWEOWard Development Committee(under WEO)Increased <strong>in</strong>dicator use to monitor activitiesWard CouncillorUsers & suppliersData suppliers(<strong>in</strong>creas<strong>in</strong>gly users too)Direction of data flowComm DevtExtensn WkrWECWHOKey <strong>in</strong>stitutional stage <strong>in</strong> data flowNot governmentVillage <strong>Water</strong>CommitteeVillage DevtCommSchool/HTDispensary/RMA/VillageHealth Worker<strong>Water</strong> <strong>and</strong> <strong>Sanitation</strong> <strong>in</strong> <strong>Tanzania</strong> 200261
* Note:only MoH’sMTUHA wasnationallyoperational<strong>in</strong> Sept. 01.TheMoWLD’sRural SupplyDatabase isstill underconstruction<strong>and</strong> <strong>Water</strong><strong>and</strong><strong>Sanitation</strong>Database isoperational<strong>in</strong> 3 districtsonly.APPENDIX 1.3.1. Indicators for <strong>Water</strong> <strong>and</strong> <strong>Sanitation</strong> <strong>and</strong> their measurement (or non-measurement) by Rout<strong>in</strong>e <strong>and</strong> Survey data collection systems as reviewed by Stakeholder Workshop, 14.09.01 Ubungo Maji, DSMDATA COLLECTION SOURCECensus SurveysSource of INDICATOR Local Sector Recommendations for<strong>in</strong>dicator (with source of <strong>in</strong>dicator <strong>in</strong> bracket <strong>and</strong> poverty Govt Monit’g RDS* measurementwelfare <strong>and</strong> monitor<strong>in</strong>g <strong>in</strong>dicators highlighted) Database(Mar 02)Measure? Frequency Disagg. HBS/DHS Frequency Disagg.PRSP ACCESS TO WATER ✔ but safe ‘Coverage’ ✔ 1978 National ✔ HBS HBS: 91/2, 01 HBS: Regional, Include agreed classficationPopulation with access to safe water sources not figures 1988 to Village ✔ DHS DHS: 1999 rur/Dar/urban system for safe water <strong>and</strong>clear generated (2002) DHS: rur/urban <strong>in</strong>clusion <strong>in</strong> LGMD <strong>and</strong>by M<strong>in</strong>istry watsan sector RDSHhlds/Pop with access to piped supply/ ‘Coverage’ Piped only 1978 National to ✔ HBS HBS: 91/2, o1 HBS: Regional, Include use of differentprotected wells/ protected spr<strong>in</strong>gs as ma<strong>in</strong> figures ✔ 1988 village ✔ DHS - DHS: 1999 rur/Dar/urban sources <strong>in</strong> LGRP <strong>and</strong> watsansource of dr<strong>in</strong>k<strong>in</strong>g water generated (2002) ‘piped’ <strong>in</strong> all DHS: rur/urban sector RDSby M<strong>in</strong>istry but protected<strong>in</strong> 99 onlyHhlds/ Population with access to unprotected ‘Coverage’ ✔ DHS - HBS: 91/2, o1 HBS: Regional, Include use of differentwell, unprotected spr<strong>in</strong>g, surface sources as figures ‘surface DHS: 1999 rur/Dar/urban sources <strong>in</strong> LGRP <strong>and</strong> watsanma<strong>in</strong> source of dr<strong>in</strong>k<strong>in</strong>g water generated source’ <strong>in</strong> all DHS: rur/urban sector RDSby M<strong>in</strong>istry but protectedwells etc <strong>in</strong>99 onlyPWMI Hhlds/Pop with access to (safe) dr<strong>in</strong>k<strong>in</strong>g water HBS records HBS: 91/2, o1 HBS: Regional, Modify survey to measure itsupply with<strong>in</strong> 400m with<strong>in</strong> 1km <strong>in</strong> rur/Dar/urb<strong>and</strong>ry seasonLGMD Average distance to dr<strong>in</strong>k<strong>in</strong>g water source HBS (kms) HBS: 91/2, o1 HBS: Regional, Include <strong>in</strong> watsan sector RDS(Sept 01) <strong>in</strong> dry season rur/Dar/urbanHhlds/pop with water supply po<strong>in</strong>t with<strong>in</strong> house ✔ piped only HBS: 91/2, o1 HBS: Regional, Include <strong>in</strong> watsan sector RDSor plot. HBS, Well & DHS: 1992,94 rur/Dar/urbanpiped <strong>in</strong> DHS 96 DHS: rur/urban92-6 but notcomparablewith HBSHouseholds/ Population with access to ✔ HBS one HBS: 2001 HBS: Regional, Modify surveydr<strong>in</strong>k<strong>in</strong>g water supply with<strong>in</strong> X no m<strong>in</strong>utes way only only rur/Dar/urbanAverage time spent fetch<strong>in</strong>g water ✔ DHS DHS: 1992,94 DHS: rur/urban Preferably <strong>in</strong>clude <strong>in</strong> watsan96, 99 sector RDS <strong>and</strong> specificresearchAccess to non-dr<strong>in</strong>k<strong>in</strong>g domestic water supply ✔ DHS: 1992 ✔ DHS 1992 Rural/urban Could <strong>in</strong>clude <strong>in</strong> householdwith<strong>in</strong> certa<strong>in</strong> distance/time only only survey. Include <strong>in</strong> watsansector RDS.
* Note:only MoH’sMTUHA wasnationallyoperational<strong>in</strong> Sept. 01.TheMoWLD’sRural SupplyDatabase isstill underconstruction<strong>and</strong> <strong>Water</strong><strong>and</strong><strong>Sanitation</strong>Database isoperational<strong>in</strong> 3 districtsonly.APPENDIX 1.3.1. Indicators for <strong>Water</strong> <strong>and</strong> <strong>Sanitation</strong> <strong>and</strong> their measurement (or non-measurement) by Rout<strong>in</strong>e <strong>and</strong> Survey data collection systems as reviewed by Stakeholder Workshop, 14.09.01 Ubungo Maji, DSMDATA COLLECTION SOURCEINDICATOR LGRP Sector Census SurveysRecommendations forRDS* Measure? Frequency Disagg. HBS/DHS Frequency Disagg. measurementSchool children with access to clean <strong>and</strong>relatively safe water source with<strong>in</strong> schoolgroundsIn Education RDS – EMIS. InLGRP <strong>and</strong>/or watsan RDSHealth cl<strong>in</strong>ic/hospital with clean <strong>and</strong>relatively safe water source with<strong>in</strong> groundsIn Health RDS – HMIS/MTUHAIn LGMD/other RDSHouseholds where a) women, b) girl children,c)boy children, d) men, e)elderly…arecollect<strong>in</strong>g waterPreferably <strong>in</strong>clude <strong>in</strong> watsansector RDS <strong>and</strong> surveysHouseholds collect<strong>in</strong>g water by: a) foot, b)bicycle, c) h<strong>and</strong> pulled trolley, d) animalpulledcart, e)motor vehicle, f) otherPreferably <strong>in</strong>clude <strong>in</strong> watsansector RDS <strong>and</strong> surveysHouseholds stor<strong>in</strong>g dr<strong>in</strong>k<strong>in</strong>g water <strong>in</strong> a) openbucket, b) open water jar/pot, c)water jar/potwith lid, d)bottle, e)otherPreferably <strong>in</strong>clude <strong>in</strong> watsansector RDS <strong>and</strong> surveysHouseholds a) filter<strong>in</strong>g, b)boil<strong>in</strong>g,c)chemically purify<strong>in</strong>g d) other method, e)nottreat<strong>in</strong>g dr<strong>in</strong>k<strong>in</strong>g waterPreferably <strong>in</strong>clude <strong>in</strong> watsansector RDS <strong>and</strong> surveysPWMIACCESS TO ENVIR SANITATIONHouseholds with a toilet facility/ Householdswith access to a toilet facility✔1978 1988(2002)National tovillage✔ HBSDHSHBS 91/2, 01,DHS 1992, 94,96HBS: Regionl,rur/Dar/urbanDHS: rur/urbanInclude <strong>in</strong> watsan <strong>and</strong>/or healthsector RDSHouseholds/Population with access to flush toilet(from data)Households/Population with access to VIP latr<strong>in</strong>e(from data)Households/Population with access to traditionalpit latr<strong>in</strong>e (from data)Households/Population us<strong>in</strong>g field/bush/no toiletfacilities (from data)Households/population us<strong>in</strong>g ‘other’ toiletfacilities (from data)✔✔✔✔✔1978 1988(2002)1978 1988(2002)1978 1988(2002)1978 1988(2002)1978 1988(2002)National tovillageNational tovillageNational tovillageNational tovillageNational tovillage✔ HBSDHS✔ HBSDHS✔ HBSDHS✔ HBSDHS✔ HBSDHSHBS 91/2, 01,DHS 92-9HBS 91/2, 01,DHS 92-9HBS 91/2, 01,DHS : 92-9HBS 91/2, 01,DHS 92-9HBS 91/2, 01,DHS 92-9HBS: Regionl,rur/Dar/urbanDHS: rur/urbanHBS: Regionl,rur/Dar/urbanDHS: rur/urbanHBS: Regionl,rur/Dar/urbanDHS: rur/urbanHBS: Regionl,rur/Dar/urbanDHS: rur/urbanHBS: Regionl,rur/Dar/urbanDHS: rur/urbanInclude <strong>in</strong> watsan <strong>and</strong>/or healthsector RDSInclude <strong>in</strong> watsan <strong>and</strong>/or healthsector RDSInclude <strong>in</strong> watsan <strong>and</strong>/or healthsector RDSInclude <strong>in</strong> watsan <strong>and</strong>/or healthsector RDSInclude <strong>in</strong> watsan <strong>and</strong>/or healthsector RDSHouseholds us<strong>in</strong>g shared toilet facilities (fromdata)✔DHS(TRCHS)DHS 1992, 94,96HBS: Regionl,rur/Dar/urbanDHS: rur/urbanInclude <strong>in</strong> watsan <strong>and</strong>/or healthsector RDS
* Note:only MoH’sMTUHA wasnationallyoperational<strong>in</strong> Sept. 01.TheMoWLD’sRural SupplyDatabase isstill underconstruction<strong>and</strong> <strong>Water</strong><strong>and</strong><strong>Sanitation</strong>Database isoperational<strong>in</strong> 3 districtsonly.APPENDIX 1.3.1. Indicators for <strong>Water</strong> <strong>and</strong> <strong>Sanitation</strong> <strong>and</strong> their measurement (or non-measurement) by Rout<strong>in</strong>e <strong>and</strong> Survey data collection systems as reviewed by Stakeholder Workshop, 14.09.01 Ubungo Maji, DSMDATA COLLECTION SOURCEINDICATOR LGRP Sector Census SurveysRecommendations forRDS* Measure? Frequency Disagg. HBS/DHS Frequency Disagg. measurementPWMIPercentage of urban hhlds with access tosewage systemsInclude <strong>in</strong> watsan RDS <strong>and</strong>surveys.Households with septic tank✔ Health ✔ HealthWatsan RDS/ surveyHouseholds with piped sewage system✔ Health ✔ HealthWatsan RDS/ surveyHouseholds with other sewage system✔ HealthWatsan RDS/ surveyPWMIPercentage of urban hhlds with access tocesspool (or septic tank) empty<strong>in</strong>gInclude <strong>in</strong> watsan RDS <strong>and</strong>LGMD as District level service.PWMIPercentage of urban households with accessto (waste) disposal facilityInclude <strong>in</strong> watsan RDS <strong>and</strong>LGMD as District level serviceHouseholds with access to an improved toiletfacility with h<strong>and</strong>wash<strong>in</strong>g facilitiesWatsan RDS/ surveySchools with access to an improved toiletfacility (with h<strong>and</strong>wash<strong>in</strong>g facilities)Include <strong>in</strong> watsan & educationRDSCl<strong>in</strong>ics/hospitals with access to improvedtoilet facility (with h<strong>and</strong>wash<strong>in</strong>g facilities)Watsan/health RDSPercentage of hholds with access to garbagedisposal facilities (PWMI – urban specific)✔ HBS butresponse optionsnot goodHBS: 91/2, 01Future census <strong>and</strong> watsansector RDSHouseholds/Population dispos<strong>in</strong>g of rubbish bythrow<strong>in</strong>g it outside✔ HBSHBS: 91/2, 01Future census <strong>and</strong> watsansector RDSHouseholds/Population dispos<strong>in</strong>g of rubbish <strong>in</strong>b<strong>in</strong>s✔ HBSHBS: 91/2, 01Future census <strong>and</strong> watsansector RDSHouseholds dispos<strong>in</strong>g rubbish by burn<strong>in</strong>gHouseholds whose rubbish is collected by solidwaste management system (eg truck)Future census <strong>and</strong> watsansector RDSFuture census <strong>and</strong> watsansector RDSHEALTHIncidence of diarrhoeal disease for under 5s✔ TRCHS 2 weekrecallDHS: 1992,94, 96, 99Incidence of diarrhoeal disease for all✔ HBS 4 weekrecallHBS: 91/2, 01,Incidence of other water/san related disease: trachomaIncidence of other water/san related disease: cholera
* Note:only MoH’sMTUHA wasnationallyoperational<strong>in</strong> Sept. 01.TheMoWLD’sRural SupplyDatabase isstill underconstruction<strong>and</strong> <strong>Water</strong><strong>and</strong><strong>Sanitation</strong>Database isoperational<strong>in</strong> 3 districtsonly.APPENDIX 1.3.1. Indicators for <strong>Water</strong> <strong>and</strong> <strong>Sanitation</strong> <strong>and</strong> their measurement (or non-measurement) by Rout<strong>in</strong>e <strong>and</strong> Survey data collection systems as reviewed by Stakeholder Workshop, 14.09.01 Ubungo Maji, DSMDATA COLLECTION SOURCESOURCE OF INDICATOR LGRP Sector Census SurveysRecommendations forINDICATOR RDS* Measure? Frequency Disagg. HBS/DHS Frequency Disagg. measurementWATER AND SANITATION SERVICE PROVISION/MANAGEMENT% of council’s own funds used to construct <strong>and</strong> repairwater systems (LGRP)✔LGRP <strong>and</strong> watsan RDS% of population contribut<strong>in</strong>g to water services (PWMIs)✔ ?LGRP <strong>and</strong> watsan RDSNo. of villages with village accounts (LGRP)✔ ?LGRP <strong>and</strong> watsan RDSNo. of villages with bank accounts for water fundsLGRP <strong>and</strong> watsan RDSNo. of villages operat<strong>in</strong>g sav<strong>in</strong>gs <strong>and</strong> credit schemes orrevolv<strong>in</strong>g funds with water <strong>and</strong> sanitation accountsLGRP <strong>and</strong> watsan RDSAmount <strong>in</strong> village water fund✔ ?LGRP <strong>and</strong> watsan RDSVillage water fund <strong>in</strong>come for water fund over yearLGRP <strong>and</strong> watsan RDSVillage expenditure from water fund over yearLGRP <strong>and</strong> watsan RDSAmount contributed to water fund per month/other time periodLGRP <strong>and</strong> watsan RDSAmount paid per 20 litres of waterLGRP <strong>and</strong> watsan RDSNo. of households exempt from pay<strong>in</strong>g for water/contribut<strong>in</strong>g tofund due to eg poverty levelsLGRP <strong>and</strong> watsan RDS% of households pay<strong>in</strong>g the water fund contributionLGRP <strong>and</strong> watsan RDS% of rural water committee members who are women✔ ?LGRP <strong>and</strong> watsan RDSNo. of people per public water supply po<strong>in</strong>t (beneficiariesnot collectors)✔ ?LGRP <strong>and</strong> watsan RDSNo. of function<strong>in</strong>g sourcesa) All year round b) Wet season onlyLGRP <strong>and</strong> watsan RDSNo. of operat<strong>in</strong>g hours of water sourceLGRP <strong>and</strong> watsan RDSNo. of private connections <strong>in</strong> village/street (household use)LGRP <strong>and</strong> watsan RDSNo. of private connections <strong>in</strong> village/street for water vend<strong>in</strong>gLGRP <strong>and</strong> watsan RDSIndicator about state of privatisation <strong>in</strong> the District (to bedeveloped)LGRP <strong>and</strong> watsan RDSAvailability of spares/tools/services with<strong>in</strong> village <strong>and</strong>with<strong>in</strong> districtLGRP <strong>and</strong> watsan RDS
APPENDIX 2.1.1. Surveys used <strong>in</strong> study <strong>and</strong> the relevent variables for analysisHOUSEHOLD BUDGET SURVEY1991Carried out:Focus:Format:Sample:Comments:Held:1991Includes: measur<strong>in</strong>g liv<strong>in</strong>g conditions of private households <strong>in</strong> Tz <strong>and</strong> benchmarkpoverty dataHousehold survey with: 1) household questionnaire (household demographic <strong>and</strong>social characteristics, hous<strong>in</strong>g conditions, last year’s purchase of large consumerdurables, asset ownership <strong>and</strong> sources <strong>and</strong> receipts of annual <strong>in</strong>come <strong>in</strong> pastyear), 2) daily diary of every <strong>in</strong>come <strong>and</strong> expenditure, <strong>in</strong> cash or k<strong>in</strong>d.National, rural/dar/other urbanBased on National Master Sample (222 enum areas) which give reasonablyreliable estimates for rural areas, Dar <strong>and</strong> other urban areas. 24 households perEA, stratified <strong>in</strong>to 3 <strong>in</strong>come groups. Total sample therefore 5328 households.<strong>Poverty</strong> Basel<strong>in</strong>e (2000) used 4823 of these that are cleanNot huge survey but as been analysed for the poverty basel<strong>in</strong>e, the data is clean,<strong>in</strong>dexes have been generated <strong>and</strong> should be straightforward to use.NBS. Easily accessible.2000/1Carried out:Focus:Format:Sample:Comments:Held:2000/1Social, Demographic <strong>and</strong> Economic features of the household. Key survey asused to provide quantitative measures of <strong>in</strong>come poverty as well as the povertybasel<strong>in</strong>e for the ma<strong>in</strong>l<strong>and</strong> PRS.Household survey with: 1) household questionnaire carried out by <strong>in</strong>terviewer,2) month long diary filled <strong>in</strong> by household membersNational, rural/Dares Salaam/other urban, <strong>and</strong> regional disaggregation.Covered 20 ma<strong>in</strong>l<strong>and</strong> regions. Approx 22,000 households. Scale reduced due tof<strong>in</strong>ancial <strong>and</strong> capacity constra<strong>in</strong>ts - rural clusters cut.NPMMP identifies HBS as secondary data source for core PRSP ‘access towater’ <strong>in</strong>dicator (census ma<strong>in</strong> source). Very useful survey for water <strong>and</strong>sanitation as has distance as well as source <strong>in</strong>dicators, together with other keypoverty <strong>in</strong>dicators. Some scope for m<strong>in</strong>or improvements (given lack of space <strong>in</strong>national surveys for any particular sector) <strong>in</strong> cod<strong>in</strong>g, <strong>in</strong> <strong>in</strong>clusion of more waterspecific expenditure record<strong>in</strong>g, <strong>and</strong> <strong>in</strong> classification of sanitation facilities(notably more urban sewage <strong>and</strong> garbage disposal).NBS66 <strong>Water</strong> <strong>and</strong> <strong>Sanitation</strong> <strong>in</strong> <strong>Tanzania</strong> 2002
WATSANWATERMa<strong>in</strong> dr<strong>in</strong>k<strong>in</strong>g water supply(summarised <strong>in</strong> Pov Basel<strong>in</strong>e - needto check actual survey for details)• Private piped water <strong>in</strong> hous<strong>in</strong>gunit• Private piped water outsidehous<strong>in</strong>g unit• Piped water on neighbours’hous<strong>in</strong>g unit (Note: 2000/1 only)• Piped water on communitysupply• Ra<strong>in</strong> catchment tank• Public well (protected)• Public well (un-protected)• Private well (protected)• Private well (un-protected)• Spr<strong>in</strong>g (protected)• Spr<strong>in</strong>g (not protected)• River, dam, lake etc• OtherNearest water supply <strong>in</strong> the dryseason (dr<strong>in</strong>k<strong>in</strong>g water)• Distance <strong>in</strong> kms(
Demographic <strong>and</strong> Health Survey1996 (same variables as 1992 <strong>and</strong> 1994 though not different samples)Carried out:Focus:Format:Sample:Sample design:Sample size:Sample error1996 (July-Nov)Fertility, Family plann<strong>in</strong>g, <strong>in</strong>fant <strong>and</strong> child mortality, maternal <strong>and</strong> child health<strong>and</strong> nutrition, AIDS, female circumcision.Household survey with: 1) household questionnaire, 2) women’s questionnaire<strong>and</strong> 3) men’s questionnaireNational, rural/urban <strong>and</strong> ma<strong>in</strong>l<strong>and</strong>/Zanzibar (<strong>and</strong> Unguja/Pemba)disaggregation. Also disaggregated by zones: coastal, Northern highl<strong>and</strong>s, Lake,Central, Southern Highl<strong>and</strong>, SouthernWomen’s questionnaire gives whole country, urban/rural <strong>and</strong> zonal estimates,with some regional disaggregation. Men’s survey gives urban-rural <strong>and</strong> wholecountry estimates.Based on 1991/2 sample - 357 EA s, 262 rural, 95 urban. Wards/branches selected,then EA s with<strong>in</strong>, households listed then selected. Households selected oncontiguity (proximity) beg<strong>in</strong>n<strong>in</strong>g with r<strong>and</strong>omly selected start number (practicaldifficulties of scattered houses).7969 households <strong>in</strong>terviewed (8900 sample, 8141 occupied). 8120 women<strong>in</strong>terviewed (8501 selected aged 15-49); 2256 men <strong>in</strong>terviewed (2658 selectedaged 15-59).checks revealed some under report<strong>in</strong>g <strong>and</strong> displac<strong>in</strong>g of respondent - eg mak<strong>in</strong>gchildren over 5 so not <strong>in</strong>cluded <strong>in</strong> <strong>in</strong>fant health section or mak<strong>in</strong>g women 50rather than 49. <strong>Water</strong> data not got workload implications so might be moreaccurate (not discussed).Complex to assess st<strong>and</strong>ard error of sample as not a r<strong>and</strong>om sampl<strong>in</strong>g method.Generally, small relative st<strong>and</strong>ard error for most estimates.Comments:Can use household <strong>and</strong> <strong>in</strong>dividual women’s questionnaires as the household<strong>in</strong>formation is repeated <strong>in</strong> their oneClassification of water sources used <strong>in</strong> report:Relatively safe: piped, spr<strong>in</strong>gs, ra<strong>in</strong>waterLess safe: wells, rivers/streams/ponds/lakes/gravity (?)NOT CONSISTENT IN WRITE UP IN USE OF THE TERMS(eg wells talked of as unsafe then safe)Time taken to fetch analysed as
WATSANWATERMa<strong>in</strong> source of dr<strong>in</strong>k<strong>in</strong>g water formembers of the householdPiped water• Piped water <strong>in</strong>tohouse/yard/plot• Piped to Public/private tapWell water•Well <strong>in</strong> residence/yard/plot• Public/private wellSurface water• Spr<strong>in</strong>g• River/stream• Pond/lake• DamRa<strong>in</strong>waterOther (specify)Length of time taken to go there, getwater <strong>and</strong> come back• In m<strong>in</strong>utes• On premisesSANITATIONWhat toilet facility doeshousehold have?Flush• Own flush toilet• Shared flush toiletPit•Traditional pit toilet•Ventilated Improved Pit latr<strong>in</strong>eNo facility/bush/fieldOther (specify)OTHER POVERTY RELATEDVARIABLES FORDEMOGRAPHIC• Sex <strong>and</strong> age of head of household• Number liv<strong>in</strong>g <strong>in</strong> household• Relationship of householdmembers to head of household• Parental survivorship of children• Marital statusHEALTHDiarrhoeal <strong>in</strong>cidence• Incidence of diarrhoea <strong>in</strong> last 2weeks for children under 5 (last,next to last born <strong>and</strong> 2nd to lastborn)• Care when sick: less/same/moreoffered to dr<strong>in</strong>k <strong>and</strong> eat•Treatment of(dr<strong>in</strong>k/food/medic<strong>in</strong>e/advice)•Mother’s illness with stomachproblems dur<strong>in</strong>g last 2 weeksEDUCATION(per child): Attendance:• Ever attended school• If under 25, still <strong>in</strong> school?Atta<strong>in</strong>ment:• Highest formal school completed(
<strong>Tanzania</strong> Reproductive <strong>and</strong> Child Health Survey - DHS 19991999Carried out:Focus:Format:Sample:Comments:Held:1999Broad maternal <strong>and</strong> child health <strong>in</strong>clud<strong>in</strong>g fertility levels <strong>and</strong> preferences, familyplann<strong>in</strong>g use, childhood morbidity, knowledge <strong>and</strong> behaviour re HIV/AIDSHousehold survey with: 1) household questionnaire, 2) women’s questionnaire<strong>and</strong> 3) men’s questionnaireNational, rural/urban <strong>and</strong> ma<strong>in</strong>l<strong>and</strong>/Zanzibar disaggregation. Total of 176 censusenumeration areas selected - over sampl<strong>in</strong>g of urban areas <strong>and</strong> Zanzibar. Basedon DHS 1996 sample. 3615 households <strong>in</strong>terviewed (3826 sample) - 1192 urban<strong>and</strong> 2423 rural. 4029 women <strong>in</strong>terviewed (of 4118 aged 15-49); 3542 men<strong>in</strong>terviewed (of 3792 aged 15-59).Not a huge surveyNBS <strong>and</strong> Macro-International.WATSAN OTHER DISAGGREGATIONWATERMa<strong>in</strong> source of dr<strong>in</strong>k<strong>in</strong>g water formembers of the household• Piped water <strong>in</strong>to dwell<strong>in</strong>g• Piped <strong>in</strong>to yard/plot• Piped to Public tap• <strong>Water</strong> from open/ unprotected well• Protected dug well• Borehole/tubewell• Protected spr<strong>in</strong>g• Unprotected spr<strong>in</strong>g• Pond/river/stream• Ra<strong>in</strong>water• Tanker truck• Bottled• OtherLength of time taken to go there,get water <strong>and</strong> come back• In m<strong>in</strong>utes• On premisesSANITATIONToilet facility used by most membersof the household• Flush• Traditional pit toilet• Ventilated Improved Pit latr<strong>in</strong>e• No facility/bush/field• Other (specify)If toilet facility shared with otherhouseholdsDEMOGRAPHIC• Sex <strong>and</strong> age of head of household• Number liv<strong>in</strong>g <strong>in</strong> household• Relationship of household membersto head of householdHEALTHDiarrhoeal <strong>in</strong>cidence• Incidence of diarrhoea <strong>in</strong> last 2weeks for children under 5 (last &next to last born)• Care when sick: less/same/moreoffered to dr<strong>in</strong>k <strong>and</strong> eat• ORS use• Need for medical adviceEDUCATION(per child): Attendance:• Ever attended school• Currently attend<strong>in</strong>g• Attended at all current school year• Attended at all previous sch year• St<strong>and</strong>ard/form attended that yearAtta<strong>in</strong>ment:• Highest st<strong>and</strong>ard/form completedIncome poverty variablesConsumer goods (per household)• Electricity • Radio• TV• Fridge• Bicycle • Motorcycle• Car/truckOther: Child Labour• If children regularly help withhousehold chores like clean<strong>in</strong>g,car<strong>in</strong>g for animals, cook<strong>in</strong>g• Hours spent per day on choresGEOGRAPHICALMa<strong>in</strong>l<strong>and</strong>, ZanzibarMa<strong>in</strong>l<strong>and</strong>: urban, ruralZanzibar: Unguja, PembaDEMOGRAPHICSexAge (given <strong>in</strong> years)Possible classifications:By genderBy age• ‘Eligible’ women (aged 15-49)• ‘Eligible’ men (aged 15-59)• all children (under 18)• young children (under 5)• children under 15• youths (15 to 25??)• School aged children (often taken as7-15, could be 5-15 with nursery,could be 5-c22 given age of f<strong>in</strong>ish<strong>in</strong>gsecondary)Household heads• Women headed households• Child headed households• Elderly headed households (def<strong>in</strong>eelderly: 49/59?)70 <strong>Water</strong> <strong>and</strong> <strong>Sanitation</strong> <strong>in</strong> <strong>Tanzania</strong> 2002
Population <strong>and</strong> Hous<strong>in</strong>g CensusCensus 1988Carried out:Focus:Format:Sample design:Sample:Assessed error:Comments:Held:1988Enumeration of population <strong>and</strong> basic hous<strong>in</strong>g conditions, with a particular focuson economic activity, migration, fertility, mortality <strong>and</strong> hous<strong>in</strong>g conditions.2 questionnaires - basic <strong>and</strong> detailedEntire population covered with basic questionnaire (number <strong>in</strong> household,relationships of members, sex, age, citizenship). Longer questionnaireadm<strong>in</strong>istered to sample of households.S<strong>in</strong>gle stage sampl<strong>in</strong>g with EA s created from maps <strong>and</strong> lists done 1986-8.800 people per EA <strong>in</strong> rural areas, 400 per EA <strong>in</strong> urban. Size of sample thendeterm<strong>in</strong>ed by number of EA s <strong>in</strong> District - 30-50 selected per D <strong>in</strong> Rural Areas,50 EA s per urban District. Systematically Simple R<strong>and</strong>om Sampl<strong>in</strong>g method.National to household level disaggregation for population data, to District levelfor more detailed questionnaire results.Measurement greatest error. Sampl<strong>in</strong>g error judged to be fairly small.Highly disaggregated. Identified by NPMMP as ma<strong>in</strong> source of data for PRSPaccess to safe waterNBS. Easily accessible.NOTE: REPORT ONLY USED IN ANALYSIS AND DISAGGREGATED BYRURAL-URBAN ONLY DUE TO VARIABLES POSSIBLE FOR ANALYSISWATSAN OTHER DISAGGREGATIONWATERQuestion unknown - classification:• Piped water with<strong>in</strong>• Piped water outside• Well water with<strong>in</strong>• Well water outside• Other supply with<strong>in</strong>• Other supply outside• Not statedSANITATIONQuestion unknown• Flush toilet <strong>in</strong>side• Flush toilet outside - shared• Pit latr<strong>in</strong>e• None• Not statedNB appear <strong>in</strong> analytical reportdisagreggated by: Zanzibar, Ma<strong>in</strong>l<strong>and</strong>,total, rural, urban, all by TENURE ofthe houseDEMOGRAPHIC• Sex <strong>and</strong> age of head of hhld/ others• Household size• Relationship of hhld members tohead• Marital status• Citizenship• Survival of motherEDUCATION(per child): Attendance:• Now attend<strong>in</strong>g• Completed• Never attendedAtta<strong>in</strong>ment:• Highest level of educationcompleted (pre-primary, primary I-VIII, secondary I-VII,university/related, tra<strong>in</strong><strong>in</strong>g afterprimary, tra<strong>in</strong><strong>in</strong>g after secondaryLiteracy:• Read & write <strong>in</strong> Swahili.Economic ActivityEc statusHous<strong>in</strong>g conditions• Facilities <strong>and</strong> tenureGEOGRAPHICALMa<strong>in</strong>l<strong>and</strong>, ZanzibarRegionalBy DistrictBy Division/ward/village/hhld** for basic demog data. Detailedq’naire possible only to District level.Urban, Rural (urban-rural with<strong>in</strong>District?)DEMOGRAPHICGenderAge<strong>Water</strong> <strong>and</strong> <strong>Sanitation</strong> <strong>in</strong> <strong>Tanzania</strong> 200271
Census 2002For <strong>in</strong>formation only as not used <strong>in</strong> analysisCarried out:Focus:Format:Sample:Comments:Held:2002Enumeration of population <strong>and</strong> basic hous<strong>in</strong>g conditionsEntire population covered with basic questionnaire (number <strong>in</strong> household,relationships of members, sex, age, disability, citizenship, marital status). Longerquestionnaire adm<strong>in</strong>istered to sample of households (cover<strong>in</strong>g 25% of population)National to household level disaggregation for population data, to District level(assumed) for more detailed questionnaire results.Highly disaggregated. Identified by NPMMP as ma<strong>in</strong> source of data for PRSPaccess to safe waterNBS. Easily accessible.WATSAN OTHER DISAGGREGATIONWATERMa<strong>in</strong> source of dr<strong>in</strong>k<strong>in</strong>g water formembers of the household• Piped water• Protected well• Unprotected well• Protected spr<strong>in</strong>g• Unprotected spr<strong>in</strong>g• River/stream• Pond• Lake• Ra<strong>in</strong>water• Lambo• <strong>Water</strong> vendors• OthersSANITATIONToilet facility used by household• Flush• Traditional pit toilet• Ventilated Improved Pit toilet• No facility• OtherDEMOGRAPHIC• Sex <strong>and</strong> age of head of hhld/ others• Household size• Relationship of hhld members tohead• Marital status• Disability• Citizenship• Survival of parentsEDUCATION(per child): Attendance:• Now attend<strong>in</strong>g• Completed• Never attendedAtta<strong>in</strong>ment:• Highest level of educationcompleted (pre-primary, primary I-VIII, secondary I-VII,university/related, tra<strong>in</strong><strong>in</strong>g afterprimary, tra<strong>in</strong><strong>in</strong>g after secondaryLiteracy:• read & write <strong>in</strong> Swahili, English,both, other language, can’t.Economic Activity• Done <strong>in</strong> last 12 months• Done <strong>in</strong> last 7 days(options <strong>in</strong>clude paid/non paid fulltime/seasonal, contribut<strong>in</strong>g familyworker. Also occupation <strong>and</strong> <strong>in</strong>dustry)Hous<strong>in</strong>g conditions• Build<strong>in</strong>g materials• Number of rooms for sleep<strong>in</strong>g• Ma<strong>in</strong> source of energy forcook<strong>in</strong>g/light<strong>in</strong>gConsumer goods (per household)• Radio • Phone • Bicycle • Hoe• Wheelbarrow • Charcoal iron• Electric ironGEOGRAPHICALMa<strong>in</strong>l<strong>and</strong>, ZanzibarRegionalBy DistrictBy Division/ward/village/hhld*• for basic demog data. Detailedq’naire possible only to District level.Check.Urban, RuralDEMOGRAPHICAs other surveys <strong>and</strong> as ‘other’allows72 <strong>Water</strong> <strong>and</strong> <strong>Sanitation</strong> <strong>in</strong> <strong>Tanzania</strong> 2002
APPENDIX 2.1.2. WATER INDICATORS measurable by ma<strong>in</strong> surveysINDICATOR INDICATORSOURCE (<strong>and</strong> notes on survey measurement)HBS1976reportCensus1978reportCensus1988reportHBS1991/2dataDHS1991/2dataDHS1994dataDHS1996dataDHS(TRCHS)1999 dataHBS2000/1dataCensus2002PRSPIDT PWMI(see below)USE OF PROTECTED WATER SOURCES FOR DRINKINGPopulation with access to safe waterAs recognised <strong>in</strong> PWMIs, this is only possible if you use‘population us<strong>in</strong>g protected or improved source’ – piped,protected wells, covered spr<strong>in</strong>gs. Surveys measure this byhouseholds not population.✔✔✔✔Households with access to piped/ wells/ spr<strong>in</strong>gs/ra<strong>in</strong>water/ surface/ other as ma<strong>in</strong> source of dr<strong>in</strong>k<strong>in</strong>g water✔not surface/spr<strong>in</strong>g✔piped & wellsonly✔piped & wellsonly✔✔✔✔✔✔✔DISTANCE TO DRINKING WATER SOURCES/TIME SPENTFETCHING WATERPWMIHouseholds with access to safe dr<strong>in</strong>k<strong>in</strong>g water supplywith<strong>in</strong> a certa<strong>in</strong> distanceStates 400 m <strong>in</strong> PWMI but not possible <strong>in</strong> any of surveysdue to cod<strong>in</strong>g used✔water with<strong>in</strong>1Km✔water with<strong>in</strong>1Km✔water with<strong>in</strong>1Km(proposedLGME)Average distance to dr<strong>in</strong>k<strong>in</strong>g water source✔✔✔✔(proposedLGME)Households/population with water supply po<strong>in</strong>t with<strong>in</strong>house or plot✔✔✔✔✔Households with access to dr<strong>in</strong>k<strong>in</strong>g water supply with<strong>in</strong> Xnumber of m<strong>in</strong>utes✔m<strong>in</strong>utestaken to go,collect, return✔m<strong>in</strong>utestaken to go,collect, return✔m<strong>in</strong>utestaken to go,collect, return✔m<strong>in</strong>utestaken to go,collect, return✔to go onlyAverage time spent fetch<strong>in</strong>g water✔as above✔as above✔as above✔as above✔as aboveEXPENDITURE ON WATERPercentage of households pay<strong>in</strong>g water billPercentage of monthly household expenditure spent onwater bills✔✔Key to Surveys: HBS = Household Budget Survey, DHS = Demographic <strong>and</strong> Health Survey (TRCHS is <strong>Tanzania</strong> Reproductive & Child Health Survey.Key to Indicator Sources: PRSP = <strong>Poverty</strong> Reduction Strategy Paper (2000), PWMI = <strong>Poverty</strong> <strong>and</strong> Welfare Monitor<strong>in</strong>g Indicators (VPO, 1999) IDT = International Development Target <strong>in</strong>dicator. LGME = proposed local government monitor<strong>in</strong>g & evaluation <strong>in</strong>dicator.These are not all <strong>in</strong>cluded <strong>in</strong> these tables, only those measurable by surveys to show overlap.
APPENDIX 2.1.2. ENVIRONMENTAL SANITATION INDICATORS measurable by ma<strong>in</strong> surveysINDICATOR INDICATORSOURCE (<strong>and</strong> notes on survey measurement)HBS1976reportCensus1978reportCensus1988reportHBS1991/2dataUSE/OWNERSHIP OF TOILET FACILITIESPWMIHouseholds with(i) their own toilet facility(ii) access to a communal toilet facility✔✔Households/Population us<strong>in</strong>g flush toilet/latr<strong>in</strong>e/notoilet/otherSurveys differ on ownership <strong>and</strong> use of.✔✔ ✔ ✔PWMI urbanspecificGARBAGE DISPOSALPercentage of households with access to garbage disposalfacilitiesHBS 76 covers how garbage is disposed of after collectedfrom house. Others cover methods of disposal athousehold level (b<strong>in</strong>/pit/thrown).?notcomparablewith otherHBSs?notcomparablewith 2000/1.Useful data?Households/Population dispos<strong>in</strong>g of rubbish by throw<strong>in</strong>g itoutside✔✔Households/Population dispos<strong>in</strong>g of rubbish <strong>in</strong> b<strong>in</strong>s✔✔EXPENDITURE ON SANITATION/HYGIENEHousehold expenditure on toilet soap/ paper/ clean<strong>in</strong>gmaterials✔OTHER POVERTY AND WELFARE MONITORING INDICATORS NOT MEASURED IN SURVEYS(for <strong>in</strong>terest – the publication for PWMIs states that rout<strong>in</strong>e data is the most important source for most of them)• Percentage of households with access to adequate supplies of water with<strong>in</strong> 400mAs stated <strong>in</strong> table, no survey measures 400m. No survey measures whether supplies are ‘adequate’• Percentage of population contribut<strong>in</strong>g to water services.Not measured except as water bill.• Percentage of urban households with access to (I) sewage system (ii) cesspool empty<strong>in</strong>gNot measured.DHS1991/2dataonly forflush✔ownershipnot useDHS1994dataonly forflush✔ownershipnot useDHS1996dataonly forflush✔ownershipnot useDHS(TRCHS)1999 data✔ used bymostmembers ofhholdHBS2000/1data✔✔comparablewith 1991but usefuldata?✔✔✔Census2002✔
APPENDIX 2.1.2. Population with clean water (‘coverage’) as declared by M<strong>in</strong>ister <strong>in</strong> budget speechYEAR OFSPEECHNATIONAL CHANGE RURAL CHANGE URBANCHANGE198645.5%198719881989199044.8%1991199248.5%42.9%199319941995199648%67%199768%use piped199819992.8%68% 7%200050%68%200150%70%1986 Figure calculated from population absolutes given. Recognises ability of M<strong>in</strong>istry to reach the rema<strong>in</strong><strong>in</strong>g14.28 people (as predicted will be by 1991) is small.1987 Reports <strong>in</strong>ability to reach target of clean water for all by 1991, extend<strong>in</strong>g target to 2002. Announces thatwater services are no longer free.1988 Tell<strong>in</strong>g Parliament that water services are no longer given free <strong>in</strong> towns <strong>and</strong> villages. Donor support as19901989 NO DOCUMENT AVAILABLE1990 National aim is for all <strong>Tanzania</strong>ns to get clean water with<strong>in</strong> 400m by 2002. If all schemes were work<strong>in</strong>g,47.5% would get water.1991 NO DOCUMENT AVAILABLE1992 Actual figure of coverage is lower as 50 % of schemes not work<strong>in</strong>g reliably - (haitoi hudumaipasavyo)...given these figures is not go<strong>in</strong>g to be easy to give water to all <strong>in</strong> rural <strong>and</strong> urban areas by 2002.1993 NO DOCUMENT AVAILABLE1994 NO DOCUMENT AVAILABLE1995 Progress of water policy, creation of UWSAs, water accounts, number of wells rehabilitated.1996 Rural areas 48 % get clean water. 30% of schemes not work<strong>in</strong>g. Urban areas 67% get clean <strong>and</strong> safe water notenough water sources to cope with <strong>in</strong>-migration. Urban sewerage use about 20% <strong>in</strong> Dodoma, Arusha,Mbeya, Tabora, Mwanza, Moshi, Tanga1997 Campaign ‘Agenda for <strong>Water</strong>’ - Maji ni Uhai na Maji kwa Wote ifikapo mwaka 2002. Numbers of rural peoplewithout water services is high <strong>and</strong> the number who have service fall<strong>in</strong>g as schemes break<strong>in</strong>g down. Urban 68%covered by piped1998199920002001 Refers to Vision 2025 aim to eradicate poverty by 2025.
ReferencesJamhuri ya Muungana wa <strong>Tanzania</strong> (2001), Hotuba ya Waziri wa Maji na Maendeleo ya Mifugo Mhe Edward Lowasa (Mb)akiwasilisha katika Bunge Makadirio ya Matumizi ya Fedha ya Wizara ya Maji na Maendeleo ya Mifugo kwa Mwaka 2001/2Jamhuri ya Muungana wa <strong>Tanzania</strong> (2000), Hotuba ya Waziri wa Maji Mhe Alhaj Mussa S K Nkhangaa (Mb) akiwasilisha katikaBunge Makadirio ya Matumizi ya Fedha ya Wizara ya Maji kwa Mwaka 2000/1Jamhuri ya Muungana wa <strong>Tanzania</strong> (1999), Hotuba ya Waziri wa Maji Mhe Alhaj Mussa S K Nkhangaa (Mb) akiwasilisha katikaBunge Makadirio ya Matumizi ya Fedha ya Wizara ya Maji kwa Mwaka 1999/2000Jamhuri ya Muungana wa <strong>Tanzania</strong> (1998), Hotuba ya Waziri wa Maji Mhe Balozi Dk Pius Y Ng’w<strong>and</strong>u (Mb) akiwasilishakatika Bunge Makadirio ya Matumizi ya Fedha ya Wizara ya Maji kwa Mwaka 1998/1999Jamhuri ya Muungana wa <strong>Tanzania</strong> (1997), Hotuba ya Waziri wa Maji Mhe Balozi Dk Pius Y Ng’w<strong>and</strong>u (Mb) akiwasilishakatika Bunge Makadirio ya Matumizi ya Fedha ya Wizara ya Maji kwa Mwaka 1997/1998Jamhuri ya Muungana wa <strong>Tanzania</strong> (1996), Hotuba ya Waziri wa Maji Mhe Balozi Dk Pius Y Ng’w<strong>and</strong>u (Mb) akiwasilishakatika Bunge Makadirio ya Matumizi ya Fedha ya Wizara ya Maji kwa Mwaka 1996/1997Jamhuri ya Muungana wa <strong>Tanzania</strong> (1995), Hotuba ya Waziri wa Maji, Nishati na Mad<strong>in</strong>i, Mhe Jackson M Makweta (Mb)akiwasilisha katika Bunge Makadirio ya Matumizi ya Fedha ya Wizara ya Maji, Nishati na Mad<strong>in</strong>i kwa Mwaka 1995/1996Jamhuri ya Muungana wa <strong>Tanzania</strong> (1992), Hotuba ya Waziri wa Maji, Nishati na Mad<strong>in</strong>i, Mhe Luteni Kanali Jakaya MrishoKikwete (Mb) akiwasilisha katika Bunge Makadirio ya Matumizi ya Fedha ya Wizara kwa Mwaka 1992/1993Jamhuri ya Muungana wa <strong>Tanzania</strong> (1991), Hotuba ya Waziri wa Maji, Nishati na Mad<strong>in</strong>i, Mhe Meja Jakaya Mrisho Kikwete(Mb) akiwasilisha katika Bunge Makadirio ya Matumizi ya Fedha ya Wizara kwa Mwaka 1991/1992Jamhuri ya Muungana wa <strong>Tanzania</strong> (1988), Hotuba ya Waziri wa Maji Ndugu Dk Pius Y Ng’w<strong>and</strong>u (Mb) akiwasilisha katikaBunge Makadirio ya Matumizi ya Fedha kwa Mwaka 1988/89.United Republic of <strong>Tanzania</strong> (1987), Statement of the M<strong>in</strong>ister of <strong>Water</strong>, Hon Dr Pius Y Ng’w<strong>and</strong>u (MP) made dur<strong>in</strong>g thepresentation of the National Assesmbly of Estimate of Expenditure for the M<strong>in</strong>stry of <strong>Water</strong> for the Year 1998/8Jamhuri ya Muungana wa <strong>Tanzania</strong> (1986), Hotuba ya Waziri wa Ardhi, Maji, Nyumba na Maendeleo Mij<strong>in</strong>i, Ndugu Dk PiusY Ng’w<strong>and</strong>u (Mb) akiwasilisha katika Bunge Makadirio ya Matumizi ya Fedha kwa Mwaka 1986/87.Notes• 1992 references a 20 year evaluation (p6)• 2000 JICA <strong>and</strong> Germany <strong>in</strong> Kagera <strong>and</strong> Kigoma• 1988 <strong>and</strong> 1990 talks about donor support by region: Denmark Ir<strong>in</strong>ga, Mbeya, Ruvuma; Dutch Marogoro <strong>and</strong> Sh<strong>in</strong>yanga;F<strong>in</strong>l<strong>and</strong> Mtwara <strong>and</strong> L<strong>in</strong>di; Lutheran World Fed S<strong>in</strong>gida• 1986 donor: Sweden lake region, Norway Kigoma <strong>and</strong> Rukwa, plus other above <strong>and</strong> UNICEF (Mtwara), LWF S<strong>in</strong>gida,Christian Council of Tz Sgd, Cth Relief Service, UNICEF <strong>and</strong> FAO Sh<strong>in</strong>yanga• 2000 <strong>Water</strong>Aid gets a mention <strong>in</strong> thanks - for work <strong>in</strong> Dodoma <strong>and</strong> Mtwara ! 2001 <strong>Water</strong>Aid <strong>and</strong> Oxfam mentioned76 <strong>Water</strong> <strong>and</strong> <strong>Sanitation</strong> <strong>in</strong> <strong>Tanzania</strong> 2002