Glaeser et al 1999 Q..
Glaeser et al 1999 Q..
Glaeser et al 1999 Q..

Create successful ePaper yourself
Turn your PDF publications into a flip-book with our unique Google optimized e-Paper software.
MEASURING TRUST 813v<strong>al</strong>ue on the dropped envelopes, then we infer that the subject ismore likely to trust the anonymous strangers who will nd theapparently lost envelope.Previous research has explored both types of experimentsthat we study. The primary difference b<strong>et</strong>ween our work and mostprevious work is that we ask wh<strong>et</strong>her subject characteristicspredict the choices that subjects make in these experiments.We rst examine the predictive power of two types of surveyquestions: questions about trusting attitudes and questions aboutpast trusting behavior. In both of our games, the standardattitudin<strong>al</strong> questions gener<strong>al</strong>ly do not predict subject choices inour experiments. 4 Of ten different variants of broad attitudin<strong>al</strong>questions, none has a signicant correlation with trusting choicesin either experiment that we conducted. 5 However, we identifytwo relatively precise attitudin<strong>al</strong> questions about trusting strangersthat did predict trust in both games.Measures of past trusting behavior are b<strong>et</strong>ter than theabstract attitudin<strong>al</strong> questions in predicting subjects’ experiment<strong>al</strong>choices. An index of past trusting behavior—based on specicbehavior<strong>al</strong> questions that we developed—has a 22.4 percentcorrelation with the amount sent in the trust game, and a 14.6percent correlation with the average v<strong>al</strong>uation in the envelopedrop. These positive correlations suggest that a component oftrusting behavior may be stable across time and choice domains.We <strong>al</strong>so nd a 15.8 percent correlation (margin<strong>al</strong>ly signicant)b<strong>et</strong>ween trust in the envelope drop experiment and trust in th<strong>et</strong>wo-person trust game.Although questions about trusting attitudes do not predicttrusting behavior, such questions do appear to predict trustworthiness.An index of an individu<strong>al</strong>’s response to GSS attitudin<strong>al</strong> trustquestions has a 34 percent correlation with the amount of moneythat the individu<strong>al</strong> himself gives back. While attitudin<strong>al</strong> trustsurveys at best weakly predict any individu<strong>al</strong>’s level of trust, they maybe good at predicting the over<strong>al</strong>l level of trustworthiness in soci<strong>et</strong>y.While our primary purpose is m<strong>et</strong>hodologic<strong>al</strong>, the experi-4. This nding is consistent with numerous studies that report a lack ofcorrelation b<strong>et</strong>ween attitudes and behavior (e.g., review by Ajzen and Fishbein{1977}, <strong>al</strong>though see Kraus {1995} for a different perspective). The classic exampleis LaPiere’s {1934} nding that self-reported unwillingness to serve raci<strong>al</strong> minoritieswas inconsistent with restaurant or motel owners’ actu<strong>al</strong> behavior towardminorities.5. Because of our sm<strong>al</strong>l sample size we cannot rule out a sm<strong>al</strong>l positiverelationship b<strong>et</strong>ween the trust survey questions and trust in the experiments.
MEASURING TRUST 815Research Center’s Gener<strong>al</strong> Soci<strong>al</strong> Survey (GSS). The survey is theprimary source for U. S. evidence on trust and soci<strong>al</strong> capit<strong>al</strong>. Sinceits inception in 1972 the survey has been administered twentytimes to a sample of b<strong>et</strong>ween one and two thousand respondents.The s<strong>et</strong> of questions on the GSS changes from survey to survey,but the GSS trust question has been asked <strong>al</strong>most continuously.Subject responses to the GSS trust question are difficult tointerpr<strong>et</strong>. 8 Variation in responses might arise for numerousreasons: e.g., differences in beliefs about the trustworthiness of acommon s<strong>et</strong> of people; differences in interpr<strong>et</strong>ation of who comprises‘‘most people;’’ differences in interpr<strong>et</strong>ation of what itmeans to be able to trust someone; or differences in the ability toelicit trustworthy behavior from other people. 9 Variation may <strong>al</strong>soarise because some respondents are not willing to answer truthfullywhen asked such a question on a survey. Our experimentssuggest a new framework for interpr<strong>et</strong>ation of the GSS trustquestion.Before turning to our experiment<strong>al</strong> an<strong>al</strong>ysis, we rst discussthe standard empiric<strong>al</strong> an<strong>al</strong>ysis of the GSS trust question.Putnam {1995} and others have an<strong>al</strong>yzed the GSS data and drawntwo important conclusions. First, younger cohorts are dramatic<strong>al</strong>lyless likely to report that ‘‘most people can be trusted.’’Second, organization membership, an important measure of soci<strong>al</strong>capit<strong>al</strong>, exhibits a similar downward trend. These stylized factshave generated a substanti<strong>al</strong> debate about declining soci<strong>al</strong> capit<strong>al</strong>in the United States. Using a multiple regression framework, wereplicate these earlier ndings.Table I gives mean answers to the trust question for both theentire sample of GSS respondents and for different subpopulations.This crude evidence suggests substanti<strong>al</strong> variation inresponses by cohort, education, and race: e.g., 42.3 percent of thecohort with birth years b<strong>et</strong>ween 1911 and 1915 report that ‘‘mostpeople can be trusted,’’ compared with 30.1 percent of the cohortborn b<strong>et</strong>ween 1961 and 1965. Table I <strong>al</strong>so compares GSS data withthe responses of Harvard undergraduates who participated in ourtrust experiment: 42.6 percent of young and college-educated GSS8. Schwarz {<strong>1999</strong>} notes that <strong>al</strong>l self-reported instruments are subject todistortion, with various features of the questions such as ambiguity and formatreadily producing unintended effects on subjects’ responses.9. It seems unlikely that differences in <strong>al</strong>truism drive answers to thisquestion (<strong>al</strong>though certainly <strong>al</strong>truistic attitudes might correlate with the answersto this question).
816QUARTERLY JOURNAL OF ECONOMICSTABLE IAVERAGE LEVELS OF TRUSTQ. ‘‘Gener<strong>al</strong>ly Speaking, would you say that most people can be trusted or thatyou can’t be too careful in de<strong>al</strong>ing with people?’’Percent responding that. . .‘‘. . . most people can be trusted’’US (1972–1996): 39.9%US (White): 44.2%US (Black): 16.1%US (other races): 26.6%US (1911–1915 birthyear): 42.3%US (1961–1965 birthyear): 30.1%US (no high school diploma): 26.3%US (high school diploma): 45.0%US (college diploma): 58.5%US (college diploma, 1996): 49.7%US (college diploma and birthyear after 1965): 42.6%Harvard Undergraduates (1997) 44.4%Harvard data are from the authors’ survey.Source: The Nation<strong>al</strong> Opinion Research Center’s Gener<strong>al</strong> Soci<strong>al</strong> Survey, 1972–1994.respondents report that ‘‘most people can be trusted,’’ close to therate of 44.4 percent in our Harvard sample.Mean response rates by demographic group confound manydifferent effects in the GSS data. Table II identies these separateeffects with probit regressions that estimate how different characteristicsexplain trust. 10 The rst regression of Table II presentsour benchmark results. Trust is much lower for later cohorts. Thegap in the level of trust b<strong>et</strong>ween individu<strong>al</strong>s who were born before1915 and those who are born after 1959 is 21.4 percent. 11 Trust ismuch higher among richer and well-educated individu<strong>al</strong>s. Collegegraduates are more than 30 percent more likely to answer yes tothe trust question than high school dropouts. Blacks are 21percent less likely to say that they are trusting than whites. 12 Menare slightly more trusting. Married persons are <strong>al</strong>so more trusting.City size has a slightly negative effect on the amount of trust.Members of more educated (or we<strong>al</strong>thier) religious denominations10. Table II reports the margin<strong>al</strong> effects of the variables.11. We cannot separately identify age, cohort, and time effects, due tomulticollinearity. We identify age and cohort effects by assuming away time effects.12. The gap b<strong>et</strong>ween the races diminishes in states where blacks are less of aminority.
MEASURING TRUST 817TABLE IIGENERAL SOCIAL SURVEY RESULTSDependent variable:GSS trust(1)Organization membership(# of types of organizations)(2)22 2222 22 222 22 22 2222 22 2Born before 1915 0.2142 0.4929(0.0216) (0.0837)Born b<strong>et</strong>ween 1915 and 1929 0.1538 0.5689(0.0176) (0.0690)Born b<strong>et</strong>ween 1930 and 1944 0.1331 0.3712(0.0141) (0.0571)Born b<strong>et</strong>ween 1945 and 1959 0.0782 0.0088(0.0107) (0.0443)Age b<strong>et</strong>ween 25 and 34 0.0238 0.0686(0.0124) (0.0470)Age b<strong>et</strong>ween 35 and 44 0.0229 0.0940(0.0141) (0.0547)Age b<strong>et</strong>ween 45 and 54 0.0417 0.1250(0.0164) (0.0662)Age b<strong>et</strong>ween 55 and 64 0.0219 0.2087(0.0185) (0.0732)Age b<strong>et</strong>ween 65 and 99 0.0175 0.3004(0.0198) (0.0800)College education 0.1720 1.1743(0.0088) (0.0344)Dropout 0.1638 0.6922(0.0077) (0.0308)Log (re<strong>al</strong> income) 0.0154 0.0715(0.0051) (0.0182)Black 0.2091 0.0941(0.0093) (0.0411)M<strong>al</strong>e 0.0343 0.2562(0.0066) (0.0249)Married 0.0338 0.0802(0.0761) (0.0294)Town 0.0227 0.0734(0.0117) (0.0455)Sm<strong>al</strong>l city 0.0200 0.1174(0.0138) (0.0542)Big city 0.0505 0.2208(0.0145) (0.0575)Catholic 0.0120 0.0194(0.0098) (0.0372)Jew 0.0216 0.1356(0.0234) (0.0915)No religion 0.0041 0.5868(0.0134) (0.0533)Baptist 0.0582 0.1116(0.0103) (0.0532)M<strong>et</strong>hodist 0.0363 0.1397(0.0126) (0.0465)Lutheran 0.0749 0.1821(0.0144) (0.0532)Presbyterian 0.0842 0.3122(0.0177) (0.0638)Episcop<strong>al</strong>ian 0.0758 0.2260(0.0224) (0.0840)Constant 0.3828 1.3282(0.0762)R 2 0.0855 0.1431Observations 23867 19133Data are from the Gener<strong>al</strong> Soci<strong>al</strong> Survey, 1972–1994. Standard errors are in parentheses. Regression (1)is a probit. We report derivatives at sample means. Regression (2) is OLS. In regression (1) the constant is themean probability at mean v<strong>al</strong>ues of the explanatory variables. R 2 is pseudo R 2 for regression (1) and adjustedR 2 for regression (2). Town population is b<strong>et</strong>ween 2000 and 100,000. Sm<strong>al</strong>l City population is b<strong>et</strong>ween 100,000and 500,000. Big City population is above 500,000. The omitted category for religion is Protestant, nodenomination.
818QUARTERLY JOURNAL OF ECONOMICSreport that they are more trusting, but Jews, a relatively highlyeducated religious group, report that they are less trusting. 13Goldin and Katz {<strong>1999</strong>} nd that the proportion of residentsin an area who were Lutheran in the early part of this centurystrongly predicts current measures of soci<strong>al</strong> capit<strong>al</strong>. We nd thatthe proportion of Lutherans in a state is a strong predictor ofstate-level trust, 14 but that state effects can only explain a sm<strong>al</strong>lamount of individu<strong>al</strong> variation in trust. 15Most of these results have multiple interpr<strong>et</strong>ations. Forexample, the positive effect of education on trust might occurbecause more educated people associate with other more educatedpeople who are, for some reason, more trustworthy. 16 Alternatively,education might create individu<strong>al</strong> soci<strong>al</strong> capit<strong>al</strong> by raisingsoci<strong>al</strong> skills or because high status increases the ability to rewardand punish others.The second regression of Table II repeats this an<strong>al</strong>ysis usingmembership in nonprofession<strong>al</strong> organizations—an observable measureof soci<strong>al</strong> behavior—as the dependent variable. Specic<strong>al</strong>ly,this variable represents the number of different types of organizationsin which the individu<strong>al</strong> is a member. The correlation of thisvariable with the GSS trust measure is high, and many of thesame patterns continue to hold. For example, the basic cohort,education, and income effects remain. There are only two re<strong>al</strong>differences. Age effects peak b<strong>et</strong>ween 35 and 44, and the racedummy (Blacks 5 1) now takes a positive coefficient. 17 This raci<strong>al</strong>effect on organization membership follows from the high rate ofreligious affiliation of African-Americans.We have run similar regressions outside the United States.The positive effect of education on trust and organization membershipis close to ubiquitous. Measured trust does not, however,gener<strong>al</strong>ly decline for younger cohorts outside of the United States.We now proceed to our experiments. Putnam and others have13. La Porta <strong>et</strong> <strong>al</strong>. {1997} argue that hierarchic<strong>al</strong> religions reduce soci<strong>al</strong>capit<strong>al</strong> at the country level because the operation of these religions entails lesscooperative interaction b<strong>et</strong>ween lay people. We see no evidence for this in theUnited States. Iannaccone {1991} argues that religion serves a large soci<strong>al</strong>purpose, and we might expect to nd signicantly more trust among members ofparticular religious groups (see <strong>al</strong>so <strong>Glaeser</strong> and Glendon {1998}).14. This an<strong>al</strong>ysis is available from the authors upon request.15. Percent Lutheran explains 30 percent of the variation in the mean level oftrust across states.16. For example, gener<strong>al</strong>ly acting in a trustworthy manner may be a luxurygood, which is consumed disproportionately by people with high incomes.17. This nding does not change when we control for the number of childrenin the household.
hhhMEASURING TRUST 819shown <strong>al</strong>arming cohort trends in U. S. responses to the GSS trustquestion, and we have conrmed the existence of these trends.However, it remains unclear wh<strong>et</strong>her these trends in surveyresponses accurately reect trends in soci<strong>al</strong> capit<strong>al</strong>. Our primarygo<strong>al</strong> is to understand what the survey question about trustactu<strong>al</strong>ly measures.III. SURVEY AND EXPERIMENTAL DESIGNSubjects were recruited from Harvard’s introductory economicscourse (Soci<strong>al</strong> An<strong>al</strong>ysis 10, or ‘‘Ec10’’) during the rst week ofclass. 18 Out of approximately 1000 Ec10 students, 274 agreed toparticipate, of whom 189 compl<strong>et</strong>ed <strong>al</strong>l parts of the study. 19Our experiment<strong>al</strong> procedure has three components. First,subjects are asked to ll out a survey. Three to four weeks later,subjects participate in two experiments, the ‘‘Trust Game’’ and the‘‘Envelope Drop.’’Part 1, Survey. Subjects ll out an anonymous 137-questionsurvey, which typic<strong>al</strong>ly takes 20 to 30 minutes. The rst h<strong>al</strong>f of thesurvey contains demographic and behavior<strong>al</strong> questions (e.g.,gender, parent<strong>al</strong> education, race, college activities, <strong>et</strong>c.). Thesecond h<strong>al</strong>f contains attitudin<strong>al</strong> and self-reported behavior<strong>al</strong>measures of subjects’ trustfulness and trustworthiness.The trust questions were chosen from sever<strong>al</strong> sources. In ourselection we emphasized questions from the Gener<strong>al</strong> Soci<strong>al</strong> Survey,which contains a wide range of attitudin<strong>al</strong> questions abouttrust. In addition, we designed numerous trust questions of ourown, including three questions to elicit past trusting behaviors.Such behavior<strong>al</strong> information is not elicited by any of the GSSquestions. We ask:‘‘How often do you lend money to your friends?’’‘‘How often do you lend person<strong>al</strong> possessions to yourfriends (e.g., CDs, clothes, bicycle, <strong>et</strong>c.)?’’‘‘How often do you intention<strong>al</strong>ly leave your rooming group’sh<strong>al</strong>lway door unlocked (when nobody is home)?’’A compl<strong>et</strong>e copy of our survey is available upon request.Part 2, The Trust Game. Three to four weeks after subjectsll out the survey, they come to a Harvard classroom to participate18. Our recruitment handout and <strong>al</strong>l of our other subject materi<strong>al</strong>s (e.g.,consent forms, instructions, and debrieng forms) are available upon request.19. The Ec10 students are roughly representative of Harvard undergraduates,since nearly two-thirds of the undergraduates take this course.
820QUARTERLY JOURNAL OF ECONOMICSin two experiments: the ‘‘Trust Game’’ and the ‘‘Envelope Drop.’’When communicating with the subjects, we refer, respectively, tothe ‘‘Transfer Game’’ and the ‘‘Bonus Winnings Procedure.’’ Forclarity, we use the former, more descriptive titles here.Subjects arrive at the experiment site, sign in, ll out aconsent form, and are then paired with another subject toparticipate in the ‘‘Trust Game.’’ Those who arrive tog<strong>et</strong>her andwish to play tog<strong>et</strong>her are <strong>al</strong>lowed to do so, raising the likelihoodthat subjects who know each other will be paired. 20 Others arepaired in order of arriv<strong>al</strong>. After being paired, the subjects jointlyll out a soci<strong>al</strong> connection survey, which includes nine questionsabout soci<strong>al</strong> links b<strong>et</strong>ween the subjects. For example, we ask thesubjects to produce a list of <strong>al</strong>l person<strong>al</strong> acquaintances whom theyhave in common. Subjects t<strong>al</strong>ly and report the number of nameson their joint list, but keep the actu<strong>al</strong> list of names to assureanonymity of the subjects (and their friends).After lling out the soci<strong>al</strong> connection survey, the subjects areseparated and told that they will not see each other again duringthe course of the experiment. The rest of the game (steps 1–5 below) isthen explained to the separated subjects. Then the game is played. 21In the experiment<strong>al</strong> instructions we refer to the subjects aseither RED or GREEN players. Each pair of subjects contains oneRED player and one GREEN player. In the current summary, weuse more meaningful labels: ‘‘sender’’ and ‘‘recipient.’’ The vesteps of the game are as follows.(1) The sender is given $15.(2) The recipient sends the sender a message/promise aboutthe recipient’s intended future actions in the game.(3) The sender chooses to send <strong>al</strong>l, some, or none of his/her$15 to the recipient. We refer to this transfer as the‘‘amount sent.’’(4) The experimenters double whatever the sender chooses tosend. For example, if the amount sent is $4, the recipientreceives $8, and the sender keeps $11 of the origin<strong>al</strong> $15.(5) The recipient chooses to send <strong>al</strong>l, some, or none of thereceived money back to the sender. We refer to thistransfer amount as the ‘‘amount r<strong>et</strong>urned.’’ For example,20. In a sm<strong>al</strong>l pilot study, we found that randomly paired subjects were highlyunlikely to know each other at <strong>al</strong>l. Our nonrandom pairing procedure generatesmore variation in soci<strong>al</strong> connection.21. A form<strong>al</strong> an<strong>al</strong>ysis of this game appears in an earlier version of this paper{<strong>Glaeser</strong>, Laibson, Scheinkman, and Soutter <strong>1999</strong>}.
MEASURING TRUST 821if the recipient receives $8, and the amount r<strong>et</strong>urned is $1,then the recipient g<strong>et</strong>s to keep $7, and the sender g<strong>et</strong>s tokeep $1 1 $11 5 $12.To implement this procedure, subjects write their decisions ona record she<strong>et</strong>, which is placed in a coded envelope and collectedby a subs<strong>et</strong> of experiment<strong>al</strong> assistants who never see the contentsof the envelope. The other subs<strong>et</strong> of experiment<strong>al</strong> assistants whoactu<strong>al</strong>ly open the envelopes (in a different room) never see thesubjects. Hence, subject anonymity (vis-à-vis the experimenters)is assured.We implement step (2)—which <strong>al</strong>lows the recipient to make apromise—by giving the recipient (GREEN) the opportunity tocheck one of two statements: (a) ‘‘I, person GREEN, promise torepay RED at least as much as RED sends me. For example, ifRED sends me $4, which will be doubled by the experimenters to$8, then I will repay RED at least $4,’’ or (b) ‘‘I, person GREEN,make no promise to RED.’’ 22 One of these two statements must bechecked, and no other type of message is <strong>al</strong>lowed. Our instructionsnote that promises, if made, are not binding.H<strong>al</strong>f of our pairs of subjects are given the opportunity to makea promise in the form described above. The other subjects receiveno opportunity to send a message, and no mention of a promise ismade in their experiment<strong>al</strong> instructions.Our procedure differs from the Berg-Dickhaut-McCabe {1995}experiment on which it is based in three ways. First, unlike Berg,Dickhaut, and McCabe we include a promise condition. Second,the Berg-Dickhaut-McCabe procedure guarantees that individu<strong>al</strong>subject decisions are unobservable to <strong>al</strong>l parties (i.e., both experiment<strong>al</strong>istsand other subjects). Our game only provides anonymityvis-à-vis the experimenters; the subjects know the identity ofthe other subject in their pair. This knowledge creates variation insoci<strong>al</strong> connection—some subject pairs know each other well, whileother pairs have only just m<strong>et</strong>—enabling us to d<strong>et</strong>ermine howdifferent levels of soci<strong>al</strong> connection inuence trusting behavior.However, removing subject-to-subject anonymity engenders anundesirable ancillary effect: a sharp rise in the cooperativebehavior of senders. This increased cooperation is undesirablebecause full and univers<strong>al</strong> cooperation eliminates variation in22. As we intended, <strong>al</strong>l but one of the 47 subjects who were given the chance tomake the scripted promise did so. Our investigation differentiates b<strong>et</strong>ween peoplerandomly given the opportunity to promise, not b<strong>et</strong>ween people who did promiseversus people who could have promised and did not.
822QUARTERLY JOURNAL OF ECONOMICStrusting behavior. To avoid this possibility, we deviate from theBerg-Dickhaut-McCabe experiment in a third way. We onlydouble—rather than triple—the money that the sender sends tothe recipient, thereby reducing the incentive to cooperate. 23Part 3, The Envelope Drop. After compl<strong>et</strong>ing the trust game,subjects participate in a second experiment<strong>al</strong> procedure thatprovides an addition<strong>al</strong> behavior<strong>al</strong> measure of trust. In this gamesubjects report v<strong>al</strong>uations for a series of ‘‘envelope drops.’’ Specic<strong>al</strong>ly,subjects are told that an experiment<strong>al</strong> assistant will intention<strong>al</strong>lydrop in a public place an envelope containing 10 dollarsthat is addressed to the subject. The envelope may be dropped inone of sever<strong>al</strong> different public places (e.g., Harvard Square) underone of sever<strong>al</strong> different conditions (e.g., se<strong>al</strong>ed and stamped). Foreach place and condition of the envelope drop, the subject reportsa v<strong>al</strong>uation. We believe that the subject’s v<strong>al</strong>uation of such anenvelope drop primarily measures condence that a randompedestrian in that location will r<strong>et</strong>urn the envelope to the subject(say by putting it into a mailbox). The procedure may <strong>al</strong>someasure the subject’s trust that the experimenter will carry outthe envelope drop in the rst place.To elicit truthful subject reporting, we use a standard revelationmechanism. 24 We randomly generate a payoff that is independentof the subject’s v<strong>al</strong>uation. We give the subject this payoff ifthe subject’s reported v<strong>al</strong>uation is below the payoff v<strong>al</strong>ue. If thesubject’s reported v<strong>al</strong>uation is above the payoff v<strong>al</strong>ue, we carry outthe envelope drop. We vary properties of the envelope drop (e.g.,location, time of day, stamp on envelope, envelope se<strong>al</strong>ed). Eachsubject provides v<strong>al</strong>uations for fteen different envelope dropconditions. Subjects report sensible changes in v<strong>al</strong>uations acrossconditions (see Appendix 3). We average each subject’s responsesacross the fteen different envelope conditions offered to eachsubject, and use this mean reservation v<strong>al</strong>ue as our secondmeasure of trust.We use the amount sent in the Trust Game and the meanreservation v<strong>al</strong>ue in the Envelope Drop as our two experiment<strong>al</strong>measures of trust. To measure trustworthiness, we user<strong>et</strong>urn ratio 2amount r<strong>et</strong>urned/amount available to r<strong>et</strong>urn.23. Despite this reduction in the incentive to cooperate, we still nd thatcooperation is ‘‘too’’ high: 71 percent of our sample of senders send the upper limit ofthe amount they are <strong>al</strong>lowed to send (i.e., 15 dollars).24. See Becker, DeGroot, and Marschak {1964}.
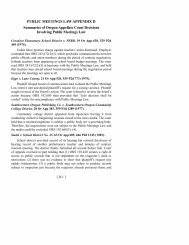
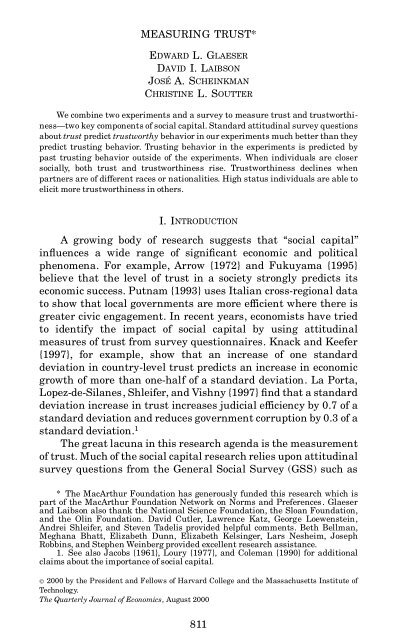
MEASURING TRUST 823Natur<strong>al</strong>ly, this ratio is only dened for subject pairs with apositive v<strong>al</strong>ue for the amount available to r<strong>et</strong>urn. Fin<strong>al</strong>ly, rec<strong>al</strong>lthat the amount available to r<strong>et</strong>urn is twice the amount sent. Aratio of less than one-h<strong>al</strong>f indicates that the sender did not receiveback as much money as he or she risked and might thus be seen ashaving been cheated by the recipient.We use this ratio as a measure of trustworthiness for tworeasons. First, r<strong>et</strong>urn ratio is <strong>al</strong>ways bounded b<strong>et</strong>ween 0 and 1,and hence is automatic<strong>al</strong>ly sc<strong>al</strong>ed. Second, in our experiment<strong>al</strong>data there is a roughly proportion<strong>al</strong> relationship b<strong>et</strong>ween amountr<strong>et</strong>urned and amount available to r<strong>et</strong>urn. We adopt this proportion<strong>al</strong>itybenchmark in our an<strong>al</strong>ysis.IV. RESULTSThe average amount sent is $12.41, which is 83 percent of themaxim<strong>al</strong> amount that could be sent ($15). Of our 96 senders, 68, or71 percent, chose to send exactly $15. However, the amount sentdata still exhibit substanti<strong>al</strong> variation, with a standard deviationof $4.54. Figure I plots the individu<strong>al</strong> data points, with amountsent on the x-axis and r<strong>et</strong>urn ratio on the y-axis. The oatingnumbers report the frequency with which a data point wasFIGURE IThe Relationship b<strong>et</strong>ween Amount Sent and Amount R<strong>et</strong>urned
824QUARTERLY JOURNAL OF ECONOMICSobserved. The average amount r<strong>et</strong>urned is $12.30, and theaverage v<strong>al</strong>ue of r<strong>et</strong>urn ratio is 45.5 percent.The average mean reservation v<strong>al</strong>ue from the Envelope Dropis norm<strong>al</strong>ized to zero. The standard deviation is $1.77. Thedistribution of mean reservation v<strong>al</strong>ues approximates a bell curvewith little or no apparent truncation at the endpoints.There exists substanti<strong>al</strong> h<strong>et</strong>erogeneity in trusting and trustworthybehavior, and our survey data enable us to identify thevariables that explain this variation. 25 The observed h<strong>et</strong>erogeneitycould arise from individu<strong>al</strong> xed effects, situation<strong>al</strong>ly speciceffects (e.g., partnership-specic attributes in the trust game), orrandom noise.We organize our an<strong>al</strong>ysis conceptu<strong>al</strong>ly. First, we identifyindividu<strong>al</strong> xed effects in trust and trustworthiness. We look for arelationship b<strong>et</strong>ween behavior in the experiments and responsesto attitudin<strong>al</strong> survey questions. We <strong>al</strong>so look for a relationshipb<strong>et</strong>ween behaviors in different situations. Second, we identify theeffects of soci<strong>al</strong> connection b<strong>et</strong>ween the sender and recipient.Third, controlling for soci<strong>al</strong> connection, we ask wh<strong>et</strong>her somesubjects tend to fare well nanci<strong>al</strong>ly in soci<strong>al</strong> interactions, perhapsbecause of status effects. Such people may be thought of ashaving individu<strong>al</strong> soci<strong>al</strong> capit<strong>al</strong>.A. Individu<strong>al</strong> Effects in Trust and TrustworthinessWe begin by looking at the level of trust our senders displaytoward their partners. In Table III we examine wh<strong>et</strong>her surveyquestions and other individu<strong>al</strong> background characteristics predictthe amount sent in the Trust Game. In <strong>al</strong>l regressions we includesix basic control variables: a promise condition dummy, a mixedgenderpair dummy, a m<strong>al</strong>e sender dummy, a nonwhite senderdummy, a freshman sender dummy, and an only child senderdummy. 26 Gener<strong>al</strong>ly, these control variables are insignicant, andtheir inclusion or exclusion does not affect any of our other results.In the rst column of Table III, we ev<strong>al</strong>uate the predictivev<strong>al</strong>ue of the GSS trust question. Senders who believe ‘‘that mostpeople can be trusted’’ send 22 cents more to their partners thansenders who believe ‘‘that you can’t be too careful in de<strong>al</strong>ing with25. Appendices 1 and 2 give the means and correlations from the survey andthe two experiments.26. The dummy variables were chosen so that approximately 50 percent of thesample had a v<strong>al</strong>ue of one for the variable. The only child dummy is an exception tothis rule.
MEASURING TRUST 825TABLE IIIAMOUNT SENT AS A FUNCTION OF SENDER CHARACTERISTICS(1) (2) (3) (4) (5)Different sexes 0.670(1.130)0.128(1.112)1.043(1.120)0.358(1.106)0.643(1.082)Promise 0.043 0.097 0.440 0.038 0.153(1.024) (1.015) (1.040) (.992) (0.995)M<strong>al</strong>e 0.147 0.623 0.028 0.457 0.013(1.197) (1.174) (1.148) (1.149) (1.138)White 0.330 0.640 0.055 0.227 0.329(1.030) (1.025) (1.031) (1.003) (1.006)Freshman 0.205 0.434 0.254 0.970 0.305(1.136) (1.125) (1.092) (1.081) (1.086)Only child 1.620 1.724 1.555 1.775 1.569(1.53) (1.474) (1.496) (1.530) (1.492)GSS trust 0.220(1.022)Trust index 0.094(0.222)Trust strangers 2.209(1.060)Trusting behaviorindex0.403(0.214)Mean reservationv<strong>al</strong>ue0.417(0.312)Constant 13.361 13.009 9.836 12.707 13.336(2.448) (1.735) (2.272) (1.648) (1.639)Adj. R 2 0.059 0.050 0.009 0.007 0.034Observations 93 90 92 93 95Standard errors are in parentheses. All regressions are ordinary least squares.people.’’ This effect is not statistic<strong>al</strong>ly distinguishable from zero.In the next regression we replace the basic GSS trust questionwith an index of responses to three GSS attitudin<strong>al</strong> questions: theorigin<strong>al</strong> GSS trust question and two addition<strong>al</strong> questions thatmeasure one’s condence in other people.GSS fair: Do you think most people would try to takeadvantage of you if they got the chance, or would they try to befair?GSS helpful: Would you say that most of the time people try tobe helpful, or that they are mostly just looking out for themselves?We form an index of responses to these questions by addingthe three variables after they are de-meaned, norm<strong>al</strong>ized by theirstandard deviations, and re-signed for comparability. Increases in
826QUARTERLY JOURNAL OF ECONOMICSthis index measure of trust insignicantly reduce the actu<strong>al</strong> levelof trust.We included twelve different attitudin<strong>al</strong> measures of trust inour survey, including two widely used multiquestion trust sc<strong>al</strong>esfrom the psychology literature: the Rosenberg {1957} Faith inPeople Sc<strong>al</strong>e (which has twelve component questions) and theRotter {1967, 1971} Interperson<strong>al</strong> Trust Sc<strong>al</strong>e (which has 25component questions). Of these twelve different attitudin<strong>al</strong> measures,<strong>al</strong>l but two have no statistic<strong>al</strong>ly signicant covariation withthe actu<strong>al</strong> amount of trust in our experiment. Trust surveyquestions at best only weakly predict trust. However, it isimportant to highlight the statistic<strong>al</strong> imprecision of these results.Some of our standard errors are quite large, including ourstandard errors for the GSS trust question. 27The two attitudin<strong>al</strong> survey questions that do signicantlypredict trusting behavior in the experiment ask specic<strong>al</strong>ly abouttrust of strangers. In column (3) in Table III we nd that subjectswho disagree with the statement ‘‘you can’t trust strangersanymore’’ are more trusting. Individu<strong>al</strong>s who disagree with thisstatement send over an average of $2.21 more than comparableindividu<strong>al</strong>s who agree with the statement. Disagreement withanother statement from our survey—‘‘when de<strong>al</strong>ing with strangers,one is b<strong>et</strong>ter off using caution before trusting them’’—is <strong>al</strong>sosignicantly correlated with the amount of trust observed in ourexperiment.There are two plausible interpr<strong>et</strong>ations of these ndings.First, among so many trust questions it is unsurprising to nd two27. Our attitudin<strong>al</strong> survey questions may not measure behavior<strong>al</strong> propensities,but may instead measure subjects’ beliefs about soci<strong>al</strong> norms. McClelland,Koestner, and Weinberger {1989} report a distinction b<strong>et</strong>ween explicit and implicitattitudes in their study of ‘‘achievement motivation.’’ Explicit responses to anattitude survey on achievement appeared to reve<strong>al</strong> beliefs about soci<strong>al</strong> norms forachievement. These self-reports did not reect durable person<strong>al</strong> commitments toaction and did not correlate with behaviors that could actu<strong>al</strong>ly enhance achievement.Rather than depending on subjects’ explicit self-reports, McClelland,Koestner, and Weinberger {1989} resorted to an implicit measure. They usedindependent judgments of the extent to which subjects’ indirectly obtained thoughtpatterns displayed associations typic<strong>al</strong> of high interest in achievement. Theexplicit measures were uncorrelated with these implicit measures, which didpredict actu<strong>al</strong> behavior. The poor performance of explicit measures may reectlimited self-knowledge, since much of the thinking process takes place outside ofconsciousness (e.g., Nisb<strong>et</strong>t and Wilson {1977} and Hirst {1998}). Alternatively,subjects may distort their self-reports for presentation<strong>al</strong> reasons. There is agrowing trend (e.g., Banaji and Greenw<strong>al</strong>d {1994}, and Greenw<strong>al</strong>d and Banaji{1995}) toward use of implicit cognitive measures. For example, Sp<strong>al</strong>ding andHardin {<strong>1999</strong>} have found behavior<strong>al</strong> links to implicit but not explicit measures ofself-esteem.
MEASURING TRUST 827that are signicant, even if the questions actu<strong>al</strong>ly have little or nopredictive v<strong>al</strong>ue. 28 Second, the attitudin<strong>al</strong> questions regardingstrangers are more precise and meaningful than compl<strong>et</strong>elygener<strong>al</strong>, nonspecic questions regarding trust. This high degree ofspecicity might make these variables genuinely more predictiv<strong>et</strong>han those of a more gener<strong>al</strong> nature. 29 To further test wh<strong>et</strong>her theconnection b<strong>et</strong>ween these variables and the amount sent is theresult of spurious correlation, we examine separately senderrecipientpairs who are composed of two strangers and those whoare composed of two friends. We nd that the questions aboutstrangers only predict the amount of trust b<strong>et</strong>ween strangers,which supports their v<strong>al</strong>idity as measures of trust. This representsour rst piece of evidence in support of the hypothesis thattrusting behavior has a component that is a persistent, individu<strong>al</strong>characteristic.In the fourth and fth regressions we examine the connectionb<strong>et</strong>ween trusting behavior reported in the survey and trust in theexperiment. The fourth regression shows the connection b<strong>et</strong>weenan index of past trusting behavior and the amount sent. This indexis a weighted average of responses to questions about lendingpossessions, lending money, and leaving your door unlocked. 30 Aone-standard-deviation increase in this variable (2.13) increasesthe dollar amount sent over by 86 cents (one-fth of a standarddeviation). In the fth regression we show a positive, but insignicant,correlation b<strong>et</strong>ween the mean reservation v<strong>al</strong>ue and theamount sent. Without controls, this relationship is signicant atthe 12.5 percent level.We have <strong>al</strong>so investigated sever<strong>al</strong> other potenti<strong>al</strong> d<strong>et</strong>erminantsof variation in the amount sent, including variation in<strong>al</strong>truism and variation in early life experiences. Our measures of28. However, the fact that the two signicant questions have similar conceptu<strong>al</strong>content suggests more than a spurious correlation.29. Declines in the attitude-behavior link occur when the level of specicity inthe survey question does not match that of the behavior under observation. Theproblem is found here in the lack of correspondence b<strong>et</strong>ween gener<strong>al</strong> GSSquestions and specic trusting behavior measured in our two experiment<strong>al</strong> games.McClelland, Koestner, and Weinberger {1989} found a similar discrepancy b<strong>et</strong>weenself-reports of gener<strong>al</strong> v<strong>al</strong>ue placed on achievement and actu<strong>al</strong> behavior toincrease achievement. The problem has been documented in other s<strong>et</strong>tings in areview by Oskamp {1991}. In a m<strong>et</strong>a-study, Kraus {1995} found that certain typesof questions tend to increase attitude-behavior correlation, including thoseaddressing direct experience and those with a focus on specic issues correspondingto the specic behavior under observation. Both of our predictive questionsme<strong>et</strong> these two criteria.30. The index is formed by de-meaning these three variables, dividing bytheir standard deviations, and summing the resulting v<strong>al</strong>ues.
828QUARTERLY JOURNAL OF ECONOMICS<strong>al</strong>truism (nanci<strong>al</strong> generosity to the poor, hours spent volunteering)do not predict amount sent and gener<strong>al</strong>ly do not affect ourother coefficient estimates. To investigate the potenti<strong>al</strong> roots oftrust, we investigate proxies for past experiences that might haveled to a cynic<strong>al</strong> or untrusting outlook (parent<strong>al</strong> divorce, childhoodviolence, <strong>et</strong>c.). These <strong>al</strong>so had no effect.In Table IV we examine the d<strong>et</strong>erminants of the level of trustin the Envelope Drop game. We include an extra control variable,lost mail, which measures the recency with which the respondentlost an item in the mail. Responses to this question take on a v<strong>al</strong>ueb<strong>et</strong>ween one (never) and four (within the last six months). Aone-standard-deviation increase in this variable (.99) predicts aTABLE IVMEAN RESERVATION VALUES AS A FUNCTION OF SUBJECT CHARACTERISTICS(1) (2) (3) (4) (5) (6)2 2 2 22 2 2 2 2 2M<strong>al</strong>e 0.1680 0.0975 0.1469 0.1923 0.1237 0.1716(0.2810) (0.2890) (0.2820) (0.2850) (0.2784) (0.2870)White 0.1599 0.1590 0.2028 0.1535 0.2036 0.1865(0.2740) (0.2810) (0.2760) (0.2780) (0.2715) (0.2860)Freshman 0.0857 0.0924 0.0633 0.0059 0.0561 0.1792(0.2880) (0.2990) (0.2880) (0.2910) (0.2844) (0.2930)Lost mail 0.2336(0.1370)0.2487(0.1390)0.2124(0.1370)0.2488(0.1380)0.2274(0.1348)0.2559(0.1380)Only child 0.0243(0.4380)0.0203(0.4400)0.2483(0.4330)GSS trust 0.2020(0.2620)Trust index 0.0396(0.0610)Trust strangers 0.6774(0.2740)Trustingbehaviorindex0.2049(0.4420)0.1354(0.0640)2 0.1443(0.4317)0.1299(0.0621)2 0.1429(0.4290)0.1324(0.0650)2 22 2Pro-transfer 0.4570(0.1448)Past windf<strong>al</strong>l 0.8779(0.2720)Constant 0.7239 0.5187 0.5439 0.4486 0.6265 1.6145(0.6360) (0.5240) (0.6680) (0.5180) (0.6092) (0.6290)Adj. R 2 0.004 0.005 0.029 0.022 0.069 0.076Observations 182 177 183 183 183 166Standard errors are in parentheses. All regressions are ordinary least squares.
MEASURING TRUST 829decline of $.22, or one-seventh of a standard deviation, in themean reservation v<strong>al</strong>ue. The impact of the lost mail variablesuggests the importance of past experiences, working presumablythrough beliefs. 31In the rst regression of Table IV, we include the basic GSStrust question. Individu<strong>al</strong>s who answer yes to this question arewilling to pay 20 cents more for the 10-dollar envelope drop. Thiseffect goes in the right direction but is not statistic<strong>al</strong>ly signicant.In regression (2) we include the index of responses to the threeGSS attitudin<strong>al</strong> questions. A one-standard-deviation increase inthis GSS index (2.22) causes an insignicant 9-cent increase inthe mean reservation v<strong>al</strong>ue. Ten of the twelve attitudin<strong>al</strong> trustmeasures that we included in our survey are not signicantlycorrelated with the mean reservation v<strong>al</strong>ue.Again, the two survey questions that specic<strong>al</strong>ly ask abouttrusting strangers positively predict trust. As regression (3)illustrates, individu<strong>al</strong>s who believe that you can trust strangersare willing to pay 68 cents more for the envelope. Again, thisresult may be spurious, but if it is re<strong>al</strong>, it suggests the presence ofstable individu<strong>al</strong> attributes that create trust.The fourth regression in Table IV shows the connectionb<strong>et</strong>ween our index of past trusting behavior and the meanreservation v<strong>al</strong>ue. This index has a modest, signicant effect. Aone-standard-deviation increase in the index raises the level ofmean reservation v<strong>al</strong>ue by 29 cents. The strongest connectionoccurs b<strong>et</strong>ween lending possessions and the mean reservationv<strong>al</strong>ue.In the fth regression we show that being in favor ofredistribution to the poor predicts one’s mean reservation v<strong>al</strong>ue. 32This may occur because dropping the envelope itself is seen as anact of charity. Alternatively, people who favor redistribution maysimply have a higher level of gener<strong>al</strong> trust or a higher level ofcondence in the behavior of individu<strong>al</strong>s with low income whomight pick up the envelope.To further explore the predictive v<strong>al</strong>ue of the redistributionquestion, we examine the inuence of this variable on subjectreservation v<strong>al</strong>ues for envelope drops in low income areas (e.g.,Centr<strong>al</strong> Square, a relatively less affluent community near Har-31. Unlike the rest of our survey questions, the lost mail question was askedafter the experiment, as part of a debrieng.32. Behavior<strong>al</strong> measures of <strong>al</strong>truism (hours spent on volunteer work ordollars given to charity) are orthogon<strong>al</strong> to this redistribution variable.
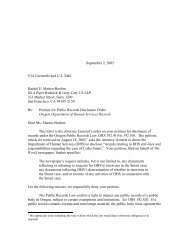
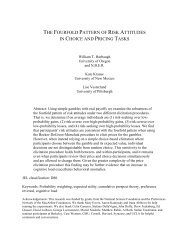
830QUARTERLY JOURNAL OF ECONOMICSvard Square) and high income areas (e.g., Harvard Square). Thestrongest connection b<strong>et</strong>ween the responses to the redistributionquestion and reservation v<strong>al</strong>ue occurs in low income areas. Indeedthere was no connection b<strong>et</strong>ween the redistribution question andreservation v<strong>al</strong>ues for the envelopes dropped in Harvard Square.Hence, subjects who favor redistribution appear either to believ<strong>et</strong>hat dropping the envelope is an act of charity when the envelopeis dropped in a low income community, or to have greatercondence in the honesty of low income individu<strong>al</strong>s who nddropped envelopes.In the sixth regression we show that there appears to be somecognitive basis for higher trust. People who say that they haveben<strong>et</strong>ed from the generosity of an anonymous stranger in thepast give more. This suggests that trust does not just reect<strong>al</strong>truism or risk tolerance, but <strong>al</strong>so beliefs about others which areformed by past experiences.Turning now from the senders’ trust, we look at the recipients’trustworthiness. In Table V we examine the effect of recipientcharacteristics on the v<strong>al</strong>ue of r<strong>et</strong>urn ratio (i.e., amount r<strong>et</strong>urneddivided by amount available to r<strong>et</strong>urn). We add the amount ofmoney sent over in the rst round (i.e., amount sent) as a controlvariable and nd that this variable has a statistic<strong>al</strong>ly signicantbut economic<strong>al</strong>ly sm<strong>al</strong>l positive effect on r<strong>et</strong>urn ratio. As Figure Ishows graphic<strong>al</strong>ly, on average recipients r<strong>et</strong>urn as much as theyare sent. This might reect reciproc<strong>al</strong> <strong>al</strong>truism as in Rabin {1993},but it might <strong>al</strong>so reect prevailing norms about fair play. 33These norms were inuenced by the promise condition.Figures II and III plot histograms of r<strong>et</strong>urn ratio v<strong>al</strong>ues for subjectpairs in the ‘‘no promise’’ and ‘‘promise’’ conditions. In the nopromise condition 48 percent of recipients r<strong>et</strong>urned exactly asmuch as they were sent. By contrast, in the promise condition 68percent of recipients r<strong>et</strong>urned exactly as much as they were sent.But on average r<strong>et</strong>urn ratio did not vary b<strong>et</strong>ween the twoconditions. Instead, the promise condition seemed to anchorresponses on the rule, ‘‘send back as much as you were sent,’’thereby reducing h<strong>et</strong>erogeneity in the distribution of r<strong>et</strong>urn ratio.The promise pulled mass away from both the selsh and generoustails of the distribution.33. This nding is harder to reconcile with inequ<strong>al</strong>ity aversion which wouldgener<strong>al</strong>ly imply that senders who send 5 dollars or less should not receive anythingin r<strong>et</strong>urn. Even if nothing is r<strong>et</strong>urned, the sender will have at least as muchexperiment<strong>al</strong> earnings as the recipient.
MEASURING TRUST 831TABLE VRETURN RATIO AS A FUNCTION OF RECIPIENT CHARACTERISTICS(1) (2) (3) (4)22 2 222 2 2 22 2 2 22Amount sent 0.018 0.018 0.019 0.014(0.007) (0.006) (0.007) (0.008)Different sexes 0.003 0.007 0.006 0.001(0.053) (0.052) (0.055) (0.065)Promise 0.043 0.007 0.031 0.017(0.051) (0.051) (0.052) (0.063)M<strong>al</strong>e 0.027 0.048 0.013 0.015(0.059) (0.058) (0.061) (0.073)White 0.075 0.072 0.074 0.061(0.054) (0.052) (0.055) (0.065)Freshman 0.072 0.052 0.083 0.009(0.055) (0.055) (0.056) (0.071)Only child 0.217 0.242 0.218 0.191(0.092) (0.089) (0.088) (0.112)GSS trust 0.106(0.051)Trust index 0.043(0.012)Self-reported trustworthiness0.026(0.026)Honesty index 0.010(0.008)Constant 0.414 0.212 0.386 0.246(0.149) (0.120) (0.185) (0.147)Adj. R 2 0.161 0.232 0.138 0.036Observations 90 88 91 64Standard errors are in parentheses. All regressions are ordinary least squares.By examining the effect of individu<strong>al</strong> characteristics on thelevel of trustworthiness, we can test wh<strong>et</strong>her trustworthiness is astable characteristic. In the rst regression in Table V, we ndthat our controls actu<strong>al</strong>ly have some impact. Being nonwhite andbeing a freshman slightly depress trustworthiness. More signicantly,only children are much less likely to r<strong>et</strong>urn money. Beingan only child reduces the amount sent back by 22 percent. Thisresult would be even stronger without control variables. Theaverage subject without siblings r<strong>et</strong>urns 40 percent of the amountthat was sent over. While this result is certainly among the mostprovocative of this study, our sm<strong>al</strong>l sample size (ten only children)leads us to withhold judgment until there is further independentverication of an only child effect on trustworthiness.
832QUARTERLY JOURNAL OF ECONOMICSFIGURE IIDistribution of R<strong>et</strong>urn Ratio in ‘‘No Promise’’ ConditionFIGURE IIIDistribution of R<strong>et</strong>urn Ratio in ‘‘Promise’’ Condition
MEASURING TRUST 833We <strong>al</strong>so nd a signicant correlation b<strong>et</strong>ween the ratio ofmoney r<strong>et</strong>urned and the GSS trust question. In regression (2) inTable V we nd an even stronger relationship b<strong>et</strong>ween the level oftrustworthiness and the index of trust-related questions (GSSTrust, GSS Helpful, and GSS Fair). The strongest subcomponentof that index is the question about wh<strong>et</strong>her a subject thinks otherpeople are fair. There are signicant correlations b<strong>et</strong>ween many ofthe attitudin<strong>al</strong> measures of trust and the experiment<strong>al</strong> measureof trustworthiness.These ndings suggest that the standard trust questions maybe picking up trustworthiness rather than trust. Tables I and IItake on a substanti<strong>al</strong>ly different meaning when viewed in thatlight. The micro-evidence on cohorts or education might then beinterpr<strong>et</strong>ed as suggesting that these groups differ in their trustworthiness,not their trust. When aggregated up to the country orregion level, presumably a measure of trustworthiness is as good(or b<strong>et</strong>ter) a measure of soci<strong>al</strong> capit<strong>al</strong> as a measure of trust. 34In regression (3) of Table V we show that there is a negative,insignicant connection b<strong>et</strong>ween self-reported trustworthinessand actu<strong>al</strong> trustworthiness. We are not surprised that thosepeople who are willing to admit to being untrustworthy are notthe least trustworthy of our subjects. This result adds furtherweight to our earlier ndings that subjects’ responses to attitudin<strong>al</strong>questions can rarely be taken at face v<strong>al</strong>ue. Instead, ourresults imply that the best way to d<strong>et</strong>ermine wh<strong>et</strong>her or not aperson is trustworthy is to ask him wh<strong>et</strong>her or not he trustsothers.The n<strong>al</strong> regression in this table presents an index of pasthonesty. This is a norm<strong>al</strong>ized average of subject answers to fourquestions about the frequency of lying to parents, roommates,acquaintances, and close friends. This reverse-scored selfreportedbehavior<strong>al</strong> measure of honesty weakly predicts the levelof trustworthiness. The important components of the index relat<strong>et</strong>o lying to acquaintances and lying to close friends. Again, it34. One possible explanation for our trustworthiness effects is that peopleasked to report how much they trust others must search for information withwhich to answer the question. Their rst step might be to d<strong>et</strong>ermine wh<strong>et</strong>her theythink people are trustworthy. People regularly overestimate the extent to whichothers are like them (the ‘‘f<strong>al</strong>se consensus effect’’ {Ross, Green, and House 1977}, sopeople who are themselves trustworthy would be likely to construe others astrustworthy. Having decided that others are usu<strong>al</strong>ly trustworthy, it would be areasonable n<strong>al</strong> step to conclude that one’s trust of others was high. Schwarz{<strong>1999</strong>} suggests that a process such as this lies at the heart of <strong>al</strong>l attitudin<strong>al</strong>self-ev<strong>al</strong>uations.
834QUARTERLY JOURNAL OF ECONOMICSappears that asking about past actions is more successful thanasking about opinions.B. Soci<strong>al</strong> ConnectionsThe soci<strong>al</strong> capit<strong>al</strong> literature assumes that soci<strong>al</strong> connections(e.g., clubs, organizations, friendships, <strong>et</strong>c.) mitigate the freeriderproblem and facilitate cooperative soci<strong>al</strong> interaction. InTable VI we d<strong>et</strong>ermine wh<strong>et</strong>her soci<strong>al</strong> connection b<strong>et</strong>ween senderand recipient increases trust and trustworthiness in our experiment.We use two basic measures of soci<strong>al</strong> connections: monthssince rst me<strong>et</strong>ing and number of friends that the sender andrecipient have in common. To lessen the impact of outliers, wehave topcoded the number of months at 36 and the number offriends at 30. We include both the index of past trusting behaviorand the GSS survey question on trust as added controls.The rst and fth regressions of Table VI show the effect ofmonths since rst me<strong>et</strong>ing on amount sent and r<strong>et</strong>urn ratio. Thecoefficient in the amount sent regression is signicant at the 90percent level; the coefficient in the r<strong>et</strong>urn ratio regression issignicant at the 95 percent level. The coefficients are not sm<strong>al</strong>l. Aone-standard-deviation increase in time known raises amountsent by 80 cents and r<strong>et</strong>urn ratio by 5 percent.In the second and sixth regressions we look at the number offriends in common. There is a positive, insignicant effect of thisvariable on amount sent and r<strong>et</strong>urn ratio. The economic magnitudesof the coefficients, though, are not inconsequenti<strong>al</strong>. Forexample, ten extra friends apparently raises r<strong>et</strong>urn ratio by 2.6percent, at least in our relatively sm<strong>al</strong>l sample.In the third and seventh regressions we test wh<strong>et</strong>her individu<strong>al</strong>sfrom different countries trust each other less. We nd a sm<strong>al</strong>lbut insignicant negative effect on amount sent, but a large andvery signicant effect on r<strong>et</strong>urn ratio. People are much more likelyto r<strong>et</strong>urn low amounts if they are facing someone from a differentcountry. This result is much stronger than the results on soci<strong>al</strong>connection, and it is unchanged when we control for soci<strong>al</strong>connection.The differences b<strong>et</strong>ween regressions (3) and (7) pose a puzzle.If trustworthiness b<strong>et</strong>ween nation<strong>al</strong>ities is so low, why is trustitself not affected by nation<strong>al</strong> differences within a subject pair?Perhaps our coefficient in the trust equation is impreciselymeasured. Alternatively, senders may truly fail to infer that theywill receive less back from recipients from a different nation<strong>al</strong>-
MEASURING TRUST 835TABLE VIINFLUENCE OF SOCIAL CONNECTION ON AMOUNT SENT AND RETURN RATIOAmount sent as function ofsender and pair characteristicsR<strong>et</strong>urn ratio as function ofrecipient and pair characteristics(1) (2) (3) (4) (5) (6) (7) (8)Amount sent 0.0143(0.0069)0.0151(0.0069)0.0170(0.0066)0.0140(0.0069)2 2 2 2 2 2 Promise 0.0796 0.0308 0.0416 0.0597 0.0548 0.0539 0.0358 0.0691(1.0060) (1.0153) (1.0319) (1.0380) (0.0511) (0.0515) (0.0501) (0.0519)Differentsex2 0.2899(1.1372)2 2 0.0455 0.2118 0.2243(1.1890) (1.1750) (1.1657)0.0067(0.0530)0.0331(0.0577)0.0328(0.0528)0.0050(0.0536)2 2 22 2 2 2 22 2 2 2 2 2 2 2M<strong>al</strong>e 0.3777 0.5750 0.6190 0.6453 0.0477 0.0622 0.0458 0.0448(1.1950) (1.2007) (1.2168) (1.2251) (0.0589) (0.0621) (0.0570) (0.0584)White 0.3568 0.1940 0.2490 0.0589 0.0497 0.0567(1.0082) (1.0203) (1.0274) (0.0541) (0.0553) (0.0527)Freshman 0.3029 0.0344 0.0387 0.0215 0.0557 0.0668 0.0730 0.0641(1.1270) (1.1251) (1.1484) (1.1406) (0.0549) (0.0550) (0.0532) (0.0553)Only child 1.9766(1.5499)1.6304(1.5724)1.8404(1.5906)1.7288(1.5966)0.2222(0.0933)0.2447(0.0944)0.2149(0.0909)0.2302(0.0950)Trusting 0.3997behavior (0.2157)indexGSS trust 0.1581Monthssince rstme<strong>et</strong>ingNumber ofcommonfriendsDifferentnation<strong>al</strong>ityWhite sender,NonwhiterecipientNonwhitesender,whiterecipientNonwhitesender, nonwhiterecipient(1.0136)0.1016(0.0614)0.3788(0.2199)0.1978(1.0260)0.0310(0.0321)0.4020(0.2206)0.1580(1.0323)2 0.2174(1.2509)0.3964(0.2216)0.0027(0.0153)2 0.2080 0.1004(1.0461) (0.0530)2 0.7496(1.4726)2 0.2350(1.1579)2 0.1040(2.5213)0.0060(0.0032)0.0061(0.0153)0.0021(0.0148)0.0061(0.0153)2 2 2 0.1057 0.1048 0.0800(0.0537) (0.0516) (0.0541)0.0026(0.0017)2 0.1749(0.0616)2 0.1092(0.0623)2 0.1231(0.0665)2 0.0893(0.1250)2 2 2 2Constant 12.0169 11.6161 12.2148 12.1904 0.4327 0.4058 0.4533 0.5433(2.4486) (2.5578) (2.4951) (2.5012) (0.1501) (0.1527) (0.1462) (0.1455)Adjusted R 2 0.0006 0.0224 0.0337 0.0433 0.159 0.1457 0.2029 0.1471Observations 92 92 92 92 89 89 89 89Standard errors are in parentheses. All regressions are ordinary least squares.
836QUARTERLY JOURNAL OF ECONOMICSity. 35 Perhaps this failure arises because of the novelty of theexperiment and the complexity of implementing backward induction.Perhaps this failure arises because Harvard students areloathe to assume/acknowledge that their partners may exhibitnation<strong>al</strong>istic preferences.Regressions (4) and (8) of Table VI look at the impact ofwithin-pair raci<strong>al</strong> differences. In our sample, more than 35percent of the subjects are Asian, so there is considerable raci<strong>al</strong>h<strong>et</strong>erogeneity. To an<strong>al</strong>yze race, we divide the subject pairs intofour groups: white sender/white recipient (the omitted category),white sender/nonwhite recipient, nonwhite sender/white recipientand nonwhite sender/nonwhite recipient. Note that subjectpairs in the last group may still exhibit within-pair h<strong>et</strong>erogeneity,since the nonwhite category is quite broad.None of the group effects are signicant in the amount sentregressions, but <strong>al</strong>l three groups have lower r<strong>et</strong>urn ratios than thewhite/white omitted category. The lowest r<strong>et</strong>urn ratios occurwhen white recipients r<strong>et</strong>urn money to nonwhite senders. Moststrikingly, 92 percent of the cases where the recipient sent backnothing occurred when the individu<strong>al</strong>s were of different races,while only 59 percent of the pairings were raci<strong>al</strong>ly diverse.The negative effect of different races may occur becausepeople from different races or countries have a lower probability ofinteracting in the future, but the nation<strong>al</strong>ity and race effectschange little when we control for the two soci<strong>al</strong> connectionvariables. Alternatively, lower levels of trustworthiness b<strong>et</strong>weenraces may instead reect lower levels of reciproc<strong>al</strong> <strong>al</strong>truism.Whatever the interpr<strong>et</strong>ation, these results suggest that h<strong>et</strong>erogeneitymay decrease trustworthiness in soci<strong>al</strong> groups. 36C. Soci<strong>al</strong> Status and Individu<strong>al</strong> Soci<strong>al</strong> Capit<strong>al</strong>Soci<strong>al</strong> capit<strong>al</strong> has two riv<strong>al</strong> conceptu<strong>al</strong>izations. Many origin<strong>al</strong>users of the term, James {1904}, and more recently Loury {1977})saw soci<strong>al</strong> capit<strong>al</strong> as an individu<strong>al</strong>-specic variable reecting35. These results support those of Fershtman and Gneezy {1998}, but differ inimportant ways. First, they examine trust of <strong>al</strong>l people toward a low statusminority and nd that there is less trust. Second, their subjects have no possibilityof repeated interaction after the game. Third, they <strong>al</strong>low no person<strong>al</strong> contactb<strong>et</strong>ween subjects, who must infer <strong>et</strong>hnicity from the last name of their partners.Fershtman and Gneezy nd no <strong>et</strong>hnic effects on amounts r<strong>et</strong>urned, but they lookonly at the effect of the sender being Sephardic, not at any effects of senderrecipient<strong>et</strong>hnic similarity on the amount r<strong>et</strong>urned.36. La Porta <strong>et</strong> <strong>al</strong>. {1997} argue that <strong>et</strong>hnic h<strong>et</strong>erogeneity may decrease thequ<strong>al</strong>ity of government by limiting the formation of aggregate soci<strong>al</strong> capit<strong>al</strong>.
MEASURING TRUST 837one’s ability to do well in soci<strong>al</strong> situations. In the 1990s Coleman{1990} and Putnam {1993, 1995} have used the term to describegroup-level attributes, like the existence of a soci<strong>al</strong> n<strong>et</strong>workamong a group of friends. We examine evidence for the formerconceptu<strong>al</strong>ization in this subsection.In Table VII we test wh<strong>et</strong>her people with high levels of soci<strong>al</strong>status systematic<strong>al</strong>ly re<strong>al</strong>ize high r<strong>et</strong>urns from soci<strong>al</strong> interactions.Many different mechanisms could support such regularity.For example, high status individu<strong>al</strong>s may elicit trustworthybehavior because they are relatively skilled at soci<strong>al</strong>ly punishingor rewarding others.Table VII identies individu<strong>al</strong> characteristics that predicthigh individu<strong>al</strong> r<strong>et</strong>urns in the trust experiment. Conceptu<strong>al</strong>ly, wedemonstrate the existence of individu<strong>al</strong>-specic soci<strong>al</strong> capit<strong>al</strong>. Wefocus on characteristics of the sender that predict nanci<strong>al</strong>success for the sender. Characteristics of the recipient that predictsuccess gener<strong>al</strong>ly work because the characteristics predict cheating(i.e., r<strong>et</strong>urning less than the amount sent). This cheating maybe punished after the experiment ends, during routine soci<strong>al</strong>interactions among Harvard students. So the tot<strong>al</strong> r<strong>et</strong>urns to therecipient, including nonnanci<strong>al</strong> r<strong>et</strong>urns, are likely not to beobserved.In our rst regression we examine two measures of thesender’s family status: (1) hours spent working for pay and (2)wh<strong>et</strong>her one’s father has a college degree. Hours spent working forpay as a college student is strongly correlated with low familyincome (44 percent), and we believe it is a signicantly b<strong>et</strong>termeasure than the categoric<strong>al</strong> family income variable that wehave. We <strong>al</strong>so include two soci<strong>al</strong> connection variables. First, weinclude the self-reported number of close friends that the individu<strong>al</strong>says he has (top-coded at 20). Second, we include thenumber of hours per week that the individu<strong>al</strong> spends volunteering.Approximately two-thirds of Harvard undergraduates volunteerregularly, and this is a particularly gener<strong>al</strong> form of soci<strong>al</strong>interaction. We <strong>al</strong>so include two proxies for ‘‘coolness’’ or charismain this subject population: beers drunk per week and wh<strong>et</strong>her theindividu<strong>al</strong> has a sexu<strong>al</strong> partner. 37In the rst regression we nd that working for pay has anegative effect on amount sent but this effect is only margin<strong>al</strong>ly37. This variable takes on a v<strong>al</strong>ue of one if the individu<strong>al</strong> has a currentgirlfriend or boyfriend and if the individu<strong>al</strong> has had sex with at least one otherperson in the past ve years.
838QUARTERLY JOURNAL OF ECONOMICSTABLE VIISOCIAL CAPITAL, STATUS, AND THE RETURNS TO SOCIAL CAPITALAmountsent as afunctionof sendercharacteristics(1)R<strong>et</strong>urnratio as afunctionof sendercharacteristics(2)Financi<strong>al</strong>r<strong>et</strong>urns tosender as afunctionof sendercharacteristics(3)Financi<strong>al</strong>r<strong>et</strong>urns torecipientas a functionof sendercharacteristics(4)2 2 22 222 22 22 22 22 2 22 222222Promise 0.0450 0.0103 0.1881 0.2331(0.1010) (0.0491) (1.2238) (1.5552)Different sex 0.8162(1.1147)0.0887(0.0541)2.0264(1.3510)2.8426(1.7168)White 0.2571 0.0114 0.4036 0.1470(1.0743) (0.0519) (1.3021) (1.6546)M<strong>al</strong>e 0.1849 0.1008 2.8013 2.9861(1.1733) (0.0565) (1.4220) (1.8070)Freshman 0.3741 0.0174 0.4294 0.0553(1.2394) (0.0602) (1.5021) (1.9088)Only child 2.5365(1.5545)0.0578(0.0780)0.7949(1.8840)3.3314(2.3941)Father with collegedegree0.3324(2.0752)0.1407(0.0987)2.3978(2.5151)2.7302(3.1961)Hours worked forpay0.1441(0.0869)0.0092(0.0043)0.2273(0.1053)0.0832(0.1338)Number of closefriends0.0919(0.0658)0.0112(0.0032)0.1684(0.0798)0.2603(0.1014)Hours spent volunteering0.0306(0.2031)0.0261(0.0099)0.6893(0.2462)0.6586(0.3128)Sexu<strong>al</strong> partner 2.8618(1.4861)0.1726(0.0723)4.7588(1.8012)1.8969(2.2889)Beer servings 0.0471(0.1243)0.0136(0.0063)0.3399(0.1507)0.2929(0.1915)Amount sent 0.0118(0.0065)Constant 13.7772 0.0690 5.8516 22.9256(2.7993) (0.1591) (3.3926) (4.3112)Adjusted R 2 0.0061 0.308 0.2006 0.0735Observations 93 89 93 93Standard errors are in parentheses. All regressions are ordinary least squares.signicant at the 10 percent level. 38 The effect of father’s educationis insignicant. Of the other variables, only having a sexu<strong>al</strong>partner positively predicts trust.In the second regression we regress r<strong>et</strong>urn ratio on characteristicsof the sender. This regression identies sever<strong>al</strong> sender38. The impact of the working for pay variable may reect standard incomeeffects.
MEASURING TRUST 839characteristics that signicantly predict which senders will bewell treated by the recipients. We nd signicant coefficients on<strong>al</strong>l variables except for father’s education. Father’s education,however, becomes signicant if hours worked for pay is droppedfrom the regression. The effects are often quite large. For example,people without sexu<strong>al</strong> partners receive 17 percent less back thanpeople who do have sexu<strong>al</strong> partners (this is true of both men andwomen).These two regressions provide only parti<strong>al</strong> snapshots of theimpact of soci<strong>al</strong> capit<strong>al</strong>, because the regressions ev<strong>al</strong>uate separatelyamount sent and r<strong>et</strong>urn ratio. The artici<strong>al</strong> but controlleds<strong>et</strong>ting of our experiment has the advantage that we can preciselymeasure tot<strong>al</strong> nanci<strong>al</strong> r<strong>et</strong>urns from this particular soci<strong>al</strong> interaction.We next regress tot<strong>al</strong> nanci<strong>al</strong> r<strong>et</strong>urns (from the TrustGame) on person<strong>al</strong> characteristics of our subjects. We perform thisregression separately for individu<strong>al</strong>s in the sender and therecipient position. All r<strong>et</strong>urns are measured in dollars.Column (3) in Table VII reports the results of the senderregression. Again, <strong>al</strong>l variables except for father’s college statusare signicant. Without controls, the father’s education variablebecomes much stronger. The average r<strong>et</strong>urn for senders whosefather graduated from college is 14.75 dollars. The average r<strong>et</strong>urnfor senders whose fathers did not graduate from college is 9.29dollars. It appears that senders from families with lower humancapit<strong>al</strong> would have been b<strong>et</strong>ter off nanci<strong>al</strong>ly if they had nottrusted their partners. Comparing senders from high and lowincome families <strong>al</strong>so demonstrates these effects. The averager<strong>et</strong>urns for senders from high income families was more than 2dollars greater than the average r<strong>et</strong>urns for senders from lowincome families. These higher r<strong>et</strong>urns appear to come solely fromthe ability to elicit trustworthy behavior.We nd that senders who work for pay receive less from thesoci<strong>al</strong> interaction. Senders with sexu<strong>al</strong> partners take home over 4dollars more than their celibate classmates. Individu<strong>al</strong>s whodrink beer earn more. Fin<strong>al</strong>ly, a one-standard-deviation increasein the volunteering variable raises nanci<strong>al</strong> r<strong>et</strong>urns from thegame by <strong>al</strong>most 2 dollars.Since soci<strong>al</strong> capit<strong>al</strong> of the sender does not predict higherv<strong>al</strong>ues of amount sent, but does predict higher v<strong>al</strong>ues of r<strong>et</strong>urnratio, it seems likely that soci<strong>al</strong> capit<strong>al</strong> of the sender has negativenanci<strong>al</strong> extern<strong>al</strong>ities for the recipient. Regression (4) in TableVII conrms this conjecture. We regress the tot<strong>al</strong> nanci<strong>al</strong> r<strong>et</strong>urns
840QUARTERLY JOURNAL OF ECONOMICSof the recipient on our measures of the sender’s soci<strong>al</strong> capit<strong>al</strong>. Wend that <strong>al</strong>l of the soci<strong>al</strong> capit<strong>al</strong> variables that increase thenanci<strong>al</strong> r<strong>et</strong>urns for the sender decrease the r<strong>et</strong>urns to therecipient. In this experiment these types of soci<strong>al</strong> capit<strong>al</strong> lead toredistribution from one player to another. As such, the soci<strong>al</strong>capit<strong>al</strong> that we have identied appears to generate private, notgroup, r<strong>et</strong>urns. Findings like this underscore the importance ofdistinguishing b<strong>et</strong>ween individu<strong>al</strong> and group-level conceptu<strong>al</strong>izationsof soci<strong>al</strong> capit<strong>al</strong>.Fin<strong>al</strong>ly, we note that these results may not gener<strong>al</strong>ize. Soci<strong>al</strong>capit<strong>al</strong> could have increased everyone’s r<strong>et</strong>urns in the Trust Gameonly if it had increased the level of trust in the rst period. But <strong>al</strong>arge share of our sample of senders chose to send the maxim<strong>al</strong>amount. As such, there may have been insufficient opportunity forthe positive effects of soci<strong>al</strong> capit<strong>al</strong> to operate on group r<strong>et</strong>urns.Natur<strong>al</strong>ly, the earlier warnings about the limited size of oursample and the speci<strong>al</strong> features of our games and subject populationapply here as well.V. CONCLUSIONUsing two experiments, we investigated wh<strong>et</strong>her trust, trustworthiness,and soci<strong>al</strong> capit<strong>al</strong> are characteristics of individu<strong>al</strong>s aswell as groups. Past trusting behavior correlates with trustingbehavior in our experiments. The levels of trust in the twoexperiments are weakly correlated with each other. We <strong>al</strong>so foundthat two of our attitudin<strong>al</strong> survey questions about trustingstrangers both predict trust. Hence, trusting behavior has a stableindividu<strong>al</strong>-specic component. However, this component is at bestweakly measured by typic<strong>al</strong> attitudin<strong>al</strong> questions about trust,including the widely studied GSS trust question. Trustworthiness<strong>al</strong>so seems to be stable and is strongly predicted by attitudin<strong>al</strong>survey questions about trust (not trustworthiness) and by havingsiblings.In summary, to d<strong>et</strong>ermine wh<strong>et</strong>her someone is trusting, askhim about specic instances of past trusting behaviors. To d<strong>et</strong>erminewh<strong>et</strong>her someone is trustworthy, ask him if he trusts others.There are two addition<strong>al</strong> s<strong>et</strong>s of results from these experiments.First, soci<strong>al</strong> connection strongly predicts trustworthinessand weakly predicts trust. In particular, nation<strong>al</strong> and raci<strong>al</strong>differences b<strong>et</strong>ween partners strongly predict a tendency to cheatone another.
MEASURING TRUST 841Second, individu<strong>al</strong> characteristics that relate to family status,soci<strong>al</strong> skill, and charisma strongly predict one’s tot<strong>al</strong> nanci<strong>al</strong>r<strong>et</strong>urns in the trust experiment. These variables matter becausepeople in our sample are less likely to cheat individu<strong>al</strong>s with thesecharacteristics. These results suggest that some people have‘‘individu<strong>al</strong> soci<strong>al</strong> capit<strong>al</strong>,’’ a subcomponent of human capit<strong>al</strong> thatreects an ability to earn r<strong>et</strong>urns from soci<strong>al</strong> situations.There are three major implications of this paper for futureresearch. First, soci<strong>al</strong> capit<strong>al</strong> is a meaningful, individu<strong>al</strong>-levelvariable that can be studied with the tools of price theory. 39 Ourevidence supports the view that human capit<strong>al</strong> includes not onlycognitive and physic<strong>al</strong> abilities but <strong>al</strong>so soci<strong>al</strong> capit<strong>al</strong>, e.g.,interperson<strong>al</strong> skills, status, and access to soci<strong>al</strong> n<strong>et</strong>works (as inBowles and Gintis {1976}).Second, standard survey questions about trust do not appearto measure trust. However, they do measure trustworthiness,which is one ingredient of soci<strong>al</strong> capit<strong>al</strong>. This means that mostwork using these survey questions needs to be somewhat reinterpr<strong>et</strong>ed.If future surveys hope to measure trust, then otherinstruments, including questions about past trusting behavior,should be developed and empiric<strong>al</strong>ly v<strong>al</strong>idated. 40Fin<strong>al</strong>ly, we believe that this paper demonstrates the v<strong>al</strong>ue ofusing experiments and surveys tog<strong>et</strong>her. Experiments measurepreferences, behavior<strong>al</strong> propensities, and other individu<strong>al</strong> attributesmuch more convincingly than surveys, since experimentsprovide direct observations of behavior. By connecting experimentsand surveys, we can d<strong>et</strong>ermine the socioeconomic correlatesof hard-to-measure individu<strong>al</strong> attributes, and test thev<strong>al</strong>idity of survey measures of these attributes.39. However, aggregation will be much more difficult than for other forms ofcapit<strong>al</strong>.40. Indirect psychologic<strong>al</strong> measures of attitudes have been shown to be moreeffective than direct measures {McClelland, Koestner, and Weinberger 1989}.
842QUARTERLY JOURNAL OF ECONOMICSAPPENDIX 1: DEFINITIONS OF VARIABLESVariable name Question/description Answer rangeMean(standarddeviation)Amount sent Amount sent from the sender tothe recipient in the trust game0–15 12.41(4.54)Beer servings The number of beers consumed perweekPositive re<strong>al</strong> numbers 2.03(4.13)Behavior<strong>al</strong> index Norm<strong>al</strong>ized index of lend money, Re<strong>al</strong> numbers .03lend possessions, and leave door(2.13)unlockedClose friends Number of close friends Positive re<strong>al</strong> numberscapped at 307.24(6.32)Common friends Number of friends the two participantsof the trust game have inPositive re<strong>al</strong> numberscapped at 5012.54(16.08)commonDifferent nation<strong>al</strong>ityAre the participants in the trustgame from different countries?No—0Yes—10.25(0.43)Different sex Are the participants in the trustgame of opposite sex?No—0Yes—10.42(0.49)Different race Are the participants in the trust No—00.58game of different races? Yes—1Door unlocked ‘‘How often do you leave your door Very often—1unlocked?’’Often—2Som<strong>et</strong>ime—3Rarely—4Never—5Father w/BA Father with a college degree No—0Yes—1Freshman Freshman No—0Yes—1GSS fair‘‘Do you think most people wouldtry to take advantage of you ifthey got a chance, or would theytry to be fair?’’GSS helpGSS trustGSS index (trustindex)Honesty indexHours worked forpay‘‘Would you say that most of th<strong>et</strong>ime people try to be helpful, orthat they are mostly just lookingout for themselves?’’‘‘Gener<strong>al</strong>ly speaking, would yousay that most people can b<strong>et</strong>rusted or that you can’t be toocareful in de<strong>al</strong>ing with people?’’Norm<strong>al</strong>ized average of GSS fair,GSS trust, and GSS helpAverage of ve questions ratingfrequency of lying to parents,roommates, acquaintances, closefriends and partners on a sc<strong>al</strong>eof 1 (very often) to 5 (never).The number of hours worked forpay per weekWould take advantage ofyou—1Would try to be fair—2Try to be helpful—1Just look out for themselves—2Most people can b<strong>et</strong>rusted—1Can’t be too careful—2(0.49)4.26(1.11)0.90(0.28)0.68(0.46)1.56(0.49)1.61(0.49)1.51(.50)Positive re<strong>al</strong> numbers 0.00(2.22){2.2, 5} 3.99(.50)Positive re<strong>al</strong> numberscapped at 45 hours4.67(6.50)
MEASURING TRUST 843APPENDIX 1: (CONTINUED)Variable name Question/description Answer rangeMean(standarddeviation)Hours volunteeringThe number of hours spend volunteeringper weekPositive re<strong>al</strong> numberscapped at 60 hours1.95(2.65)Lend money ‘‘How often do you lend money tofriends?’’More than once aweek—12.85(1.15)About once a week—2About once a month—3Once a year or less—4Lend possessions ‘‘How often do you lend person<strong>al</strong>possessions to friends?’’More than once aweek—12.44(1.18)About once a week—2About once a month—3Once a year or less—4Lost mail ‘‘Have you or someone close to yourecently lost som<strong>et</strong>hing in theNever—1Not in sever<strong>al</strong> years—22.54(0.99)mail?’’Within 1–2 years—3Within the last 6months—4M<strong>al</strong>e M<strong>al</strong>e No—0Yes—10.68(0.46)Mean reservationv<strong>al</strong>ueAverage of reservation v<strong>al</strong>ues over<strong>al</strong>l the envelope drop conditions0–10 0.002(1.77)Only child Only child No—0Yes—10.11(0.32)Past windf<strong>al</strong>l ‘‘Have you every spontaneouslyben<strong>et</strong>ted from the generosity ofsomeone you never knewbefore?’’No—0Yes—10.57(0.50)Pro-transferPromiseR<strong>et</strong>urn ratioSexu<strong>al</strong> partnerStranger (truststranger)Time since m<strong>et</strong>Trustworthy (selfreportedtrustworthiness)‘‘Person<strong>al</strong> income shouldn’t bed<strong>et</strong>ermined by work.’’Disagree strongly—1Disagree somewhat—2Agree somewhat—3Agree strongly—42.17(0.89)Promise to r<strong>et</strong>urn at least as muchto the sender as sentAgreed—0Didn’t agree—10.48(0.50)(Amount r<strong>et</strong>urned to sender)/ {0,1} 0.46(amount recipient received)(0.27)Does the participant have a sexu<strong>al</strong> No—00.17partner?Yes—1(0.38)‘‘You can’t count on strangers anymore.’’More or less agree—1 1.39More or less disagree—2 (0.05)The number of months the sender Positive re<strong>al</strong> v<strong>al</strong>ue 2.73and recipient have known each(7.83)other. Capped at 36 months‘‘I am trustworthy’’White White No—0Yes—1Disagree strongly—1Disagree somewhat—2Disagree slightly—3Agree slightly—4Agree somewhat—5Agree strongly—65.31(0.93)0.61(0.49)
844QUARTERLY JOURNAL OF ECONOMICSAPPENDIX 2a: CORRELATIONS BETWEEN DIFFERENT MEASURES OF TRUSTMean reservationv<strong>al</strong>ueAmountsentGSStrustGSSindexTruststranger2 22 222Amount sent 0.1580(0.1222)97GSS trust 0.0636 0.0117(0.3899) (0.9103)185 95GSS index 0.0663 0.0582 0.7505(0.3767) (0.5815) (0.0000)180 92 253Trust stranger 0.1874 0.1894 0.3665 0.3530(0.0104) (0.0674) (0.0000) (0.0000)186 94 257 251Behavior<strong>al</strong> index 0.1457 0.2240 0.2036 0.0930 0.1355(0.0472) (0.0291) (0.0010) (0.1418) (0.0293)186 95 257 251 259First entries are correlation coefficients. P-v<strong>al</strong>ues are in parentheses. Last entries are numbers of observations.APPENDIX 2b: CORRELATIONS BETWEEN OUTCOMES AND INDEPENDENT VARIABLESMeanreservationv<strong>al</strong>ueAmount sentas a functionof sendercharacteristicsAmount sentas a functionof recipientcharacteristicsR<strong>et</strong>urn ratioas a functionof sendercharacteristicsR<strong>et</strong>urn ratioas a functionof recipientcharacteristics22 22 2 2 2 22 2 2 2 2M<strong>al</strong>e 0.0462 0.0478 0.0890 0.1181 0.0241(0.5274) (0.6419) (0.3887) (0.2597) (0.8198)189 97 96 93 92White 0.0805 0.0031 0.1212 0.1095 0.1387(0.2686) (0.9758) (0.2370) (0.2962) (0.1850)191 97 97 93 93Freshman 0.0259 0.0573 0.0222 0.1265 0.0812(0.7219) (0.5774) (0.8289) (0.2268) (0.4390)191 97 97 93 93Only child 0.0485 0.0129 0.0256 0.0020 0.2394(0.5078) (0.2066) (0.8047) (0.9845) (0.0215)189 97 96 93 92Number ofcommon friendsHours volunteeringHours workedfor payDifferent countries2 0.0045(0.9511)1910.0113(0.8768)1912 0.0499(0.4928)1910.1455(0.1551)970.0573(0.5773)972 0.1407(0.1691)972 0.0628(0.5414)972 Different races 0.0143(0.8898)97Number of closefriends2 0.0945(0.3574)970.1242(0.2255)970.0198(0.8470)970.0935(0.3624)972 0.0628(0.5414)972 0.0143(0.8898)972 0.0376(0.7150)970.1583(0.1296)930.2085(0.0449)932 0.2397(0.0207)932 0.3210(0.0017)932 0.2447(0.0181)930.2412(0.0199)930.1441(0.1681)930.0854(0.4158)930.0183(0.8617)932 0.3210(0.0017)932 0.2447(0.0181)930.0003(0.9980)93First entries are correlation coefficients. Numbers in parentheses are p-v<strong>al</strong>ues. Third entries are numberof observations.
MEASURING TRUST 845APPENDIX 3: THE EFFECT OF DIFFERENT SCENARIOS ON RESERVATION PRICEReservation v<strong>al</strong>ue22222Constant 5.82(0.109)Post office 2.29(0.128)No postage 2.50(0.116)Unse<strong>al</strong>ed 2.03(0.116)Night 0.98(0.128)Porter Square 0.36(0.116)Centr<strong>al</strong> Square 0.49(0.116)Adjusted R 2 0.279Observations 2850Standard errors are in parentheses. Results are from ordinary least squares regressions where eachperson-conditio n reservation v<strong>al</strong>ue is an observation.EDWARD L. GLAESERHARVARD UNIVERSITY ANDNATIONAL BUREAU OF ECONOMIC RESEARCHDAVID I. LAIBSONHARVARD UNIVERSITY ANDNATIONAL BUREAU OF ECONOMIC RESEARCHJOSÉ A. SCHEINKMANPRINCETON UNIVERSITYCHRISTINE L. SOUTTERHARVARD UNIVERSITYREFERENCESAbreu, D. ‘‘On the Theory of Innitely Repeated Games with Discounting,’’Econom<strong>et</strong>rica, LVI (1988), 383–396.Ajzen, I., and M. Fishbein, ‘‘Attitude-Behavior Relations: A Theor<strong>et</strong>ic<strong>al</strong> An<strong>al</strong>ysisand Review of Empiric<strong>al</strong> Research,’’ Psychologic<strong>al</strong> Bull<strong>et</strong>in, LXXXIV (1977),999–1018.Arrow, K., ‘‘Gifts and Exchanges,’’ Philosophy and Public Affairs, I (1972),343–362.B<strong>al</strong>l, C., C. Eckel, P. Grossman, and W. Zame, ‘‘Status in Mark<strong>et</strong>s,’’ mimeograph,1998.Banaji, M. R., and A. G. Greenw<strong>al</strong>d, ‘‘Implicit Stereotyping and Prejudice,’’ in M. P.Zanna and J. M. Olson, eds., The Psychology of Prejudice: The OntarioSymposium, Volume 7 (Hillsd<strong>al</strong>e: Lawrence Erlbaum, 1994).Becker, G., M. H. DeGroot, and J. Marschak, ‘‘Measuring Utility by a Single-Response Sequenti<strong>al</strong> M<strong>et</strong>hod,’’ Behavior<strong>al</strong> Science, IX (1964), 226–232.Berg, J., J. Dickhaut, and K. McCabe, ‘‘Trust, Reciprocity, and Soci<strong>al</strong> History,’’Games and Economic Behavior, X (1995), 122–142.
846QUARTERLY JOURNAL OF ECONOMICSBowles, S., and H. Gintis, Schooling In Capit<strong>al</strong>ist America: Education<strong>al</strong> Reformand the Contradictions of Economic Life (New York: Basic Books, 1976).Coleman, J., Foundations of Soci<strong>al</strong> Theory (Cambridge, MA: Harvard UniversityPress, 1990).Fershtman, C., and U. Gneezy, ‘‘Trust and Discrimination in a Segmented Soci<strong>et</strong>y:An Experiment<strong>al</strong> Approach,’’ mimeograph, 1998.Fukuyama, F., Trust (New York: Free Press, 1995).<strong>Glaeser</strong>, E., and S. Glendon, ‘‘The Demand for Religion,’’ mimeograph, 1998.<strong>Glaeser</strong>, E., D. Laibson, J. Scheinkman, and C. L. Soutter, ‘‘What Is Soci<strong>al</strong> Capit<strong>al</strong>?The D<strong>et</strong>erminants of Trust and Trustworthiness,’’ NBER working paper No.7216, <strong>1999</strong>.Goldin, C., and L. Katz, ‘‘Human Capit<strong>al</strong> and Soci<strong>al</strong> Capit<strong>al</strong>: The Rise of SecondarySchooling in America, 1910–1940,’’ Journ<strong>al</strong> of Interdisciplinary History, XXIX(<strong>1999</strong>), 683–723.Greenw<strong>al</strong>d, A. G., and M. R. Banaji, ‘‘Implicit Soci<strong>al</strong> Cognition: Attitudes,Self-Esteem and Stereotypes,’’ Journ<strong>al</strong> of Person<strong>al</strong>ity and Soci<strong>al</strong> Psychology,CII (1995), 4–27.Greif, A., ‘‘Contract Enforceability and Economic Institutions in Early Trade: TheMaghribi Traders’ Co<strong>al</strong>ition,’’ American Economic Review, LXXXIII (1993),525–548.Hirst, W., ‘‘Cognitive Aspects of Consciousness,’’ in The Cognitive Neurosciences,M. S. Gazzaniga, ed. (Cambridge, MA: MIT Press, 1998).Iannaccone, L., ‘‘Sacrice and Stigma: Reducing Free-Riding in Cults, Communes,and Other Collectives,’’ Journ<strong>al</strong> of Politic<strong>al</strong> Economy, C (1991), 271–291.Jacobs, J., The Death and Life of Great American Cities (New York: Vintage, 1961).James, H., The Golden Bowl (New York: Scribners, 1904).Knack, S., and P. Keefer, Does Soci<strong>al</strong> Capit<strong>al</strong> Have an Economy Payoff ? ACross-Country Investigation,’’ Quarterly Journ<strong>al</strong> of Economics, CXII (1997),1251–1288.Kraus, S. J., ‘‘Attitudes and the Prediction of Behavior: A M<strong>et</strong>a-An<strong>al</strong>ysis of theEmpiric<strong>al</strong> Literature,’’ Person<strong>al</strong>ity and Soci<strong>al</strong> Psychology Bull<strong>et</strong>in, XXI (1995),58–75.LaPiere, R. T., ‘‘Attitude versus Action,’’ Soci<strong>al</strong> Forces, XIII (1934), 230–237.La Porta, R., F. Lopez-de-Silanes, A. Shleifer, and R. Vishny, ‘‘Trust in LargeOrganizations,’’ American Economic Review Papers and Proceedings, LXXXVII(1997), 333–338.Loury, G., ‘‘A Dynamic Theory of Raci<strong>al</strong> Income Differences,’’ in Women, Minoritiesand Employment Discrimination, P. W<strong>al</strong>lace and A. LeMund, eds. (Lexington,MA: Lexington Books, 1977).McClelland, D. C., R. Koestner, and J. Weinberger, ‘‘How Do Self-Attributed andImplicit Motives Differ?’’ Psychologic<strong>al</strong> Review, XCVI (1989), 690–702.Nisb<strong>et</strong>t, R. E., and T. D. Wilson, ‘‘Telling More Than We Can Know: Verb<strong>al</strong> Reportson Ment<strong>al</strong> Processes,’’ Psychologic<strong>al</strong> Review, LXXXIV (1977), 231–259.Oskamp, S., Attitudes and Opinions, 2nd edition (Englewood Cliffs, NJ: Prentice-H<strong>al</strong>l, 1991).Putnam, R., Making Democracy Work: Civic Traditions in Modern It<strong>al</strong>y (Princ<strong>et</strong>on,NJ: Princ<strong>et</strong>on University Press, 1993)., ‘‘The Case of the Missing Soci<strong>al</strong> Capit<strong>al</strong>,’’ mimeographed, 1995.Rabin, M., ‘‘Incorporating Fairness into Game Theory and Economics,’’ AmericanEconomic Review, LXXXIII (1993), 1281–1302.Rosenberg, M., Occupations and V<strong>al</strong>ues (Glencoe, IL: Free Press, 1957).Ross, L., D. Green, and P. House, ‘‘The ‘F<strong>al</strong>se-Consensus’ Effect: An Egocentric Biasin Soci<strong>al</strong> Perception and Attribution Processes,’’ Journ<strong>al</strong> of Experiment<strong>al</strong>Soci<strong>al</strong> Psychology, XIII (1977), 279–301.Rotter, J. B., ‘‘A New Sc<strong>al</strong>e for the Measurement of Interperson<strong>al</strong> Trust,’’ Journ<strong>al</strong> ofPerson<strong>al</strong>ity, XXXV (1967), 651–665., ‘‘Gener<strong>al</strong>ized Expectancies for Interperson<strong>al</strong> Trust,’’ American Psychologist,XXVI (1971), 443–452.Schwarz, N., ‘‘Self-Reports: How the Questions Shape the Answers,’’ AmericanPsychologist, LIV (<strong>1999</strong>), 93–105.Sp<strong>al</strong>ding, L. R., and C. D. Hardin, ‘‘Unconscious Unease and Self-Handicapping:Behavior<strong>al</strong> Consequences of Individu<strong>al</strong> Differences in Implicit and ExplicitSelf-Esteem,’’ Psychologic<strong>al</strong> Science, X (<strong>1999</strong>), 535–539.