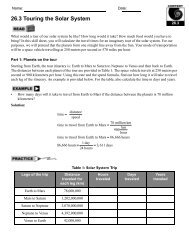
Sample Investigation - CPO Science
Sample Investigation - CPO Science
Sample Investigation - CPO Science

You also want an ePaper? Increase the reach of your titles
YUMPU automatically turns print PDFs into web optimized ePapers that Google loves.
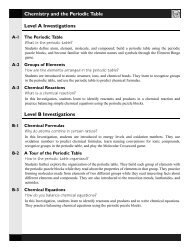
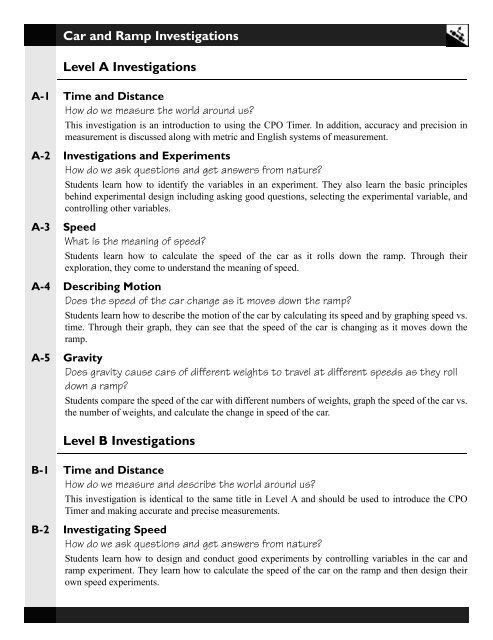
Car and Ramp <strong>Investigation</strong>sLevel A <strong>Investigation</strong>sA-1 Time and DistanceHow do we measure the world around us?This investigation is an introduction to using the <strong>CPO</strong> Timer. In addition, accuracy and precision inmeasurement is discussed along with metric and English systems of measurement.A-2 <strong>Investigation</strong>s and ExperimentsHow do we ask questions and get answers from nature?Students learn how to identify the variables in an experiment. They also learn the basic principlesbehind experimental design including asking good questions, selecting the experimental variable, andcontrolling other variables.A-3 SpeedWhat is the meaning of speed?Students learn how to calculate the speed of the car as it rolls down the ramp. Through theirexploration, they come to understand the meaning of speed.A-4 Describing MotionDoes the speed of the car change as it moves down the ramp?Students learn how to describe the motion of the car by calculating its speed and by graphing speed vs.time. Through their graph, they can see that the speed of the car is changing as it moves down theramp.A-5 GravityDoes gravity cause cars of different weights to travel at different speeds as they rolldown a ramp?Students compare the speed of the car with different numbers of weights, graph the speed of the car vs.the number of weights, and calculate the change in speed of the car.Level B <strong>Investigation</strong>sB-1 Time and DistanceHow do we measure and describe the world around us?This investigation is identical to the same title in Level A and should be used to introduce the <strong>CPO</strong>Timer and making accurate and precise measurements.B-2 Investigating SpeedHow do we ask questions and get answers from nature?Students learn how to design and conduct good experiments by controlling variables in the car andramp experiment. They learn how to calculate the speed of the car on the ramp and then design theirown speed experiments.
B-3 Using a Scientific Model to Predict SpeedCan you predict the speed of the car at any point on the ramp?Students measure the speed of the care at different points along the ramp. They make a speed vs.distance graph from their data and learn how to predict the speed of the car at other points on the rampfrom their graph. They test their predictions and determine their percent error.B-4 Distance and TimeHow do you model the motion of the car?Students model the motion of the car with a distance vs. time graph. They measure the slope of thegraph at three different points and discover that the slope of the line is equal to the speed of the car onthe ramp.B-5 AccelerationHow is the speed of the car changing?Students examine their data from <strong>Investigation</strong> B-4 and learn how to determine the acceleration of thecar. They also learn how to determine the acceleration of the car from the speed vs. time graph.B-6 Force, Mass, and AccelerationWhat is the relationship between force, mass, and acceleration?Students discover the mathematical relationship between force, mass and acceleration.B-7 Weight, Gravity, and FrictionHow does increasing the mass of the car affect its acceleration?Students investigate how adding weight affects the acceleration of the car.B-8 Equilibrium, Action and ReactionWhat makes an object move?Students learn that Newton’s third law of motion explains the physics of common objects andactivities. All forces come in pairs and that means whenever we push something, there is a reactionpushing back on us.Level C <strong>Investigation</strong>sC-1 Uniform Accelerated MotionHow do we describe and predict accelerated motion?Students derive and test a theory that predicts the speed, acceleration, and position of the car on theramp.C-2 Newton’s Laws of MotionWhat do the three laws of motion mean?First, students explore the meaning of the first and third laws using the car and ramp. Next, they collectcar and ramp data for force, mass, and acceleration. Finally, they derive the mathematical relationshipbetween force, mass, and acceleration and describe how their findings support the second law.C-3 The Inclined PlaneHow is the angle of the ramp related to the motion of the car?Students apply trigonometry and vectors to create a theoretical model for the motion of the car on theramp. They investigate different models for friction and determine how friction affects motion. theyincorporate friction into a theory which will predict the acceleration of the car to within 3%.
B-7 Weight, Gravity, and FrictionQuestion: How does increasing the mass of the car affect its acceleration?In this <strong>Investigation</strong>, you will:1. Explore how added weight affects a car’s acceleration.2. Discuss and learn whether or not heavier objects fall faster than lighter objects.3. Investigate friction and how friction affects motion.So far, you have learned that the car accelerates as it moves down the ramp. That is, its speed increasesover time. In the last <strong>Investigation</strong>, you explored what happened to the acceleration of a car when moreforce was applied to it.The force that you used in the last <strong>Investigation</strong> wasgravity. Gravity pulls all objects toward the center ofEarth with a force we call weight. The more mass anobject has, the greater its weight. If you increase theweight of the car, how will acceleration be affected?Do heavier objects fall faster than lighter ones?B-7ADo you think adding weights to the car will change its speed?a. You can add up to three weights to the car for this experiment.Weights are attached to the top of the car using the wing nut.b. Roll a car down the ramp with different amounts of weight andwatch it, without using photogates. Does the change in mass seem tomake a difference in the speed?Safety tip: Keep your fingers away from the ramp when the car is rolling. Especially,keep your hands away from the bottom of the ramp until the car stops.BTesting your hypothesisIt is difficult to know for sure that the car is goingfaster (or not) without making measurements. Set upthe car and ramp with two photogates. The photogatesshould be about 20 centimeters apart. Set the angle atthe seventh hole from the bottom of the stand.You will want to measure the mass of the car with noweights, and with one, two, and three weights. On thedata table, record the masses and the speeds at whichthe car rolled between the two photogates.1
B-7Mass(g)Mass and Speed DataDistance fromA to B (cm)Time fromA to B (sec)Speed(cm/sec)CDGraphing and analyzing the dataa. Make a graph of speed vs. mass using your data.b. Which is the dependent variable? On which axis does it go?c. Which is the independent variable? On which axis does it go?d. From your graph, what can you say about the effect of increasing mass on the speed of the car? Did thespeed change by a lot or by a little? Did the mass change by a lot or a little?FrictionTry the following experiment. Take a steel weight and a flat sheet of paper. Drop them both and thesteel weight will hit the ground before the paper every time. Next, crumple the sheet of paper and dothe experiment over. They should hit the ground about the same time.a. The crumpled paper has the same weight as the flat sheet of paper. What is the explanation for why thecrumpled sheet fell fast and the flat sheet fell slowly?b. The car has friction, even though the wheels have ball bearings. Can you think of a way to increase thefriction in the car? See if you can create enough friction so the car does not accelerate, but keeps thesame speed from one photogate to the next.EThinking about the resultsSuppose you have a jar of 1,000 marbles. If you lose one marble, it is hard to notice because 1 out of1,000 is a small change. If you only had 5 marbles in the jar, you would immediately notice if one weremissing because 1 out of 5 is a much larger change.a. We often express change in percent. One out of 5 is a change of 20 percent (1/5 × 100%). The percentchange is the change divided by what you started with, times 100 percent. Calculate the percent changefor the weight experiment.b. Does the percent change have anything to do with how much the speed changed as you added thesecond and third weights?2
Name:B-7 Weight, Gravity, and FrictionAQuestion: How does increasing the mass of the car affect its acceleration?Do you think adding weights to the car will change its speed?a. You can add up to three weights to the car for this experiment. Weights are attached to the top of the carusing the wing nut.b. Roll a car down the ramp with different amounts of weight and watch it, without using photogates.Does the change in mass seem to make a difference in the speed?B-7BTesting your hypothesisMass and Speed DataMass(g)Distance fromA to B (cm)Time fromA to B (sec)Speed(cm/sec)CGraphing and analyzing the dataa. Make a graph of speed vs. mass using your data (the blank grid is on the next page).b. Which is the dependent variable? On which axis does it go?c. Which is the independent variable? On which axis does it go?B-7 Weight, Gravity, and Friction Answer Sheet
B-7d. From your graph, what can you say about the effect of increasing mass on the speed of the car? Did thespeed change by a lot or by a little? Did the mass change by a lot or a little?DFrictiona. The crumpled paper has the same weight as the flat sheet of paper. What is the explanation for why thecrumpled sheet fell fast and the flat sheet fell slowly?b. The car has friction, even though the wheels have ball bearings. Can you think of a way to increase thefriction in the car? See if you can create enough friction so the car does not accelerate, but keeps thesame speed from one photogate to the next.B-7 Weight, Gravity, and Friction Answer Sheet
EThinking about the resultsSuppose you have a jar of 1,000 marbles. If you lose one marble, it is hard to notice because 1 out of1,000 is a small change. If you only had 5 marbles in the jar, you would immediately notice if one weremissing because 1 out of 5 is a much larger change.B-7a. We often express change in percent. One out of 5 is a change of 20 percent (1/5 × 100%). The percentchange is the change divided by what you started with, times 100 percent. Calculate the percent changefor the weight experiment.b. Does the percent change have anything to do with how much the speed changed as you added thesecond and third weights?B-7 Weight, Gravity, and Friction Answer Sheet
Questions1. What is the difference between the mass of an object and the weight of an object?B-72. Sue is skateboarding on her sidewalk. Her speed as she crosses a “crack” (expansion joint) is 2.5 feetper second on the first block and 3.0 feet per second 5 blocks later. The per cent of increase in herspeed is:(a) 5% (b) 20% (c) 83% (d) 120%.3. A group of students wanted to find out if heavier students would sled faster down a hill. Starting fromthe top of a hill, each student sled past a a friend who used a “speed gun” to determine their speed 20meters after they have began to move. Prepare a speed vs. weight graph of their data.Name Speed (miles/hour) Weight (pounds)Seth 12 144Leticia 16 121Martin 18 154Sandra 5 132Kellie 18 112Based on the data and your graph, can you reach a conclusion about weight and speed when sledding?Explain your answer.B-7 Weight, Gravity, and Friction Answer Sheet
Curriculum Resource Guide: Car and RampCredits<strong>CPO</strong> <strong>Science</strong> Curriculum Development TeamAuthor and President: Thomas Hsu, Ph.DVice Presidents: Thomas Narro and Lynda PennellWriters: Scott Eddleman, Mary Beth Abel, Lainie Ives, Erik Benton andPatsy DeCosterGraphic Artists: Bruce Holloway and Polly CrismanCurriculum ContributorsDavid Bliss and David LampTechnical ConsultantsTracy Morrow and Julie DaltonCurriculum Resource Guide: Car and RampCopyright 2002 Cambridge Physics OutletISBN 1-58892-046-12 3 4 5 6 7 8 9 - QWE - 05 04 03All rights reserved. No part of this work may be reproduced or transmitted in any form or by an means,electronic or mechanical, including photocopying and recording, or by any information store or retrievalsystem, without permission in writing. For permission and other rights under this copyright, please contact:Cambridge Physics Outlet26 Howley Street,Peabody, MA 01960(800) 932-5227http://www. cpo.comPrinted and Bound in the United States of America