Human and Social Devt.5.pdf - Pasay City Government
Human and Social Devt.5.pdf - Pasay City Government
Human and Social Devt.5.pdf - Pasay City Government
- No tags were found...

You also want an ePaper? Increase the reach of your titles
YUMPU automatically turns print PDFs into web optimized ePapers that Google loves.
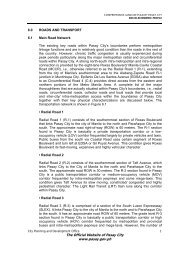
<strong>City</strong> of <strong>Pasay</strong>SOCIO-ECONOMIC PROFILETable 5.12Performance Indicators Public Schools, 1997-2000 (Continuation)Elementary CY- 97 CY- 98 CY- 99 CY- 2000 AVE PHIL9. Literacy Rate 100% 100% 100% 100% 100% 95.3810. Achievement Rate 42.06 62.48 58.55 57.24 42 94.76%11. Student- Textbook Ratio 1 1 1 1 1 NA12. NSAT 58.16 53.52 58.69 - 58 46.44Source: DECS website <strong>and</strong> Division of <strong>City</strong> Schools, <strong>Pasay</strong> <strong>City</strong>5.3 Housing <strong>and</strong> Resettlement5.3.1. HousingThe latest Census of Housing was vintage 1990. This report relies heavily on thisdata despite its being dated since important patterns <strong>and</strong> characteristics are stillapparent that will illuminate the housing situation in <strong>Pasay</strong>.<strong>Pasay</strong> as of 1990 had 61,539 houses exhibiting an annual growth of 1.3% from1980, which is twice as low as NCR (Table 5.13). Highest growth was registeredduring the 1970-1980 period. In the 1980-1990 period, vacant houses grew thehighest but <strong>Pasay</strong>’s rate was lower than NCR. This suggest that <strong>Pasay</strong> isutilizing more its existing houses <strong>and</strong> have less problems associated with vacanthouses.Out of the occupied housing units of 60,087, 62% are single houses (Table 5.14)in <strong>Pasay</strong>. Multi-unit residential with 9% follows this. In terms of household tooccupied housing units, <strong>Pasay</strong> had 1.229 which is significantly higher than NCR’s1.094. This suggests that <strong>Pasay</strong>’s has lot of households crammed in singlehouses especially in crowded residential areas. In terms of household populationto occupied housing unit, <strong>Pasay</strong> again has higher ratio relative to NCR. Thisreinforces the findings that <strong>Pasay</strong>’s housing was relatively congested.The construction materials of <strong>Pasay</strong>’s houses are relatively light (Table 5.16)when compared with NCR which is the proxy for the regional average. It hashigher percentage of house with wood as the construction materials. Thissuggests that <strong>Pasay</strong> has opportunities for non-light construction materials. At thesame time it also reflects the lower st<strong>and</strong>ards of production of many houses in thecity.Houses in <strong>Pasay</strong> was relatively new since 21% of its houses were built in the last15 years (Table 5.17) compared to the NCR’s 19%. There was a surge ofconstruction during the 1986-1990 period in the city. It has lower percentage ofhouses that needs no repair but conversely it has higher percentage of housesthat needs major repair. This suggests that <strong>Pasay</strong> would have houses needingreplacement maybe with more permanent structures. This reinforces thepreceding finding.Less than 50% of <strong>Pasay</strong> residents owned their houses while a significant sharerent their houses (Table 5.18). Many of them were in single <strong>and</strong> multi-unitresidential houses. This suggests that <strong>Pasay</strong> is quite vulnerable to the mobility ofits renting residents. This could be a reason for the decline of population of<strong>City</strong> Planning <strong>and</strong> Development Office 8The Official Website of <strong>Pasay</strong> <strong>City</strong>www.pasay.gov.ph