2010 Annual Report - Dorel Industries
2010 Annual Report - Dorel Industries
2010 Annual Report - Dorel Industries
- No tags were found...

Create successful ePaper yourself
Turn your PDF publications into a flip-book with our unique Google optimized e-Paper software.
2Investing for the Future<strong>Dorel</strong> is raising the bar on innovation to create better,safer products and is reinforcing its respected brands.4<strong>2010</strong> HighlightsA review of <strong>Dorel</strong>’s key events and quarterlyperformance.6Message to ShareholdersMartin Schwartz reports on <strong>Dorel</strong>’s record year andhow it is building for future growth.8Juvenile SegmentJuvenile’s top priority continues to be productinnovation and safety.12Recreational/Leisure SegmentRecreational/Leisure grew faster than the industry,a testament that our strategies are working.16Home Furnishings SegmentHome Furnishings sales were robust through the firsthalf, but a general downturn affected the second half.18<strong>Dorel</strong> in the Community<strong>Dorel</strong>’s divisions are involved in numerous communityorganizations. We highlight a few on page 18.20Sustainability<strong>Dorel</strong>’s sustainability initiatives span all divisionsthroughout its three segments.<strong>Annual</strong> <strong>Report</strong> <strong>2010</strong> 1
Investing forthe Future<strong>Dorel</strong> spent heavily in <strong>2010</strong>,funding projects to set it apartfrom the competition, raisingthe bar on innovation to createbetter, safer products and reinforcingits respected consumerbrands. The pages that followcatalogue just some of theseinvestments made in recentmonths. The opening of <strong>Dorel</strong>Juvenile Group’s ultra modernTechnical Centre for Child Safetyin Columbus, Indiana to enhance<strong>Dorel</strong>’s global car seat leadershipposition; a major ad campaignto support the Schwinn name;a substantial ramping-up ofCannondale’s involvement in procycling and further investmentsto support our growing operationsin Brazil are examples ofthe initiatives that will help <strong>Dorel</strong>grow in the years to come.Juvenile2<strong>Dorel</strong> <strong>Industries</strong> Inc.
Recreational / LeisureHome Furnishings<strong>Annual</strong> <strong>Report</strong> <strong>2010</strong> 3
<strong>2010</strong> HighlightsQ1<strong>Dorel</strong> announces plans to build multi-million dollar state-of-the-artcar seat Technical Center for Child Safety at its Columbus, Indianacar seat manufacturing campus. n Q1 record results: Revenues climb13.5% to US$596.3 million, net income rises 33.3% to US$37.4million. All three business segments contribute significant increases.Q2Apparel Footwear Group opens Metro-Vancouvercomplex to build on SUGOI’s 20 year history.n Cycling Sports Group, Asia Pacific is launched.n <strong>Dorel</strong> completes extension of revolving creditfacility. n Q2 results: Revenues up 10.3% toUS$607.7 million, net income jumps 41.9% toUS$35.1 million.Apparel Footwear Group opens Metro-Vancouver complexQ3<strong>Dorel</strong> introduces several new products at Cologne juvenile productsand Eurobike trade shows. n Cannondale announces majorcommitment to pro cycling with co-sponsorship of Liquigas Team.n Q3 results: Revenues increase 9.8% to US$569.5 million, netincome flat with prior year at US$30.1 million.Q4<strong>Dorel</strong> ranks top among innovation at premiere US juvenile trade show.Exciting product line-up across several categories unveiled. n <strong>Dorel</strong> is largestcompany to present at juvenile industry investor conference in New York City.n Q4 results: Revenues decreased 1.1% to US$539.5 million, net incomerose 4.2% to US$25.2 million. Full year revenue rose 8.1% to US$2.3 billion,net income grew 19.2% to US$127.9 million.4<strong>Dorel</strong> <strong>Industries</strong> Inc.
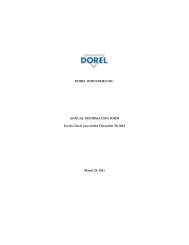
Financial Highlights from 2006 to <strong>2010</strong><strong>2010</strong> 2009 2008 2007 2006Revenues 2,312,986 2,140,114 2,181,880 1,813,672 1,771,168___________________________________________________________________________________________________Cost of sales*** 1,780,204 1,634,570 1,670,481 1,375,418 1,363,421___________________________________________________________________________________________________Gross profit 532,782 505,544 511,399 438,254 407,747as percent of revenues 23.0% 23.6% 23.4% 24.2% 23.0%___________________________________________________________________________________________________Operating expenses 392,064 377,093 378,660 317,117 303,802___________________________________________________________________________________________________Restructuring costs — 104 726 14,509 3,671___________________________________________________________________________________________________Income before income taxes 140,718 128,347 132,013 106,628 100,274as percent of revenues 6.1% 6.0% 6.1% 5.9% 5.7%___________________________________________________________________________________________________Income taxes 12,865 21,113 19,158 19,136 11,409___________________________________________________________________________________________________Net income 127,853 107,234 112,855 87,492 88,865as percent of revenues 5.5% 5.0% 5.2% 4.8% 5.0%___________________________________________________________________________________________________Earnings per shareBasic* 3.89 3.23 3.38 2.63 2.70Diluted* 3.85 3.21 3.38 2.63 2.70___________________________________________________________________________________________________Book value per shareat end of year** 36.14 33.64 30.38 28.08 24.33___________________________________________________________________________________________________* Adjusted to account for the weighted daily average number of shares outstanding.** Based on the number of shares outstanding at year end.*** Since the fiscal year ended December 30 2009, the company has applied CICA Handbook section 3031 inventories and accordingly,depreciation expense related to manufacturing activities is included in cost of sales starting in 2008.1,771,1681,813,6722,181,8802,140,1142,312,98688,86587,492112,855107,234127,8532.702.633.383.213.8506 07 08 09 10 06 07 08 09 10 06 07 08 09 10Revenues(In thousands of U.S. dollars)Net Income(In thousands of U.S. dollars)Earnings perDiluted Share (In U.S. dollars)<strong>Annual</strong> <strong>Report</strong> <strong>2010</strong> 5
Message toShareholders<strong>2010</strong> was <strong>Dorel</strong>’s best year ever. This issignificant given the challenges presentedby the year’s fragile economy and theeffect of foreign exchange rates.Dear fellow shareholder:I am pleased to report that <strong>2010</strong> was <strong>Dorel</strong>’s best year ever. Ourtop line increased 8% to US$2.3 billion and net income grewby 19% to US$127.9 million. This is significant given the challengespresented by the year’s fragile economy and the effect offoreign exchange rates. If there was ever a test of the acceptanceof <strong>Dorel</strong>’s brands and products, the past two years have providedit. The fact that we have done well through this periodspeaks volumes to our position in the many global markets inwhich we operate.Despite this overall success, the fourth quarter was difficult.Mass market point-of-sales levels for certain of our U.S. businessesslowed in the second half and replenishment orders werereduced. Retailers cut back further to lower their in-store inventorylevels. This significantly increased our year-end inventorylevels and affected cash flow. Higher container freight ratesand raw material costs also affected margins at our US juvenileand home furnishings divisions which persisted as of this writing.We have seen reduced inventories in our first quarter of2011 and expect new products to drive improvements in themonths ahead.Strategically investing for the futureWe continued to allocate funds to ensure that <strong>Dorel</strong> furthergrows its positions in the markets we serve. We spent strategicallyto distinguish ourselves from the competition. Considerablesums were earmarked in Juvenile and Recreational/Leisure,such as product development, safety initiatives and sportsmarketing.Underlining our focus on product innovation and safety, weopened the <strong>Dorel</strong> Technical Centre for Child Safety at ourColumbus, Indiana car seat manufacturing campus. The multimilliondollar centre will foster groundbreaking developmentsin child safety for years to come.We recognize the responsibility that comes with being a globalleader in our industry and we are committed to designing6<strong>Dorel</strong> <strong>Industries</strong> Inc.
products with safety and quality at the forefront. To ourknowledge, <strong>Dorel</strong> is the only juvenile products manufacturerwith such a highly specialized facility. Similar <strong>Dorel</strong> centresexist in Europe.To support the growing respect of our Cannondale line, ourRecreational/Leisure Segment ramped up its sponsorship ofone of the world’s premiere road racing teams. Cannondaleis now Co-Sponsor of the newly named Liquigas-CannondalePro Cycling Team. Our performance apparel division,SUGOI, is an apparel sponsor. <strong>2010</strong> was a remarkable yearfor the team, as it won two of the three major bike races inEurope and has attracted top athletes. We look forward to anexciting race year that will strongly reinforce the Cannondalebrand on an international scale.We also invested heavily in Schwinn with a major advertisingcampaign which reinforced one of the most iconicsports brands and meaningfully increased POS levels at massmerchants.We have done much to build for the years ahead. Geographicexpansion is an important road to our continued growth andwe are aggressively pursuing this path. Brazil is an excellentexample of how we can create a new platform in a newgeography, and, given the right local talent, proper marketresearch and the power of <strong>Dorel</strong>, create a winning scenario.Brazil was a solid contributor to our Juvenile Segment in<strong>2010</strong>.Our Segment Presidents and their teams have developedplans to create and maximize opportunities. Their remarksare in the pages that follow.Maximizing shareholder valueDespite the many excellent initiatives of the past year aswell as our robust financial performance, we feel our valuationis not where it should be. In addition to a respectablecompound annual growth rate, there are several compellingreasons to invest in <strong>Dorel</strong> including our deep and efficientmanagement structure, a portfolio of strong brands, valueaddedproducts that suit all budgets, continuous investmentsin our businesses, a quarterly dividend, and a proven abilityto generate cash flow.OutlookThe Recreational/Leisure Segment is on track to improve lastyear’s solid performance. While a small part of the segment,we are focused on correcting issues at the Apparel FootwearGroup. Juvenile operations in Europe and Canada have alsostarted off well, while the U.S. remains sluggish. We anticipatea better second half in the segment. Home Furnishingshad a solid month in February and we are hopeful that itsfull year will be solidly profitable.Last year’s higher input costs persist at this time. Upwardpressure on commodities will force us to seek price increaseswhich can negatively affect margins until pricing is properlyaligned with costs, and until new products are available.We expect 2011 sales and earnings from operations in allthree segments to exceed <strong>2010</strong> levels. This coupled with ananticipated improved working capital position will providefor positive free-cash flow this year.Our employees again demonstrated their commitment toproduct excellence and customer service. On behalf of SeniorManagement, I thank them for their dedication. I am alsograteful for our relationships with customers and suppliers.To our Board, sincere appreciation for the continuedguidance and to our shareholders, thank you for believingin <strong>Dorel</strong>.Martin SchwartzPresident and Chief Executive OfficerMarch 10, 2011<strong>Annual</strong> <strong>Report</strong> <strong>2010</strong> 7
8<strong>Dorel</strong> <strong>Industries</strong> Inc.
JuvenileSegmentInvesting for the Future<strong>Dorel</strong> maintained its proactive approach of strategically investing in its strongJuvenile Segment brands and infrastructure. Our juvenile brand portfolio isextensive with a diverse selection which addresses all price points. In NorthAmerica, we enjoy leading positions in the majority of the categories in whichwe operate, particularly car seats and strollers. In Europe, no other juvenilemanufacturer has the presence we do in the ranking of leading juvenile brands.<strong>Dorel</strong> invests heavily in R&D to ensure that we consistently bring industryleadinginnovation and safety to our customers.<strong>Annual</strong> <strong>Report</strong> <strong>2010</strong> 9
JuvenileSegmentAs the global leader in children’s car seats,<strong>Dorel</strong> recognizes the inherent responsibilityto raise the bar in cutting edge innovationwith the highest standards of qualityand safety.Conservative consumer spending was the barometer thatdefined <strong>2010</strong>. As the economy continued to recover from therecession, the <strong>Dorel</strong> Juvenile Segment saw optimistic resultsattributable to quality products at varied price points. Havingstrategically invested for the future, our top priority continuesto be product innovation and safety.EuropeAfter a challenging 2009, <strong>Dorel</strong> Europe was able to overcomea difficult economic environment as well as the volatility of theEuro exchange. Despite these hurdles, <strong>Dorel</strong> Europe was onceagain successful in staying ahead of the competition with itsestablished brands, continuous investments in product developmentand innovation.In addition to <strong>Dorel</strong> Europe’s ongoing focus on high pricepoint products, they have enlarged their mid price point offeringby increasing their Safety 1st product representation. Thishas proven to be a winning strategy. As a result, <strong>Dorel</strong> Europeis now able to expand its appeal to a wider customer base byoffering product at all price points.Maxi-Cosi and Bebé Confort, both signature brands and leadersin children’s car seats and strollers, have achieved materialgrowth due to their innovation and rapid global expansion.<strong>Dorel</strong> Europe’s ability to create exciting new products was underlinedby their distinctive designs featured during the <strong>2010</strong>Cologne, Germany trade show, one of the largest in the world.Product introductions such as the Elea stroller, Opal car seatand Zapp Xtra were enthusiastically received by customers andthe trade media.<strong>Dorel</strong> Europe’s commitment to customer excellence was againmanifested with further investments in the division’s infrastructure,specifically at its Portugal and UK distribution centres.North AmericaAs the economy continued to rebound from the recession,<strong>2010</strong> proved to be a challenging year for <strong>Dorel</strong> Juvenile GroupUSA (DJG USA). Consumers remained prudent with their10<strong>Dorel</strong> <strong>Industries</strong> Inc.
purchases and as the year wore on, retailers reacted by reducinginventories.Substantial resources have been devoted to product developmentat DJG USA. As the global leader in children’s car seats,<strong>Dorel</strong> recognizes the inherent responsibility to raise the bar incutting edge innovation with the highest standards of qualityand safety. In September <strong>2010</strong>, DJG USA opened the <strong>Dorel</strong>Technical Centre for Child Safety in Columbus, Indiana.The Centre features three crash test-sleds, increasing ourspeed-to-market by developing the most advanced car seatdesigns in the world. <strong>Dorel</strong> has centralized all of its NorthAmerican R&D and product development in child restraintsystems into this multi-million dollar facility.As a further indication of the innovation and commitmentDJG USA is bringing to the market, it developed Flex-Tech, a next generation carseat crash energy managementstructure, which is incorporated in the new Rumi and EssentialAir combination booster carseats. In addition, DJG USAhas the most complete line of infant carseat carriers, designedto include our “tiny fit” system to properly fit prematureinfants weighing as low as 4 pounds.<strong>Dorel</strong> Distribution Canada (DDC) has successfully differentiateditself through its Canadian-specific initiatives, solidifyingits leadership position within the juvenile market. This isevident by DDC’s improved year-over-year performance.The new Canadian Motor Vehicle Restraint Systems andBooster Seats Safety Regulations will come into effect January1, 2012; noteworthy changes being specific dynamicperformance testing criteria, such as testing with a lap andshoulder belt. DDC has undertaken the necessary measuresto ensure they meet and comply with this new regulation.International PlatformsMarket conditions in Australia also prompted the country’sjuvenile retailers to increase promotional activity and reducereplenishment orders. This affected <strong>Dorel</strong> Australia’s overallperformance, however its car seat and booster seat salesremained strong.<strong>Dorel</strong> Brazil has become an established profit generator,posting notable sales and earnings gains in <strong>2010</strong> as new locallegislation drove car seat sales. Supported by <strong>Dorel</strong>’s stronginternational brands, infrastructure and continuous productinnovation, we expect their operations will continue to grow.Juvenile Segment’s Growth PathIn addition to the initiatives outlined above, we are takingseveral other steps to augment our presence and reward <strong>Dorel</strong>shareholders. Worldwide market penetration is a key objectiveto extending our reach into other emerging territories.Our ventures in Australia and Brazil have proven to besuccessful.<strong>Dorel</strong>’s juvenile brands are recognized throughout much ofthe world. Our intention is to maximize this strength byensuring we have the safest and highest quality products andmaking certain that consumers have our products top ofmind. With the excellence of our juvenile teams across theglobe, I am confident we will continue to build on theleading market positions we have established.Hani BasileGroup President & CEOJuvenile Segment<strong>Annual</strong> <strong>Report</strong> <strong>2010</strong> 11
12<strong>Dorel</strong> <strong>Industries</strong> Inc.
Recreational / LeisureSegmentInvesting for the Future<strong>Dorel</strong> Recreational/Leisure has a comprehensive range of world class brandsavailable at retailers around the world. We’re known as trendsetters, withmillions invested to ensure the superiority of our brands, technology andproducts. Our business is driven by a highly engaged workforce, impassionedby the goal of delivering high-performance products to both the professionalathlete and the recreational cyclist. In <strong>2010</strong> <strong>Dorel</strong> invested globally in thegrowth of the segment and the future of the cycling industry.<strong>Annual</strong> <strong>Report</strong> <strong>2010</strong> 13
Recreational / LeisureSegmentWith a close to 14% increase in revenues,<strong>Dorel</strong>’s Recreational/Leisure Segmentgrew faster than the industry as we gainedmarket share, a testament that ourstrategies are working.Consumers impacted by the recession in 2009, began onceagain making recreational purchases in <strong>2010</strong>, as consumerconfidence stabilized. With a close to 14% increase inrevenues, <strong>Dorel</strong>’s Recreational/Leisure Segment grew fasterthan the industry as we gained market share, a testament thatour strategies are working. This was also supported by thecontinued global macro-trend of health, wellness and greeninitiatives.Our powerful, recognized, trusted brands and our growth relieson our ability to capitalize on these brands through ongoinginvestments that drive the business. Cannondale, Schwinn, GT,Mongoose, Iron Horse, and SUGOI, along with our Disneyand Nickelodeon licenses in the U.S. enable us to create innovative,inspired experiences for a fun, healthy world for a rangeof consumers – from the recreational rider to the elite athlete.Overall, our investments in our brands are up fifty percent intwo years, with a strong return on investment, an importantdemonstration that <strong>Dorel</strong> is a long-term player and is makingthe financial investments required to become a global leader inthe cycling industry.Intensive marketing initiativesIn mid-April <strong>2010</strong>, we launched a U.S. nationwide multi-milliondollar, multi-faceted Schwinn marketing campaign as partof a major relaunch of this 115 year old iconic brand. This wasa strategic investment, made to protect and further strengthena brand that is a pillar of the industry and an important partof our retailers’ business. It was met with enthusiastic supportfrom retailers across the board, doubled unaided brand awareness,and surpassed other key performance measures.In July, we unveiled the new GT campaign, “Earn YourWings,” an exciting take on a thirty year old brand with a richhistory in the industry. The campaign speaks to both what thebrand has meant to consumers over the years, and what it willmean in the future. GT has strong global growth momentumwith continued success in markets across Europe, Asia and inthe U.S.14<strong>Dorel</strong> <strong>Industries</strong> Inc.
In September, we were thrilled to announce Cannondale’snew co-sponsorship of the Liquigas Pro Cycling Team, asignificant increased investment in our relationship with theteam, now called Liquigas-Cannondale. There will be importantmarketing integration between Cannondale and theteam that will allow us to capitalize on consumers’ interestsin pro-cycling, and further advance our product innovation.Also, SUGOI has become the technical apparel sponsor forthe team. This creates key marketing synergies for them thatwill support our $3 million investment in a new, state-of-theartdigital custom apparel facility in Vancouver where we arenow producing completely customized team kits.Product development drives brand enhancementIn <strong>2010</strong>, we again created unmatched experiences for ourconsumers by investing in game changing products, like:the Cannondale Jekyll, a mountain bike with never beforeseen frame design and suspension innovation; the CannondaleCAAD 10, the world’s most advanced aluminum roadbike; and, the Schwinn Vestige, the winner of the prestigiousEurobike Gold Award made with environmentally friendlyFlax Fiber. Overall, our R&D investment is up fifty percentin two years.As we move through 2011, we are committed to investing forthe future and driving admirable business performance. Wewill continue to build our brands, design exceptional productand expand our business globally. Each division has plans tolaunch new, innovative products that will distinguish <strong>Dorel</strong>’sRecreational/Leisure Segment. Our brands have consistentlycreated fun, inspiring experiences for bicycle enthusiasts theworld over. This is because our employees are as passionateabout the products we build as the consumers who use them.I’m proud to be a part of this team, and look forward to theexcitement 2011 and beyond will bring.Robert P. Baird Jr.Group President & CEORecreational/Leisure SegmentStrategic partnerships that came to fruition in <strong>2010</strong>, suchas the one we have with Bosch have allowed us to invest intechnology to help propel the important e-bike category inEurope. Our expanded partnership with Nickelodeon in theU.S., has given us game changing market share with massretailers in the important children’s bike category.We also continued to focus on operational improvementsthat will help us better meet retailer needs. We introduceda more focused supply chain with fewer, bigger and betterpartners that will continue to pay dividends going forward.We have driven a twenty-five percent reduction in SKUs overtwo years to help meet the needs of our retailers, and betterrefine our brand and product architecture.<strong>Annual</strong> <strong>Report</strong> <strong>2010</strong> 15
Home FurnishingsSegmentConsumers have turned to <strong>Dorel</strong>’s furnitureselections because of their affordability andquality. Our divisions deliver what we believe isa value proposition which is difficult to beat.16<strong>Dorel</strong> <strong>Industries</strong> Inc.
<strong>2010</strong> was marked by a significant variation in consumerbuying habits. Sales of <strong>Dorel</strong>’s Home Furnishings productswere robust through the first half of the year, but an industry-widedownturn began with the crucial fall back-to-collegeperiod and lasted until late in the fourth quarter. This wasin part due to the continued weakness in the U.S. housingmarket and continued high U.S. unemployment.Higher costs for input materials such as steel, polyester andcotton as well as considerable increased container freightcosts experienced through the second and part of the thirdquarters had a definite impact on margins. The higher Canadiandollar was also a factor as two of our factories are locatedin Canada.Notwithstanding these realities, <strong>2010</strong>’s results were mostsatisfactory as we out-performed our industry peers. A keyto our success has always been to manage cost variations andincorporate them over time in a manner that is acceptable toour customers, retailers and shareholders.Our Home Furnishings Segment did produce increasedrevenues in <strong>2010</strong>. Consumers have turned to <strong>Dorel</strong>’s furnitureselections because of their affordability and quality. Ourdivisions deliver what we believe is a value proposition whichis difficult to beat.Last year we conducted intensive research to analyze themarket and accurately determine what shoppers want. Thisinsight has provided an understanding of their needs and wehave planned our product development accordingly.Divisional reviewEach of our divisions has implemented programs to remainahead of the curve.Ameriwood has maintained its offerings of value orientedready-to-assemble furniture, and has upheld its strict manufacturingefficiencies at its domestic facilities. As raw materialand labor cost uncertainties affected product from Asia,Ameriwood continued to deliver value product with shortlead times to our retail partners.<strong>Dorel</strong> Home Products (DHP) is holding its position asNorth America’s largest supplier of futons, with a selectionthat is both cost effective and appealing. DHP has hadsignificant revenue growth in <strong>2010</strong> due to an expandedproduct offering and an increased on-line presence.Efforts to realign Cosco Home & Office have proven beneficial.Continued improvement in sales and cost containmentresulted in a profitable year for the manufacturer of foldingfurniture, step stools and work platforms. A focused productapproach coupled with strategic marketing led to a numberof new retailer placements.<strong>Dorel</strong> Asia gained back lost ground with a selection of excitingimported items, including value oriented upholsteredrecliners, as well as other kitchen and dining products.Last year we pledged to strengthen our presence in Canada.A concerted effort at each of <strong>Dorel</strong>’s Home Furnishingsdivisions achieved the desired results with increased productlistings and volumes across all of our furniture product lines.Ecommerce initiatives also boosted results. Working intandem with our retail customers, we devoted more timeto the development of this sector and were able to attractsignificantly higher traffic, resulting in a meaningful increasein sales.Through 2011 we will continue to focus on expanded productdevelopment as well as increased efficiencies in our operationsand sales execution. <strong>Dorel</strong> Home Furnishings expectsanother year of solid performance as our products continueto provide quality and value to the consumer.Norman BraunsteinGroup President & CEOHome Furnishings SegmentAltra developed innovative new home office products, designedto be smaller, in keeping with changing technology,which are able to accommodate newer mobile devices such astablets.<strong>Annual</strong> <strong>Report</strong> <strong>2010</strong> 17
SUGOI was the Official Cycling Apparel Sponsorfor the <strong>2010</strong> Ride to Conquer Cancer – aseries of four epic two-day rides to raise moneyfor cancer research in Canada. A group ofSUGOI employees participated in the Calgaryride. Overall 4100 cyclists participated, raising$16.1 million.<strong>Dorel</strong> Juvenile Group is a strong supporterof the Make-A-Wish Foundation. The <strong>2010</strong>golf tournament luncheon featured a poignantspeech by Benet Bianchi, father of wishchild Francesca, who wished to swim with adolphin. Francesca’s artwork depicting her wish,titled “Believe,” was framed and presented to thetournament’s sponsors.This past holiday season, Schwinn donatedmore than 1000 children’s bikes and helmets tokids in need in communities across the UnitedStates. The bikes were donated through localBoys & Girls Clubs and Salvage Santa.18<strong>Dorel</strong> <strong>Industries</strong> Inc.
<strong>Dorel</strong> in the CommunityEmployees of Ameriwood and Altra reached outto families in earthquake-devastated Haiti lastJanuary, raising funds for much needed relief tothe disaster victims. In addition to the monetarydonation, more than a truckload of baby changingpads were donated to the Dorce Missionary.<strong>Dorel</strong> Europe in action for charity.<strong>Dorel</strong> Europe has been supporting TheodoraChildren’s Trust for several years. Itsobjective: providing laughter to hospitalisedchildren through the smiles and antics ofclowns. On Universal Children’s Day, <strong>Dorel</strong>Europe’s divisions joined forces raising morethan 15,000 euros for Theodora and similarclown doctor organisations.<strong>Annual</strong> <strong>Report</strong> <strong>2010</strong> 19
Sustainability<strong>Dorel</strong>’s sustainability initiatives span all divisions throughoutits three segments, and are designed to minimize the environmentalimpact on offices, plants and warehouse facilities.In addition, the Company has a Code of Conduct which allsuppliers must adhere to.Standard practices include the recycling or elimination ofpackaging materials such as shrink wrap, cardboard, plasticsand Styrofoam. Energy management systems for lightinginclude use of fluorescents, controls for intensity levels andmotion detectors to turn lights off when offices are not occupied.Many offices also utilize multiple high volume scannersto reduce paper usage and storage.As a leading bicycle company, <strong>Dorel</strong> has developed incentiveprograms to encourage bicycling, car pooling and bus usage.The Bethel headquarters for Cycling Sports Group has employeebike storage, showers and lockers. The new VancouverAFG facility has partnered with the local transit authority,renting bike lockers at a local SkyTrain station. The newplant has installed showers, lockers and changing rooms.Pacific Cycle has taken a novel approach to reducing carbonemissions. With several bicycle brands now housed in thesame offices, fewer people attend international trade shows.Center, designed to provide employees and their dependentswith increased access to Wellness, Primary Care, OccupationalHealth Services and Workplace Injury Services.The Center meets <strong>Dorel</strong>’s objective of creating an environmentwhere employees can achieve a healthy lifestyle. Theapproach is personal and proactive using data to track aperson’s health status. Individuals can use this informationto continuously monitor their health and make adjustmentsto become healthier people.<strong>Dorel</strong> Europe’s research and development center is progressivelyintegrating Life Cycle Assessment and ECO-designmethodology in their product development process toincrease the environmental benefits of new products.Employees at all European facilities are encouraged to usegreen modes of transportation such as cycling and car pooling.In the Netherlands, a team known as the “Green Spirit”seeks ways to reduce the use of paper and energy in offices.From employees to suppliers to customers, <strong>Dorel</strong> continuouslyparticipates and encourages global sustainability withthe long-term view of helping to improve our environment.<strong>Dorel</strong> Juvenile Group USA and Cosco Home and OfficeProducts have opened an on-site Health and Wellness20<strong>Dorel</strong> <strong>Industries</strong> Inc.
Board of DirectorsMartin SchwartzPresident and Chief Executive OfficerMartin Schwartz is a co-founder of Ridgewood <strong>Industries</strong> Ltd., whichwas merged with <strong>Dorel</strong> <strong>Industries</strong> Inc. and several other associatedcompanies to create the Company. Martin has been President andCEO of <strong>Dorel</strong> since 1992.Jeffrey SchwartzExecutive Vice-President, Chief Financial Officer and SecretaryJeffrey Schwartz, previously Vice President of the Juvenile Division ofthe Company, has been the Company’s Vice-President, Finance since1989. In 2003, Jeffrey’s title was changed to Executive Vice President,CFO and Secretary.Jeff SegelExecutive Vice-President, Sales & MarketingJeff Segel is a co-founder of Ridgewood <strong>Industries</strong> Ltd. Jeff has heldthe position of Vice-President, Sales & Marketing since 1987. In 2003,Jeff’s title changed to Executive Vice-President, Sales & Marketing.Alan SchwartzExecutive Vice-President, OperationsAlan Schwartz is a co-founder of Ridgewood <strong>Industries</strong> Ltd. Alan hasheld the position of Vice-President, Operations since 1989. In 2003,Alan’s title was changed to Executive Vice-President, Operations.Maurice Tousson* is the President and Chief Executive Officer ofCDREM Group Inc., a chain of retail stores known as Centre duRasoir or Personal Edge, a position he has held since January 2000.Mr. Tousson has held executive positions at well-known Canadianspecialty stores, including Chateau Stores of Canada, Consumers’Distributing and Sports Experts, with responsibilities for operations,finance, marketing and corporate development. In addition to <strong>Dorel</strong>,Mr. Tousson currently sits on the Board of Directors of severalprivately held companies. Mr. Tousson holds an MBA degree fromLong Island University in New York.Harold P. “Sonny” Gordon, Q.C.* is Chairman and a Director ofDundee Corporation since November 2001, prior to which he wasVice-Chairman of Hasbro Inc., a position he held until May 2002. Mr.Gordon has previously worked as a special assistant to a Minister of theGovernment of Canada, and was a managing partner ofStikeman Elliott LLP during his 28 year career as a practicing lawyer.In addition to <strong>Dorel</strong> and Dundee, Mr. Gordon also serves as a directoron the boards of Dundee Capital Markets Inc., Transcontinental Inc.,Fibrek Inc. and Pethealth Inc. Mr. Gordon is the chair of the HumanResources and Corporate Governance Committee.Alain Benedetti, FCA*** is the retired Vice-Chairman of Ernst& Young LLP, where he worked for 34 years, most recently as theCanadian area managing partner, overseeing all Canadian operations.Prior thereto, he was the managing partner for eastern Canada andthe Montreal office. Mr. Benedetti has extensive experience with bothpublic and private companies and currently serves on the Board ofDirectors of Russel Metals Inc and Imperial Tobacco Canada Limitedand as a Governor of Dynamic Mutual Funds. A former Chair of theCanadian Institute of Chartered Accountants, Mr. Benedetti has servedon the Audit Committee of the Company since 2004 and has been itschairperson since early 2005.Richard L. Markee, has been Chairman of The Vitamin Shoppe, apublicly traded retail chain, since September 2009. Prior to thatMr. Markee was Retail Operating Partner at Irving Place Capital, aposition he held since November 2006. During the same period he hasalso served on the Board of Directors of The Vitamin Shoppe. From1990 until 2006, Mr. Markee held various executive positions at Toys“R” Us, Inc, including Vice Chairman of Toys “R” Us, where he wasresponsible for the growth and expansion of Babies “R” Us. He wasalso Chairman of Toys “R” Us, Japan. Prior to joining the Toys “R” Usorganization, Mr. Markee was a Vice President of Target Stores.Mr. Markee is a graduate of the University of Wisconsin.Rupert Duchesne is the President, Chief Executive Officer and a Directorof Groupe Aeroplan Inc., the international loyalty-managementcompany that owns and operates the Aeroplan program in Canada,the Nectar programs in the UK & Italy, Air Miles Middle East (60%owned), as well as Carlson Marketing Worldwide. Groupe AeroplanInc. is listed on the TSX. Mr. Duchesne previously held a number ofsenior officer positions at Air Canada from 1996, and prior to that wasinvolved in strategy and investment consulting. He was previously aDirector of Alliance Atlantis Communications International Inc.Mr. Duchesne holds an MBA degree from Manchester Business Schooland a B.Sc (Hons) degree from Leeds University in the UK.* Members of the Audit Committee and the HumanResources and Corporate Governance Committee** Member of the Human Resources and CorporateGovernance Committee*** Member of the Audit CommitteeDian Cohen** is a well known economist and commentator, authorof several books on economic policy and recipient of the Order ofCanada. In addition to <strong>Dorel</strong>, she serves on the Boards of NorbordInc. and Brookfield Renewable Power Fund.<strong>Annual</strong> <strong>Report</strong> <strong>2010</strong> 21
Major OperationsJuvenileHani BasileGroup President & CEOJuvenile Segment<strong>Dorel</strong> Juvenile Group, Inc.Dave Taylor, President & CEO(Head Office)2525 State StreetColumbus, Indiana, USA 47201Tel: (812) 372-0141Design and Development25 Forbes Blvd, Suite 4Foxboro, MA, USA 02035Tel: (508) 216-1923<strong>Dorel</strong> Distribution CanadaMark Robbins, President(Head Office)873 Hodge StreetMontreal, Quebec, Canada H4N 2B1Tel: (514) 332-3737<strong>Dorel</strong> Portugal S.A.Rua Pedro Dias, nº 254480 - 614 Rio MauVila do CondePortugalTel: 252 248 530<strong>Dorel</strong> Hispania S.A.C/Pare Rodès n°26 Torre A 4°Edificio Del Llac Center08208 Sabadell (Barcelona)SpainTel: 902 11 92 58<strong>Dorel</strong> Juvenile Switzerland S.A.Chemin de la Colice 4 (Niveau 2)1023 CrissierSwitzerlandTel: 021 661 28 40<strong>Dorel</strong> Belgium SAAtomium Square 1/1771020 BrusselsBelgiumTel: 02 257 44 70<strong>Dorel</strong> BrazilRafael Camarano, President(Head Office)Setrada Campo Ururai, 1430Ururai, Campo Dos Goytacazes, RJBrazil 28040-000Tel : 55 22 2733 7269Avenida Moema, 177 Loja/TérreoMoemaSão Paulo-SPBrazil, 04077-020Tel: 55 11 2063 3827<strong>Dorel</strong> AustraliaRobert Berchik, President & CEOIGC <strong>Dorel</strong> Pty Ltd.655-685 Somerville RoadSunshine WestMelbourneVictoria, 3020AustraliaTel: 61-3-8311-53002855 Argentia Road, Unit 4Mississauga, Ontario, Canada L5N 8G6Tel: (905) 814-0854<strong>Dorel</strong> EuropeJean-Claude Jacomin, President & CEO(Head office)9, Boulevard Gamabetta (2nd floor)92130 Issy Les MoulineauxParis, FranceTel: 00 33 1 47 65 93 41<strong>Dorel</strong> France SAZ.I. - 9, Bd du Poitou - BP 90549309 Cholet CedexFranceTel: 00 33 2 41 49 23 23<strong>Dorel</strong> Italia SpAVia Verdi, 1424060 Telgate (Bergamo)ItalyTel: 0039 035 4421035Maxi Miliaan BVKorendjik 55704 RD HelmondNetherlandsTel: 0492 57 81 12<strong>Dorel</strong> Germany GMBHAugustinusstrasse 11 bD-50226 Frechen – KönigsdorfGermanyTel: 02234 96 430<strong>Dorel</strong> (U.K.) LimitedHertsmere House, Shenley RoadBorehamwood, HertfordshireUnited Kingdom WD6 1TETel: 020 8236 0707In Good Care (New Zealand) Ltd.P.O. Box 82377 Highland ParkMt Wellington New ZealandTel : 0800 62 8000Recreational / LeisureRobert P. Baird Jr.Group President & CEORecreational/Leisure SegmentCycling Sports Group (CSG)Cycling Sports Group Inc.Jeff McGuane, President, CSG North America(Head Office)16 Trowbridge DriveBethel, Connecticut, USA 06801Tel: (203) 749-700022<strong>Dorel</strong> <strong>Industries</strong> Inc.
172 Friendship Village Road,Bedford, Pennsylvania, 15522-6600, USATel: (814) 623-9073Cycling Sports Group Europe B.V.Hanzepoort 277570 GC, Oldenzaal, NetherlandsTel: 31 541 589898Cycling Sports Group UKVantage Way, The FulcrumPoole – DorsetUnited Kingdom BH12 4NUTel: 44 1202 732288Cycling Sports Group Australia Pty Ltd.Unit 8, 31-41 Bridge RoadStanmore N.S.W., 2048, AustraliaTel: 61-2-8595-4444Cannondale Japan KKNamba Sumiso Building 9F,4-19, Minami Horie 1-chome,Nishi-ku, Osaka 550-0015, JapanTel: 06-6110-9390Cannondale Sports Group GmbHTaiwan Branch435-1 Hou Chuang RoadPei Tun Taichung 40682, TaiwanTel: 886-4-2426-94222041 Cessna DriveVacaville, California, USA 95688-8712Tel: (707) 452-15009282 Pittsburgh AvenueRancho Cucamonga, California,USA 91730-5516Tel: (909) 481-5613Home FurnishingsNorman BraunsteinGroup President & CEOHome Furnishings SegmentAmeriwood <strong>Industries</strong>Rick Jackson, President & CEO(Head Office)410 East First Street SouthWright City, Missouri, USA 63390Tel: (636) 745-3351458 Second AvenueTiffin, Ohio, USA 44883Tel: (419) 447-74483305 Loyalist StreetCornwall, Ontario, Canada K6H 6W6Tel: (613) 937-0711Cosco Home & OfficeTroy Franks, Executive Vice-President andGeneral Manager2525 State StreetColumbus, Indiana, USA 47201Tel: (812) 372-0141<strong>Dorel</strong> – Consulting (Shanghai)Company Ltd.Jenny Chang, Vice-Presidentof Far Eastern OperationsRoom 205, No. 3203, Hong Mei RoadMinghang District, Shanghai 201103P.R. ChinaTel: 011-86-21-644-68999North American ShowroomCommerce and Design Building201 West Commerce Street, 9th FloorHighpoint, North Carolina, USA 27260Tel: (336) 889-9130Apparel Footwear Group (AFG)4084 McConnell CourtBurnaby, British ColumbiaCanada V5T 1M6Tel: (604) 875-0887Pacific Cycle Group (PCG)Alice Tillett, President(Head Office)4902 Hammersley RoadMadison, Wisconsin, USA 53711Tel: (608) 268-24684730 East Radio Tower LaneP.O. Box 344Olney, Illinois, USA 62450-4743Tel: (618) 393-2991<strong>Dorel</strong> Asia Inc.410 East First Street SouthWright City, Missouri, USA 63390Tel: (636) 745-3351Altra FurnitureSteve Warhaftig, Vice-Presidentand General Manager410 East First Street SouthWright City, Missouri, USA 63390Tel: (636) 745-3351<strong>Dorel</strong> Home ProductsIra Goldstein, Vice-Presidentand General Manager12345 Albert-Hudon Blvd., Suite 100Montreal, Quebec, Canada H1G 3K9Tel: (514) 323-1247<strong>Annual</strong> <strong>Report</strong> <strong>2010</strong> 23
OfficersMartin SchwartzPresident and Chief Executive OfficerAlan SchwartzExecutive Vice-President, OperationsJeff SegelExecutive Vice-President, Sales and MarketingJeffrey SchwartzExecutive Vice-President,Chief Financial Officer and SecretaryFrank RanaVice-President, Finance and Assistant-SecretaryEd WyseVice-President, Global ProcurementCorporate InformationHead Office<strong>Dorel</strong> <strong>Industries</strong> Inc.1255 Greene Avenue, Suite 300Westmount, Quebec, Canada H3Z 2A4LawyersHeenan Blaikie LLP1250 René-Lévesque Blvd. WestSuite 2500Montreal, Quebec, Canada H3B 4Y1Schiff Hardin & Waite233 South Wacker Drive6600 Sears TowerChicago, IL, U.S.A. 60606AuditorsKPMG LLP600 de Maisonneuve Blvd. WestSuite 1500Montreal, Quebec, Canada H3A 0A3Transfer Agent & RegistrarComputershare Investor Services Inc.100 University Avenue, 9th FloorToronto, Ontario, Canada M5J 2Y1service@computershare.comInvestor RelationsMaisonBrison CommunicationsRick Leckner2160 de la Montagne Street, Suite 400Montreal, Quebec, Canada H3G 2T3Tel.: (514) 731-0000Fax: (514) 731-4525email: rickl@maisonbrison.comStock Exchange ListingShare SymbolsTSX – DII.B; DII.A<strong>Annual</strong> Meeting of ShareholdersThursday, May 26, 2011, at 10 amOmni HotelSalon Pierre de Coubertin1050 Sherbrooke Street WestMontreal, Quebec H3A 2R6Designed and Written byMaisonBrison Communications24<strong>Dorel</strong> <strong>Industries</strong> Inc.
Management’s Discussion and Analysisand Consolidated Financial StatementsFor the year ended December 30, <strong>2010</strong>2 <strong>Annual</strong> Results 3 MD&A 36 Consolidated Financial Statements
<strong>Annual</strong> Results (2001-<strong>2010</strong>)<strong>2010</strong> 2009 2008 2007 2006 2005 2004 2003 2002 2001Revenues 2,312,986 2,140,114 2,181,880 1,813,672 1,771,168 1,760,865 1,709,074 1,180,777 992,073 916,769Cost of sales*** 1,780,204 1,634,570 1,670,481 1,375,418 1,363,421 1,367,217 1,315,921 874,763 760,423 718,123Gross profit 532,782 505,544 511,399 438,254 407,747 393,648 393,153 306,014 231,650 198,646as percent of revenues 23.0% 23.6% 23.4% 24.2% 23.0% 22.4% 23.0% 25.9% 23.4% 21.7%Operating expenses 392,064 377,093 378,660 317,117 303,802 279,753 286,180 206,663 145,956 147,353Restructuring costs andother one-time charges — 104 726 14,509 3,671 6,982 — — — 20,000Income before income taxes 140,718 128,347 132,013 106,628 100,274 106,913 106,973 99,351 85,694 31,293as percent of revenues 6.1% 6.0% 6.1% 5.9% 5.7% 6.1% 6.3% 8.4% 8.6% 3.4%Income taxes 12,865 21,113 19,158 19,136 11,409 15,591 6,897 25,151 24,099 4,731Net income fromcontinuing operations 127,853 107,234 112,855 87,492 88,865 91,322 100,076 74,200 61,595 26,562as percent of revenues 5.5% 5.0% 5.2% 4.8% 5.0% 5.2% 5.9% 6.3% 6.2% 2.9%Loss fromdiscontinued operations — — — — — — — — — (1,058)Net earnings 127,853 107,234 112,855 87,492 88,865 91,322 100,076 74,200 61,595 25,504as percent of revenues 5.5% 5.0% 5.2% 4.8% 5.0% 5.2% 5.9% 6.3% 6.2% 2.8%Earnings per shareBasic* 3.89 3.23 3.38 2.63 2.70 2.78 3.06 2.33 2.05 0.91Diluted* 3.85 3.21 3.38 2.63 2.70 2.77 3.04 2.29 2.00 0.89Book value per shareat end of year** 36.14 33.64 30.38 28.08 24.33 20.46 19.15 15.14 11.31 7.52* Adjusted to account for the weighted daily average number of shares outstanding.** Based on the number of shares outstanding at year end.*** Since the fiscal year ended December 30, 2009, the Company has applied CICA Handbook section 3031, inventories and accordingly, depreciation expense relatedto manufacturing activities is included in cost of sales starting in 2008.2<strong>Dorel</strong> <strong>Industries</strong> Inc.
Management’s Discussion and AnalysisThis Management’s Discussion and Analysis of financial conditions and results of operations (“MD&A”) should be read inconjunction with the consolidated financial statements for <strong>Dorel</strong> <strong>Industries</strong> Inc. (“<strong>Dorel</strong>” or “the Company”) for the fiscal yearsended December 30, <strong>2010</strong> and 2009 (“the Consolidated Financial Statements”), as well as with the notes to the ConsolidatedFinancial Statements. All financial information contained in this MD&A and in the Company’s Consolidated FinancialStatements are in US dollars, unless indicated otherwise, and have been prepared in accordance with Canadian generallyaccepted accounting principles (“GAAP”), using the US dollar as the reporting currency. Certain non-GAAP financial measuresare included in the MD&A which do not have a standardized meaning prescribed by GAAP and therefore may be unlikely tobe comparable to similar measures presented by other issuers. Contained within this MD&A are reconciliations of thesenon-GAAP financial measures to the most directly comparable financial measures calculated in accordance with GAAP. ThisMD&A is current as at March 10, 2011.Forward-looking statements are included in this MD&A. See the “Caution Regarding Forward Looking Information” includedat the end of this MD&A for a discussion of risks, uncertainties and assumptions relating to these statements. For a descriptionof the risks relating to the Company, see the “Market Risks and Uncertainties” section of this MD&A. Further information on<strong>Dorel</strong>’s public disclosures, including the Company’s <strong>Annual</strong> Information Form (“AIF”), are available on-line at www.sedar.comand <strong>Dorel</strong>’s website at www.dorel.com.Corporate OverviewThe Company’s head office is based in Montreal, Quebec, Canada. Established in 1962, the Company operates in nineteencountries with sales made throughout the world and employs approximately 4,700 people. <strong>Dorel</strong>’s ultimate goal is to produceinnovative, quality products and satisfy consumer needs while achieving maximum financial results for its shareholders. It operates inthree distinct reporting segments; Juvenile, Recreational / Leisure and Home Furnishings. The Company’s growth over the yearshas resulted from both increasing sales of existing businesses and by acquiring businesses that management believes add value tothe Company.Strategy<strong>Dorel</strong> is a world class juvenile products and bicycle company, as well as a North American furniture distributor that markets a wideassortment of furniture products. The Company’s products are domestically produced and imported. New product development,innovation and branding allow the Company to compete successfully in the three segments in which it operates. In the Juvenilesegment, <strong>Dorel</strong>’s powerfully branded products such as Quinny, Maxi-Cosi, Safety 1st, Bébé Confort and HOPPOP have shown theway to safety, originality and fashion. Similarly, its highly popular brands such as Cannondale, Schwinn, GT, Mongoose and IronHorse as well as SUGOI Apparel have made <strong>Dorel</strong> a principal player in the bicycle marketplace.Within each of the three segments, there are several operating divisions or subsidiaries. Each segment has its own President and isoperated independently by a separate group of managers. Senior management of the Company coordinates the businesses of allsegments and maximizes cross-selling, cross-marketing, procurement and other complementary business opportunities.<strong>Dorel</strong> conducts its business through a variety of sales and distribution arrangements. These consist of salaried employees; individualagents who carry the Company’s products on either an exclusive or non-exclusive basis; individual specialized agents who sellproducts, including <strong>Dorel</strong>’s, exclusively to one customer such as a major discount chain; and sales agencies which themselvesemploy their own sales force. While retailers carry out the bulk of the advertising of <strong>Dorel</strong>’s products, all of the segments market,advertise and promote their products through the use of advertisements in specific magazines, multi-product brochures, on-lineand other media outlets.In the case of Recreational / Leisure, event and team sponsorships are also an important marketing tool. As an example in <strong>2010</strong>,the Company announced that as of January 1st, 2011, it would become a Co-Sponsor of the Liquigas Pro Cycling team. The newlynamed Liquigas-Cannondale team name will appear prominently on team jerseys and there will be logo placement for Cannondaleon the Liquigas-Cannondale team vehicles, website and team clothing. This allows for significant marketing integration betweenCannondale and the team in order to showcase team riders and wins as well as capitalize on consumers’ interests in pro-cycling.<strong>Annual</strong> <strong>Report</strong> <strong>2010</strong> 3
<strong>Dorel</strong> believes that its commitment to providing a high quality, industry-leading level of service has allowed it to develop successfuland mutually beneficial relationships with major retailers. A high level of customer satisfaction has been achieved by fosteringparticularly close contacts between <strong>Dorel</strong>’s sales representatives and clients. Permanent, full-service agency account teams have beenestablished in close proximity to certain major accounts. These dedicated account teams provide these customers with the assurancethat inventory and supply requirements will be met and that issues will be immediately addressed.<strong>Dorel</strong> is a manufacturer as well as an importer of finished goods, the majority of the latter from overseas suppliers. As such, theCompany relies on its suppliers for both finished goods and raw materials and has always prided itself on establishing successfullong-term relationships both domestically and overseas. The Company has established a workforce of over 250 people in mainlandChina and Taiwan whose role is to ensure the highest standard of quality of its products and to ensure that the flow of product is notinterrupted. The on-going economic downturn has illustrated the quality of these supplier relationships in that <strong>Dorel</strong> has not beenadversely affected by its supplier base and their continuing ability to service <strong>Dorel</strong>.In addition to its solid supply chain, quality products and dedicated customer service, strong recognized consumer brands are animportant element of <strong>Dorel</strong>’s strategy. As examples, in North America, <strong>Dorel</strong>’s Schwinn and Cannondale product lines are amongthe most recognized brand names in the sporting goods industry. Safety 1st is a highly regarded <strong>Dorel</strong> brand in the North Americanjuvenile products market. Throughout Europe the Maxi-Cosi brand has become synonymous with quality car seats and in France,Bébé Confort is universally recognized and has superior brand awareness. These brands, and the fact that <strong>Dorel</strong> has a wide rangeof other brand names, allows for product and price differentiation within the same product categories. Product development is asignificant element of <strong>Dorel</strong>’s past and future growth. <strong>Dorel</strong> has invested heavily in this area, focusing on innovation, quality, safetyand speed to market with several design and product development centres. Over the past four years, <strong>Dorel</strong> has averaged spendingof over $30 million per year on new product development.Operating SegmentsJuvenileThe Juvenile segment manufactures and imports products such as infant car seats, strollers, high chairs, toddler beds, playpens,swings, furniture items and infant health and safety aids. Globally, within its principal categories, <strong>Dorel</strong>’s combined juvenileoperations make it the largest juvenile products company in the world. The segment operates in North America, Europe, Australiaand Brazil and exports product to almost 100 countries around the world. In <strong>2010</strong>, the Juvenile segment accounted for 45%of <strong>Dorel</strong>’s revenues.<strong>Dorel</strong> Juvenile Group (“DJG”) USA’s operations are headquartered in Columbus, Indiana, where North American manufacturingand car seat engineering is based, with facilities in Foxboro, Massachusetts and Ontario, California. With the exception of car seats,the majority of products are conceived, designed and developed at the Foxboro location. Car seat development is centralized atthe Company’s new state-of-the-art <strong>Dorel</strong> Technical Center for Child Safety in Columbus. <strong>Dorel</strong> Distribution Canada (“DDC”)is located in Montreal, Quebec with a sales force and showroom in Toronto, Ontario and sells to customers throughout Canada. Theprincipal brand names in North America are Cosco, Safety 1st , Maxi Cosi and Quinny. In addition, several brand names are usedunder license, the most significant being the well-recognized Disney and Eddie Bauer brands.In North America, the majority of juvenile sales are made to mass merchants, department stores and hardware/home centres, whereconsumers’ priorities are design oriented, with a focus on safety and quality at reasonable prices. Therefore sales to these channelsare principally entry level to mid-price point products. Using innovative product designs, higher-end price points are also beingserviced by these customers as they attempt to compete with smaller boutiques. There are several juvenile products companiesservicing the North American market with <strong>Dorel</strong> being among the three largest along with Graco (a part of the Newell Group ofcompanies) and Evenflo Company Inc.<strong>Dorel</strong> Europe is headquartered in Paris, France with major product design facilities located in Cholet, France and Helmond, Holland.Sales operations along with manufacturing and assembly facilities are located in France, Holland and Portugal. In addition, sales and/or distribution subsidiaries are located in Italy, Spain, the United Kingdom, Germany, Belgium and Switzerland. In Europe, productsare principally marketed under the brand names Bébé Confort, Maxi-Cosi, Quinny, Baby Relax, Safety 1st, HOPPOP and BABYART. In Europe, <strong>Dorel</strong> sells juvenile products primarily across the mid-level to high-end price points. With its well recognized brandnames and superior designs and product quality, the majority of European sales are made to large European juvenile product chainsalong with independent boutiques and specialty stores. <strong>Dorel</strong> is one of the largest juvenile products companies in Europe, competingwith others such as Britax, Peg Perego, Chicco, Jane and Graco, as well as several smaller companies.4<strong>Dorel</strong> <strong>Industries</strong> Inc.
In Australia, <strong>Dorel</strong> is the majority shareholder in IGC <strong>Dorel</strong> (“IGC”) which manufactures and distributes its products underseveral local brands, the most prominent of which are Bertini and Mother’s Choice. IGC has also introduced <strong>Dorel</strong>’s NorthAmerican and European brands in Australia and New Zealand, broadening their sales range. Sales are made to both large retailersand specialty stores. <strong>Dorel</strong> is also the majority shareholder in <strong>Dorel</strong> Brazil. Significant operations began in <strong>2010</strong> as <strong>Dorel</strong> Brazilbegan to manufacture car seats locally and import other juvenile products. <strong>Dorel</strong> Asia sells juvenile furniture to various majorretailers. Over and above its branded sales, many of <strong>Dorel</strong>’s juvenile divisions also sell products to customers which are marketedunder various house brand names.Recreational / LeisureThe Recreational / Leisure segment’s businesses participate in a marketplace that totals approximately $55 billion in retail salesannually. This includes bicycles, bicycling and running footwear and apparel, jogging strollers and bicycles trailers, as well asrelated parts and accessories. The breakdown of bicycle industry sales around the world is approximately 50% in the Asia-Pacificregion, 22% in Europe, 12% in North America, with the balance in the rest of the world. Bicycles are sold in the mass merchantchannel, at independent bicycle dealers (“IBD”) as well as in the sporting goods chains. In <strong>2010</strong>, the Recreational/Leisure segmentaccounted for 33% of <strong>Dorel</strong>’s revenues.In the US, mass merchants have captured a greater share of the market over the past 15 years and today account for over 70%of unit sales. Despite the growth of the mass merchant channel, the IBD channel remains an important retail outlet in NorthAmerica, Europe and other parts of the world. IBD retailers specialize in higher-end bicycles and deliver a level of service to theircustomers that the mass merchants cannot. Retail prices in the IBD’s are much higher, reaching up to over $10,000. This comparesto the mass merchant channel where the average retail price is less than $100. The sporting goods chains sell bicycles in themid-price range and in the US this channel accounts for less than 10% of total industry retail sales.Brand differentiation is an important part of the bicycle industry with different brands being found in the different distributionchannels. High-end bicycles and brands would be found in IBD’s and some sporting goods chains, whereas the other brands can bepurchased at mass market retailers. Consumer purchasing patterns are generally influenced by economic conditions, weather andseasonality. Principal competitors include Huffy, Dynacraft, Trek, Giant, Specialized, Scott and Raleigh. In Europe, the market ismuch more fragmented as there is additional competition from much smaller companies that are popular in different regions.The segment’s worldwide headquarters is based in Bethel, Connecticut. There are also significant operations in Madison, Wisconsinand Vancouver, British Columbia. In addition, distribution centres are located in California and Illinois. European operations areheadquartered in Oldenzaal, Holland with operations in Basel, Switzerland. Globally there are sales and distribution companiesbased in Australia, the United Kingdom and Japan. There is a sourcing operation based in Taiwan established to oversee thesegment’s Far East supplier base and logistics chain, ensuring that the Company’s products are produced to meet the exactingquality standards that are required.The IBD retail channel is serviced by the Cycling Sports Group (“CSG”) which focuses exclusively on this category principallywith the premium-oriented Cannondale, SUGOI and GT brands. Pacific Cycle has an exclusive focus on mass merchant andsporting goods chain customers. The mass merchant product line is sold mainly under the Schwinn and Mongoose brands whichare used on bicycles, parts and accessories. However, in Europe and elsewhere around the world, certain brands are sold acrossthese distribution channels and as an example, in the UK, Mongoose is a very successful IBD brand. Sales of sports apparel andrelated products are made by the Apparel Footwear Group (“AFG”) through the IBDs, various sporting good chains and specialtyrunning stores. AFG’s principal brand is SUGOI and its major competitors are Nike, Pearl Izumi, Adidas, among others, as wellas some of the bicycle brands.<strong>Annual</strong> <strong>Report</strong> <strong>2010</strong>5
Home Furnishings<strong>Dorel</strong>’s Home Furnishings segment participates in the $80 billion North American furniture industry. <strong>Dorel</strong> ranks in the top tenof North American furniture manufacturers and marketers and has a strong foothold in both North American manufacturing andimportation of furniture, with a significant portion of its supply coming from its own manufacturing facilities and the balancethrough sourcing efforts in Asia. <strong>Dorel</strong> is also the number two manufacturer of Ready-to-Assemble (“RTA”) furniture in NorthAmerica. Products are distributed from our North American manufacturing locations as well as from several distribution facilities.In <strong>2010</strong>, this segment accounted for 22% of <strong>Dorel</strong>’s revenues.<strong>Dorel</strong>’s Home Furnishings segment consists of five operating divisions. They are Ameriwood <strong>Industries</strong> (“Ameriwood”), AltraFurniture (“Altra”), Cosco Home & Office (“Cosco”), <strong>Dorel</strong> Home Products (“DHP”) and <strong>Dorel</strong> Asia. Ameriwood specializesin domestically manufactured RTA furniture and is headquartered in Wright City, Missouri. Ameriwood’s manufacturing anddistribution facilities are located in Tiffin, Ohio, Dowagiac, Michigan, and Cornwall, Ontario. Altra Furniture is also locatedin Wright City, Missouri and designs and imports furniture mainly within the home entertainment and home office categories.Cosco is located in Columbus, Indiana and the majority of its sales are of metal folding furniture, step stools and specialty ladders.DHP, located in Montreal, Quebec, manufactures futons and baby mattresses and imports futons, bunk beds and other accentfurniture. <strong>Dorel</strong> Asia specializes in sourcing upholstery and a full range of finished goods from Asia for distribution throughoutNorth America. Major distribution facilities are also located in California, Georgia and Quebec.While industry furniture sales increased slightly in <strong>2010</strong> for the first time since 2007, <strong>Dorel</strong>’s sales in home furnishings continuedits fourth consecutive year of growth outpacing the market. <strong>Dorel</strong> has significant market share within its product categories andhas a strong presence with its customer base. Sales are concentrated with mass merchants, warehouse clubs, home centres, andoffice and electronic superstores. <strong>Dorel</strong> markets its products under generic retail house brands as well as under a range of brandedproduct including; Ameriwood, Altra, System Build, Ridgewood, DHP, <strong>Dorel</strong> Fine Furniture, and Cosco. The <strong>Dorel</strong> HomeFurnishings segment has many competitors including Sauder Manufacturing in the RTA category, Meco in the folding furniturecategory, and Werner in ladders.Significant Events in <strong>2010</strong>On March 30, <strong>2010</strong>, the Company announced that it intended to make a normal course issuer bid (NCIB). The Board ofDirectors of <strong>Dorel</strong> considers that the underlying value of <strong>Dorel</strong> may not be reflected in the market price of its Class BSubordinate Voting Shares at certain times during the term of the normal course issuer bid. The Board has therefore concludedthat the repurchase of shares at certain market prices may constitute an appropriate use of financial resources and be beneficialto <strong>Dorel</strong> and its shareholders.Under the NCIB, <strong>Dorel</strong> is entitled to repurchase for cancellation up to 700,000 Class B Subordinate Voting Shares over a twelvemonthperiod commencing April 1, <strong>2010</strong> and ending March 31, 2011, representing 2.4% of <strong>Dorel</strong>’s issued and outstanding ClassB Subordinate Voting Shares. The purchases by <strong>Dorel</strong> are being effected through the facilities of the Toronto Stock Exchange andare at the market price of the Class B Subordinate Voting Shares at the time of the purchase.Under the policies of the Toronto Stock Exchange <strong>Dorel</strong> has the right to repurchase during any one trading day a maximum of13,583 Class B Subordinate Voting Shares, representing 25% of the average daily trading volume. In addition, <strong>Dorel</strong> may make,once per calendar week, a block purchase (as such term is defined in the TSX Company Manual) of Class B Subordinate VotingShares not directly or indirectly owned by insiders of <strong>Dorel</strong>, in accordance with the policies of the Toronto Stock Exchange.On April 6, <strong>2010</strong>, the Company announced that it secured new long-term financing by issuing $50 million of Series “A” SeniorGuaranteed Notes and $150 million of Series “B” Senior Guaranteed Notes, bearing interest at 4.24% and 5.14%, respectively.The Notes were purchased by a group of institutional investors including Prudential Capital Group, an institutional investmentbusiness of Prudential Financial, Inc. The principal repayment of the Series “A” Senior Guaranteed Notes is due in April 2015,whereas the principal repayments of the Series “B” Senior Guaranteed Notes begin in April 2013 with the final payment due inApril 2020. In addition, on June 16, <strong>2010</strong> it was announced that the Company had completed the extension of its revolvingcredit facility. This three-year agreement which is effective July 1, <strong>2010</strong> and expires July 1, 2013 was co-led by the Royal Bank ofCanada and the Bank of Montreal. The facility allows for borrowing up to $300 million and contains provisions to borrow up toan additional $200 million.6<strong>Dorel</strong> <strong>Industries</strong> Inc.
Operating ResultsNote: all tabular figures are in thousands of US dollars except per share amountsFollowing is a selected summary of <strong>Dorel</strong>’s operating results on an annual and quarterly basis.Selected Financial InformationOperating Results for the Years ended December 30:<strong>2010</strong> 2009 2008% of % of % of$ revenues $ revenues $ revenuesRevenues 2,312,986 100.0 2,140,114 100.0 2,181,880 100.0Net income 127,853 5.5 107,234 5.0 112,855 5.2Cash dividends declared per share 0.58 0.50 0.50Earnings per share:Basic 3.89 3.23 3.38Diluted 3.85 3.21 3.38Operating Results for the Quarters Ended31-Mar-10 30-Jun-10 30-Sep-10 30-Dec-10$ $ $ $Revenues 596,313 607,695 569,455 539,523Net income 37,367 35,131 30,119 25,236Earnings per share:Basic 1.13 1.07 0.92 0.77Diluted 1.12 1.05 0.91 0.76Operating Results for the Quarters Ended31-Mar-09 30-Jun-09 30-Sep-09 30-Dec-09$ $ $ $Revenues 525,230 551,123 518,458 545,303Net income 28,029 24,764 30,230 24,211Earnings per share:Basic 0.84 0.74 0.91 0.73Diluted 0.84 0.74 0.91 0.73<strong>Annual</strong> <strong>Report</strong> <strong>2010</strong> 7
Income Statement – Overview<strong>2010</strong> versus 2009Tabular SummariesVariations in revenue across the Company segments:Fourth QuarterYear-to-Date<strong>2010</strong> 2009 Increase (decrease) <strong>2010</strong> 2009 Increase (decrease)$ $ $ % $ $ $ %Juvenile 236,204 248,521 (12,317) (5.0) 1,030,209 995,014 35,195 3.5Recreational / Leisure 205,892 175,670 30,222 17.2 774,987 681,366 93,621 13.7Home Furnishings 97,427 121,112 (23,685) (19.6) 507,790 463,734 44,056 9.5Total Revenues 539,523 545,303 (5,780) (1.1) 2,312,986 2,140,114 172,872 8.1Principal changes in earnings:4th Qtr Year-to-Date$ $Earnings from operations by segment:Juvenile increase (decrease) (6,388) 2,534Recreational / Leisure increase 1,619 12,488Home Furnishings decrease (6,502) (2,013)Total earnings from operations increase (decrease) (11,271) 13,009Increase in interest costs (2,021) (2,552)Decrease in income taxes 12,256 8,248Other 2,061 1,914Total increase in net income 1,025 20,619As described in the Corporate Overview section, the Company’s operating segments are aided in their ability to effectively managechallenging economic conditions like those experienced in <strong>2010</strong> due to the nature of its products and its strong commitment to newproduct development and brand support. In an environment of reduced consumer discretionary spending and rising input costs,<strong>Dorel</strong> was able to deliver revenue growth of over 8% and improved net income to $127.9 million. Revenue increases were in all threeoperating segments and only the Home Furnishings segment had lower earnings than in the prior year.For fiscal <strong>2010</strong>, <strong>Dorel</strong> recorded revenues of $2,313 million an increase of 8.1% from 2009. Sales improved by 3.5% in theJuvenile segment, 13.7% in Recreational / Leisure and 9.5% in Home Furnishings. If the impact of business acquisitions andyear over year foreign exchange rate variations are excluded, organic sales growth in <strong>2010</strong> was just above 7%. Net income forthe full year amounted to $127.9 million or $3.85 per share fully diluted, compared to 2009 net income of $107.2 million or$3.21 per diluted share.Gross margins for the year were 23.0% as compared to 23.6% recorded in the prior year. As described in more detail below,prior year margins include out-of-period foreign exchange pre-tax losses of $14.2 million related to the Company’s foreigncurrency hedging program. Note that this equates to $10.0 million after-tax, or the equivalent of $0.30 per diluted share. Ifthese losses are excluded from the results of the prior year, the margins in 2009 were 24.3%, meaning margins declined by130 basis points in <strong>2010</strong>. The principal causes were the adverse effect of higher container freight rates and raw material costincreases. Other than the out-of-period foreign exchange losses, foreign exchange rates were less favourable in <strong>2010</strong>, which alsonegatively affected margins. While earnings in <strong>2010</strong> do not include material out-of-period foreign exchange amounts, currencyrate variations versus last year have reduced earnings in all three segments.8<strong>Dorel</strong> <strong>Industries</strong> Inc.
As referred to above, to protect itself from variations in foreign exchange rates and their impact on its earnings and cash flow, theCompany may enter into foreign exchange forward contracts and other types of derivative financial instruments. The great majorityof these are held at <strong>Dorel</strong> Europe within the Juvenile segment. In the past, the majority of these instruments did not qualify tofollow the accounting practice of “hedge accounting”, and therefore non-cash “mark-to-market” losses were recognized in thestatement of income, representing the difference between the contracted exchange rate and the market rate on these instrumentsat the end of a given reporting period. These out-of-period losses were recognized relative to fluctuations in current exchange ratesas opposed to the date of maturity of the contracts, when the cash flow impact is recorded.Selling, general and administrative (“S, G & A”) expenses increased from 2009 levels at $328.1 million versus $316.3 millionthe year before. Of note, as a percentage of revenues this is a decline of 60 basis points from 14.8% to 14.2%. Research anddevelopment costs expensed in the year decreased from the prior year by $3.6 million. Note that the amount expensed in theyear for research and development is not reflective of the total costs incurred by the Company as a portion of these amounts arecapitalized. Combined, the amounts capitalized and expensed were consistent year over year at approximately $30 million.Total interest costs in <strong>2010</strong> were $18.9 million versus $16.4 million in the prior year. The full year interest rate on its long-termborrowings was approximately 3.9%, an increase from 3.1% in 2009. The benefit of lower borrowings in <strong>2010</strong> were more than offsetby the higher borrowing rate as well as $2.6 million related to interest recorded on the Company’s contingent consideration relatedto certain of its business acquisitions.Income before income taxes was $140.7 million in <strong>2010</strong> versus $128.3 million in 2009, an increase of $12.4 million or 9.6%. Asa multi-national company, <strong>Dorel</strong> is resident in numerous countries and therefore subject to different tax rates in those various taxjurisdictions and by the interpretation and application of these tax laws, as well as the application of income tax treaties betweenvarious countries. As such, significant variations from year to year in the Company’s combined tax rate can occur.In <strong>2010</strong> the Company’s effective tax rate was 9.1% as compared to 16.4% in 2009. A significant reason for the rate decreasewas the recognition of incremental tax benefits of $9.7 million pertaining to the resolution of several prior years’ estimated taxpositions. This non-cash amount was not recognized for accounting purposes in prior years and was only recorded in thefourth quarter of <strong>2010</strong> when the relevant tax authorities confirmed the recognition of these benefits. If this amount isexcluded, the Company’s tax rate for the year was 16.0%, comparable to the prior year. Net income for the full year amountedto $127.9 million or $3.85 per share fully diluted, compared to 2009 net income of $107.2 million or $3.21 per diluted share.The Company’s statutory tax rate is 29.3%. The variation from 29.3% to 9.1% can be explained as follows:$ %PROVISION FOR INCOME TAXES 41,230 29.3ADD (DEDUCT) EFFECT OF:Difference in effective tax rates of foreign subsidiaries (7,989) (5.7)Recovery of income taxes arising from the use of unrecorded tax benefits (16,652) (11.8)One time adjustment for us functional currency election (2,725) (1.9)Change in valuation allowance 765 0.5Non-deductible stock options 1,194 0.8Other non-deductible items (2,957) (2.1)Change in future income taxes resulting from changes in tax rates 2,087 1.5Effect of foreign exchange (1,343) (1.0)Other – Net (745) (0.5)PROVISION FOR INCOME TAXES 12,865 9.1<strong>Annual</strong> <strong>Report</strong> <strong>2010</strong> 9
Fourth quarter <strong>2010</strong> versus 2009OverviewRevenues for the fourth quarter were $539.5 million compared to $545.3 million a year ago, a decrease of 1.1%. Afterremoving the effect of varying rates of exchange year over year, organic revenue growth was just under 1%. Revenues in theRecreational / Leisure segment increased by 17.2% with strong growth in sales to both the mass market channel and IBDcustomers. In Juvenile, sales increased in all markets except in the U.S. However, more than offsetting these increases were thereduced sales in the U.S. and the lower Euro to U.S. dollar exchange rate. The result was a decline in revenues of 5.0%. In HomeFurnishings, like in Juvenile, U.S. sales were negatively impacted by certain customers reducing orders below expectations in thefourth quarter. As a result revenues decreased by 19.6%.Gross margins in the fourth quarter of <strong>2010</strong> decreased to 22.5% from 24.3% in the prior year. In <strong>2010</strong>, the Company wasadversely affected by higher container freight costs and raw materials cost increases, as well as the negative impact of variations inforeign exchange rates. This was compounded by the much lower sales volumes in the U.S. in the Home Furnishings segment andat DJG USA, which had the impact of lowering fixed overhead cost absorption and decreasing margins.S, G & A costs were flat with the prior year at $83.3 million versus $83.2 million. Within S, G & A, higher costs at Recreational /Leisure were mainly offset by Home Furnishings reductions. Product liability costs in the U.S. in the quarter were lower than theprior year by $2.1 million. Research and development (“R & D”) costs decreased by $2.7 million as 2009 included a write-off of$2.8 million of previously capitalized research and development costs incurred for certain projects.In the fourth quarter, interest costs were higher by $2.0 million as a result of a higher average borrowing rate and an increase ininterest recorded on the Company’s contingent consideration related to certain of its business acquisitions. Income before incometaxes was $19.8 million in <strong>2010</strong> versus $31.0 million in 2009, a decrease of $11.2 million or 36.2%. In the quarter, an income taxrecovery of $5.5 million was recorded. This compares to a tax rate of 21.9% in the prior year’s quarter. The main reason for therecovery was the recognition of incremental tax benefits pertaining to the resolution of several prior years’ estimated tax positions asdescribed above. As a result, net income for the fourth quarter was $25.2 million, an increase from $24.2 million in 2009. Earningsper share for the quarter were $0.76 fully diluted, compared to $0.73 per share in the fourth quarter the previous year.Segment ResultsFourth Quarters Ended December 30<strong>2010</strong> 2009$ % of rev. $ % of rev. Change %JuvenileRevenues 236,204 248,521 (5.0)Gross Profit 62,861 26.6 69,860 28.1 (10.0)Earnings from operations 14,575 6.2 20,963 8.4 (30.5)Recreational / LeisureRevenues 205,892 175,670 17.2Gross Profit 46,491 22.6 38,688 22.0 20.2Earnings from operations 10,608 5.2 8,989 5.1 18.0Home FurnishingsRevenues 97,427 121,112 (19.6)Gross Profit 11,870 12.2 23,931 19.8 (50.4)Earnings from operations 5,588 5.7 12,090 10.0 (53.8)10<strong>Dorel</strong> <strong>Industries</strong> Inc.
The Juvenile segment revenue decrease in the fourth quarter was 5.0%, however, excluding the impact of foreign exchange, theorganic sales decline was less than 2%. The decline was due to a slowdown at retail that occurred in the U.S. Sales in the segment’sother markets increased, but the increases were not sufficient to offset the decline. In Europe, local currency sales increased by4.9%, driven by car seat growth. The markets with the strongest gains were Germany and exports, principally to Eastern Europe.Tempering these gains was a drop in sales in Spain, where the economic recovery is lagging behind the rest of Europe. Uponconversion to U.S. dollars, European revenues declined by 3.5% due to the lower rate of exchange in <strong>2010</strong>. Sales in Canadaimproved over last year and though less than 10% of total segment sales, Brazil and Australia both posted increased sales in thefourth quarter of <strong>2010</strong>.Juvenile gross margins were lower in the fourth quarter by 150 basis points. However, in the prior year’s fourth quarter, contraryto the full year results which included out-of-period foreign exchange losses related to foreign exchange contracts, these foreignexchange amounts were gains, which added 130 basis points to the gross margin in 2009. Therefore if these gains are excluded,prior year fourth quarter gross margins were 26.8%, consistent with <strong>2010</strong>. S, G & A costs were $39.7 million versus $37.4 millionin the prior year. The 2009 quarter included a reclassification to overhead of $2.8 million, reducing S, G & A, explaining the bulkof the increase. Research and developments costs decreased by $3.1 million due to a large capitalized R & D write-off as describedabove. As a result, earnings from operations declined by $6.4 million or 30.5% from the prior year.Recreational / Leisure segment revenues in the fourth quarter of <strong>2010</strong> increased by $30.2 million, or 17.2%. Note that none of theincrease came from acquired businesses and organic sales increased by almost 19% when the impact of varying rates of exchangerelative to the U.S. dollar are excluded. Sales increased to the mass market chain, supported by the successful Schwinn brandmarketing campaign that began earlier in the year and which was revived in the fourth quarter for the holiday shopping period.Sales to IBD customers also increased as successful new model introductions are driving sales. These increases are occurring inboth Europe and North America. Importantly, the increase is also in the majority of the brands sold to the IBD customers and isnot limited to the Cannondale brand.Gross margins in the quarter improved in <strong>2010</strong> to 22.6% from 22.0% the year before. The main reason for this was improvedmargins at CSG as the benefit of sourcing overseas was realized. However, lower margins elsewhere in the segment temperedthe increase. In particular, AFG recorded write-downs on certain inventory which reduced segment margins by approximately150 basis points in the quarter. S, G & A costs were $33.2 million in the quarter, an increase from $27.8 million the year before.The majority is attributable to increased promotional activity, but the higher costs are reflective of an increased infrastructure inanticipation of supporting further growth of the segment. Research and development costs and amortization also increased overlast year for the same reason. As a result, earnings from operations for the quarter improved to $10.6 million from $9.0 millionin 2009.The fourth quarter in the Home Furnishings segment was severely affected by a slowdown at retail in furniture at the majority of itscustomers. Replenishment orders were reduced and inventories at the retail level were cut by the segment’s mass market customers.As a result, revenues declined by 19.6% from the prior year. This decline was most pronounced on the segment’s domestic RTAfurniture and metal folding furniture items. Margins were also affected as fixed overhead absorption was reduced and freight costswere considerably higher than in the prior year. As a result, <strong>2010</strong> gross margins were reduced to 12.2%. Note that the prior year’squarter gross margins included a gain of $6.4 million on the successful settlement of a claim against a law firm related to the UnitedStates Department of Commerce (“DOC”) of prior years’ anti-dumping duties. The impact of this on 2009 gross margins was anincrease of 530 basis points. Excluding this gain, gross margins would have been 14.5%.S, G & A costs for the quarter decreased to $5.4 million, as compared to $10.9 million in 2009, for two principal reasons. Productliability costs were lower by $2.8 million and the 2009 figures included higher legal costs of $1.4 million in connection with the$6.4 million anti-dumping duty legal settlement that was reached, referred to previously. Other expenses were consistent yearover-year,meaning earnings from operations declined to $5.6 million versus $12.1 million in 2009. Note that of the decline of$6.5 million, $5.0 million can be attributed to the net gain recorded in 2009 on the legal settlement.<strong>Annual</strong> <strong>Report</strong> <strong>2010</strong> 11
Segment ResultsSeasonalityThough revenues at the operating segments within <strong>Dorel</strong> may vary in their seasonality, for the Company as a whole, variationsbetween quarters are not significant as illustrated below.Revenues by Quarter by SegmentHome FurnishingsJuvenileRecreational/Leisure600,000500,000Total Revenues400,000300,000200,000100,0000QTR 1 QTR 2 QTR 3 QTR 4 QTR 1 QTR 2 QTR 3 QTR 4 QTR 1 QTR 2 QTR 3 QTR 42008 2008 2008 2008 2009 2009 2009 2009 <strong>2010</strong> <strong>2010</strong> <strong>2010</strong> <strong>2010</strong>QuarterJuvenile<strong>2010</strong> 2009 Change$ % of sales $ % of sales $ %Revenues 1,030,209 100.0 995,014 100.0 35,195 3.5Gross profit 280,050 27.2 274,497 27.6 5,553 2.0Selling, general andadministrative expenses 153,586 14.9 149,239 15.0 4,347 2.9Depreciation and amortization 23,567 2.3 20,776 2.1 2,791 13.4Research and development 7,829 0.8 11,948 1.2 (4,119) (34.5)Earnings from operations 95,068 9.2 92,534 9.3 2,534 2.7Revenues in <strong>2010</strong> increased from 2009 levels by $35.2 million or 3.5%. For the segment as a whole, the organic revenue increasewas above 4%, if the impact of foreign exchange is excluded. The revenue growth was in all markets except for the U.S. whichencountered a difficult retail environment, especially in the last half of the year. Europe rebounded in <strong>2010</strong> and recorded salesgains of almost 9% in local currency. In U.S. dollars this improvement equated to approximately 4%. The strength in Europe wasin most markets with the notable exception of Spain. Car seats remain Europe’s core product and were the principal driver of theincrease. In Canada, sales in U.S. dollars were helped by the stronger Canadian dollar, however over and above this, sales did groworganically. In Australia, sales dollars were helped by the stronger U.S. dollar, but in local currency sales were down as the retailmarket there was challenging. In Brazil, <strong>2010</strong> was the first year of full operations and sales benefited from new car seat legislationthat was enforced locally. As a result, sales in Brazil were approximately $27 million.12<strong>Dorel</strong> <strong>Industries</strong> Inc.
Gross margins declined by 40 basis points from 2009 levels. However as described above, the prior year margins were negativelyimpacted by out of period foreign exchange losses totalling $12.6 million. Excluding these losses, gross margins in 2009 wouldhave been 28.9% and the decline year-over-year is 170 basis points. The main reasons are costs for certain raw materials, principallyresin, and container freight rates that increased over the prior year. Also, excluding the out of period foreign exchange losses in2009, <strong>Dorel</strong> Europe experienced less favourable rates of exchange versus the Euro in the current year, though this situation easedin the second half of the year.As a result of recalls in the crib industry and new legislation banning drop-side cribs, <strong>Dorel</strong> has elected to cease the importationof cribs until the impact of these new regulations has been fully assessed. Though less than 2% of segment sales over the pasttwo years, the negative impact of the crib business on earnings in <strong>2010</strong> was approximately $5 million.S, G & A costs for the segment as a whole increased by $4.3 million, or 2.9%, from last year. As a percentage of revenues these costswere down slightly at 14.9% versus 15.0% in the prior year. Product liability costs in the U.S. for the Juvenile segment in <strong>2010</strong>declined for the fourth consecutive year and were $7.6 million versus $10.4 million in 2009. More than offsetting this decreasewere costs at <strong>Dorel</strong> Brazil and greater promotional spending at <strong>Dorel</strong> Europe. Depreciation and amortization was higher in <strong>2010</strong>due to an increased level of capitalization. Offsetting this increase were reductions in research and development expense as 2009included a large one time write off, as described in the fourth quarter analysis above. Therefore earnings in <strong>2010</strong> were $95.1 millionin <strong>2010</strong> versus $92.5 million in the prior year.Recreational / Leisure<strong>2010</strong> 2009 Change$ % of sales $ % of sales $ %Revenues 774,987 100.0 681,366 100.0 93,621 13.7Gross profit 183,553 23.7 153,739 22.6 29,814 19.4Selling, general andadministrative expenses 121,411 15.7 106,209 15.6 15,202 14.3Depreciation and amortization 6,625 0.9 5,009 0.7 1,616 32.3Research and development 3,192 0.4 2,684 0.4 508 18.9Earnings from operations 52,325 6.8 39,837 5.8 12,488 31.3Recreational / Leisure revenues increased 13.7% to $775.0 million in <strong>2010</strong> compared to $681.4 million a year ago. This increasewas due to sales growth at all divisions, with the exception of the Apparel Footwear Group (AFG) that posted flat sales. Theimprovement was for several reasons. In North America a major advertising campaign supporting the Schwinn brand was asuccess with both retailers and consumers, and sales of the Schwinn brand, particular at mass merchants, were up strongly. Sales tolarge customers in Canada were up over 25% over the prior year and since 2008 have more than doubled. Sales by CSG to IBDcustomers in both the U.S. and Europe improved with new models proving to be well received. The acquisition of CSG UK inthe fourth quarter of 2009 also added to revenues and the U.K. operations had a strong year. After removing the acquired saleswith the CSG UK addition, as well as a small business acquisition in Australia in late 2009, and adjusting for the effects of foreignexchange, organic sales growth was approximately 11%.Gross margins for the segment as a whole improved to 23.7% from 22.6%. Most of the improvement was at CSG with the moveof production to overseas improving profitability. Note that one-time costs included in cost of sales related to this previouslyannounced initiative to source overseas totaled approximately $1.4 million. Pacific Cycle margins were also up slightly, but AFGexperienced declines which tempered the improvement for the segment as a whole.<strong>Annual</strong> <strong>Report</strong> <strong>2010</strong> 13
S, G & A costs increased over last year by $15.2 million or 14.3%. The reasons for the increase were increased discretionaryspending for promotion and other advertising as well as incremental costs associated with new business acquisitions in late 2009.The advertising spent for Schwinn brand support alone exceeded $5 million for the year. The investments made throughout 2009and <strong>2010</strong> in the segment’s infrastructure, as evidenced by increases in administrative costs, accounted for the balance of the increasein S, G & A. Note that as a percentage of revenues the increase was only 10 basis points over 2009. Depreciation and amortizationas well as research and development costs rose by a combined $2.1 million in the year, a result of more spending on new productdevelopment, amortization at newly acquired CSG UK and some additional capitalization at CSG USA. Therefore earnings fromoperations rose from $39.8 million in 2009 to $52.3 million in <strong>2010</strong>, an improvement of $12.5 million or 31.3%.Home Furnishings<strong>2010</strong> 2009 Change$ % of sales $ % of sales $ %Revenues 507,790 100.0 463,734 100.0 44,056 9.5Gross profit 69,179 13.6 77,308 16.7 (8,129) (10.5)Selling, general andadministrative expenses 30,873 6.1 36,618 7.9 (5,745) (15.7)Depreciation and amortization 1,018 0.2 1,442 0.3 (424) (29.4)Research and development 2,605 0.5 2,552 0.6 53 2.1Earnings from operations 34,683 6.8 36,696 7.9 (2,013) (5.5)For the year, Home Furnishings revenues increased by 9.5%, reaching $507.8 million up from $463.7 million in the prior year.The majority of the divisions increased their sales as the segment continued to benefit from consumer tastes which focused moreon value priced furniture during difficult economic periods. Sales growth was much higher as of the second half, but beginningsomewhat in the third quarter and more so in the fourth, many large customers cut back on orders as retail sales slowed and theirin-store inventories rose.Gross margins in <strong>2010</strong> were 13.6% versus 16.7% recorded in the prior year. The gain of $6.4 million that was recorded in 2009related to prior years’ anti-dumping duties referred to above had an impact on 2009 gross margins of 140 basis points. Excludingthis gain, gross margins would have been 15.3%. Therefore the true decline year over year is 170 basis points. This decline was dueto higher container freight costs, a less profitable sales mix and, because two of the plants are located in Canada and ship to mainlyUS based customers, the stronger Canadian dollar.S, G & A costs decreased by $5.7 million to $30.9 million in <strong>2010</strong>, from $36.6 million the year before. As a percentage of revenuesthese costs decreased from 7.9% to 6.1%. The principal reasons for the decrease were lower costs at Cosco Home & Office whereproduct liability costs decreased by $3.6 million and legal costs declined by $1.4 million as described previously. Research anddevelopment costs and depreciation and amortization were consistent year-over-year. As such, earnings from operations for theyear were $34.7 million compared to $36.7 million in 2009.14<strong>Dorel</strong> <strong>Industries</strong> Inc.
Balance SheetSelected Balance Sheet Data as at December 30:<strong>2010</strong> 2009 2008$ $ $Total assets 2,095,960 2,002,180 2,030,473Long-term Financial Liabilities, excluding current portion:Long-term debt 319,281 227,075 450,704Other long-term liabilities 35,999 25,139 6,010Other:Current portion of long-term debt and bank indebtedness 41,182 124,495 13,277Versus the December 30, 2009 year-end balance sheet, the majority of the total asset increase was due to higher inventory levels.There are several reasons for the increase. While the impact of order reductions in the U.S. was significant at approximately$30 million, several other components account for the total increase. Firstly, last year’s inventory levels were too low to adequatelyservice the Company’s customers, and as such, approximately 35% to 40% of the increase was intentional to align inventorieswith business needs. The bulk of the remaining increase was due to inventory for 2011 sales being brought in earlier than in theprior year. Finally, cost increases year-over-year added approximately 2% to 3% to total inventory value. These reasons explain theincrease in the number of days in inventory as presented below, along with certain other of the Company’s working capital ratios:As at December 30,<strong>2010</strong> 2009Debt to equity 0.31 0.32# of Days in receivables 56 59# of Days in inventory 106 91The lower number of days in receivables is due to the sales reduction near the end of the year in the U.S. in <strong>2010</strong>. Other than theitems described above, there were no significant variations year-over-year in the Company’s balance sheet.<strong>Annual</strong> <strong>Report</strong> <strong>2010</strong> 15
Liquidity and Capital ResourcesCash FlowFree cash flow, a non-GAAP financial measure, was negative $13.1 million in <strong>2010</strong> versus $136.8 million in 2009, detailed as follows:Free cash flow<strong>2010</strong> 2009 2008$ $ $Cash flow from operations before changes in non-cash working capital: 180,330 156,857 158,390Change in:Accounts receivable (12,789) (27,312) 28,223Inventories (111,821) 113,630 (121,027)Accounts payable and other liabilities 34,193 (39,437) 22,105Other (11,895) 778 (7,808)Cash provided by operating activities 78,018 204,516 79,883Less:Dividends paid (18,895) (16,614) (16,707)Share repurchase (17,277) (10,504) —Additions to property, plant & equipment – net (35,465) (21,893) (26,518)Intangible assets (19,511) (18,753) (20,929)FREE CASHFLOW (1) (13,130) 136,752 15,729(1)“Free cash flow” is a non-GAAP financial measure and is defined as cash provided by operating activities less dividends paid, shares repurchased, additions to property,plant & equipment and intangible assets.During <strong>2010</strong>, cash flow from operations, before changes in working capital, increased by $23.5 million due to higher earnings.After changes in non-cash working capital items, cash flow provided by operating activities was $78.0 million, a decrease of$126.5 million from the previous year. As described above, the main reason was due to the increase in inventory levels, partiallyoffset by an increase in accounts payable.The past three years have seen wide swings in free cash flow, principally due to major variations in inventory levels from year toyear. Low inventory levels at the beginning of <strong>2010</strong> adversely impacted cash as the Company re-established more normal operatinglevels. This was exacerbated by the situation described previously as retailers drastically reduced fourth quarter ordering, causing<strong>2010</strong> year end inventories to increase, and thereby reducing free cash flow. The situation in <strong>2010</strong> was similar to that experiencedin 2008 which due to a very slow fourth quarter brought on by the economic crisis caused that year’s ending inventories to rise,thereby also reducing cash flow in that year.Capital expenditures on property, plant and equipment and intangible assets totalled $55.0 million in <strong>2010</strong>, compared to$40.6 million in 2009. The increase in capital additions was in several areas. In Juvenile, <strong>Dorel</strong> Europe increased its new productdevelopment spending by investing in several new moulds for product introduced in <strong>2010</strong> and into 2011. Additionally, Europeinvested in its supply chain activities with improvements to warehousing facilities made in the UK, the Netherlands and Portugal.The total increased spend in Europe was over 7 million Euros. Also in Juvenile, DJG opened its <strong>Dorel</strong> Technical Center for ChildSafety at its manufacturing campus in Columbus, Indiana. The multi-million dollar facility will centralize all North AmericanR&D and product development activities and will foster cutting-edge innovation in the design of car seats and other juvenileproducts. Total capitalized costs incurred in <strong>2010</strong> on this project were $3.4 million.16<strong>Dorel</strong> <strong>Industries</strong> Inc.
In Recreational / Leisure a new facility in the Metro-Vancouver area in British Columbia for the Apparel Footwear Group Division(AFG) was opened. At a cost of $2.5 million, the newly renovated 70,000-square-foot complex for manufacturing and distributionalso serves as the Global Headquarters for design and marketing for AFG.During the year, the Company secured new long-term financing by issuing $50 million of Series “A” Senior Guaranteed Notesand $150 million of Series “B” Senior Guaranteed Notes. The principal repayment of the Series “A” Senior Guaranteed Notes isdue in April 2015, whereas the principal repayments of the Series “B” Senior Guaranteed Notes begin in April 2013 with the finalpayment due in April 2020. In addition, an extension of a revolving credit facility was completed. This three-year agreement expiresJuly 1, 2013 and allows for borrowing up to $300 million and contains provisions to borrow up to an additional $200 million. As ofDecember 30, <strong>2010</strong>, <strong>Dorel</strong> was compliant with all covenant requirements and expects to be so going forward.Contractual ObligationsThe following is a table of a summary of the contractual obligations of the Company as of December 30, <strong>2010</strong>:less than 1 - 3 4 - 5 AfterContractual Obligations Total 1 year years years 5 years$ $ $ $ $Long-term debt repayments 329,948 10,667 132,778 70,434 116,069Interest payments (1) 61,489 15,400 25,891 6,647 13,551Net operating lease commitments 126,948 32,430 45,426 22,039 27,053Contingent considerations 28,002 — 28,002 — —Capital addition purchase commitments 5,872 5,872 — — —Minimum payments under licensing agreements 7,552 5,596 1,956 — —Total contractual obligations 559,811 69,965 234,053 99,120 156,673(1)Interest payments on the Company’s revolving bank loans are calculated using the interest rate in effect as at December 30, <strong>2010</strong> andassume no debt reduction until due date in July 2013, at which point it is assumed the loan would be paid in full. Interest payments on the Company’s notes are asspecified in the related note agreements.The Company does not have significant contractual commitments beyond those reflected in the consolidated balance sheet, thecommitments in Note 20 to the Consolidated Financial Statements or those listed in the table above.For purposes of this table, contractual obligations for the purchases of goods or services are defined as agreements thatare enforceable and legally binding on the Company and that specify all significant terms, including: fixed or variable priceprovisions; and the approximate timing of the transaction. With the exception of those listed above, the Company does not havesignificant agreements for the purchase of raw materials or finished goods specifying minimum quantities or set prices that exceedits short term expected requirements. Therefore, not included in the above table are <strong>Dorel</strong>’s outstanding purchase orders for rawmaterials, finished goods or other goods and services which are based on current needs and are fulfilled by its vendors on relativelyshort timetables.As new product development is vital to the continued success of <strong>Dorel</strong>, the Company must make capital investments in researchand development, moulds and other machinery, equipment and technology. It is expected that the Company will invest atleast $35.0 million over the course of 2011 to meet its new product development and other growth objectives. The Companyexpects its existing operations to be able to generate sufficient cash flow to provide for this and other requirements as they arisethroughout the year.<strong>Annual</strong> <strong>Report</strong> <strong>2010</strong> 17
Over and above long-term debt in the contractual obligation table, included in the Company’s long-term liabilities are thefollowing amounts:Pension and post-retirement benefit obligations: As detailed in Note 16 of the Consolidated Financial Statements, thisamount of $21.5 million pertains to the Company’s pension and post-retirement benefit plans. In 2011, contributionsexpected to be made for funded plans and benefits expected to be paid for unfunded plans under these plans will amountto approximately $1.6 million.Other long-term liabilities consist of:$Contingent considerations 28,002Government mandated employee savings plans in Europe,the majority of which are due after five years 4,304Other liabilities due in more than one year 3,69335,999The contingent considerations pertain to certain of the Company’s recent business acquisitions. In the case of the Company’s Australianand Brazilian subsidiaries where the Company holds less than 100% of the shares, the Company has entered into agreements with theminority interest holders for the purchase of the balance of the shares at some future point. Under the terms of these agreements, thepurchase price of these shares is based on specified earnings objectives at the end of specific time periods. The acquisition agreementfor Hot Wheels and Circle Bikes acquired in 2009 includes additional considerations contingent upon a formulaic variable price basedmainly on future earnings results of the acquired business up to the year ended December 30, 2012. As at December 30, <strong>2010</strong> thetotal estimated liability is $28.0 million and this amount will be paid no later than 2013.Off-Balance Sheet ArrangementsIn addition to the contractual obligations listed above, the Company has certain off-balance sheet arrangements and commitmentsthat have financial implications, specifically contingent liabilities, guarantees, and commercial and standby letters of credit. TheCompany’s off-balance sheet arrangements are described in Notes 20 and 21 to the Consolidated Financial Statements for the yearended December 30, <strong>2010</strong>.Requests for providing commitments to extend credit and financial guarantees are reviewed and approved by senior management.Management regularly reviews all outstanding commitments, letters of credit and financial guarantees and the result of thesereviews are considered in assessing the adequacy of <strong>Dorel</strong>’s reserve for possible credit and guarantee losses.Derivative Financial InstrumentsThe Company is exposed to interest rate fluctuations, related primarily to its revolving long-term bank loans, for which amountsdrawn are subject to LIBOR, EURIBOR or U.S. base rates in effect at the time of borrowing, plus a margin. The Companymanages its interest rate exposure and enters into swap agreements consisting in exchanging variable rates for fixed rates for anextended period of time. All other long-term debts have fixed interest rates and are therefore not exposed to cash flow interest rate risk.In 2009, the Company began to use interest rate swap agreements to lock-in a portion of its debt cost and reduce its exposure to thevariability of interest rates by exchanging variable rate payments for fixed rate payments. The Company has designated its interestrate swaps as cash flow hedges for which it uses hedge accounting.As a result of its global operating activities, <strong>Dorel</strong> is subject to various market risks relating primarily to foreign currency exchangerate risk. In order to reduce or eliminate the associated risks, the Company uses various derivative financial instruments suchas options, futures and forward contracts to hedge against adverse fluctuations in currency. The Company’s main source offoreign currency exchange rate risk resides in sales and purchases of goods denominated in currencies other than the functionalcurrency of each of <strong>Dorel</strong>’s subsidiaries. The Company’s financial debt is mainly denominated in US dollars, for which no foreigncurrency hedging is required. Short-term credit lines and overdrafts commonly used by <strong>Dorel</strong>’s subsidiaries are in the currencyof the borrowing entity and therefore carry no exchange-rate risk. Inter-company loans/borrowings are economically hedged asappropriate, whenever they present a net exposure to exchange-rate risk.18<strong>Dorel</strong> <strong>Industries</strong> Inc.
As such, derivative financial instruments are used as a method for meeting the risk reduction objectives of the Company bygenerating offsetting cash flows related to the underlying position in respect of amount and timing of forecasted transactions.<strong>Dorel</strong> does not hold or use derivative financial instruments for trading or speculative purposes.Prior to November 1, 2009 the Company did not apply hedge accounting to foreign exchange contracts. For new foreign exchangecontracts taken after that date, the Company has designated the majority of the new foreign exchange contracts as cash flow hedgesfor which it uses hedge accounting. For the foreign exchange contracts taken prior to November 1, 2009, for which the Companyelected not to apply hedge accounting; these foreign exchange contracts, were classified as held for trading, and were marked tomarket and the associated unrealized and realized gains and losses were recorded in cost of sales.The fair values, average rates and notional amounts of derivatives and the fair values and carrying amounts of financial instrumentsare disclosed in Note 14 of the Consolidated Financial Statements.Critical Accounting EstimatesThe Consolidated Financial Statements have been prepared in accordance with Canadian GAAP. The preparation of these financialstatements requires estimates and judgments that affect the reported amounts of assets, liabilities, revenues and expenses, andrelated disclosure of contingent assets and liabilities. A complete list of all relevant accounting policies is listed in Note 3 to theConsolidated Financial Statements.The Company believes the following are the most critical accounting policies that affect <strong>Dorel</strong>’s results as presented herein and thatwould have the most material effect on the financial statements should these policies change or be applied in a different manner:• Goodwill and certain other indefinite life intangible assets: Goodwill and certain other intangible assets, such astrademarks, have indefinite useful lives and as such, are not amortized to income. Instead, the Company must determineat least once annually whether the fair values of these assets are less than their carrying value, thus indicating impairment.The Company uses the future net discounted cash flows valuation method and makes assumptions and estimates in anumber of areas, including future earnings and cash flows, the cost of capital and discount rates.• Product liability: The Company insures itself to mitigate its product liability exposure. The estimated productliability exposure is calculated by an independent actuarial firm based on historical sales volumes, past claims historyand management and actuarial assumptions. The estimated exposure includes incidents that have occurred, as well asincidents anticipated to occur on units sold prior to December 30, <strong>2010</strong>. Significant assumptions used in the actuarialmodel include management’s estimates for pending claims, product life cycle, discount rates, and the frequency andseverity of product incidents.• Pension plans and post retirement benefits: The costs of pension and other post-retirement benefits are calculatedbased on assumptions determined by management, with the assistance of independent actuarial firms and consultants.These assumptions include the long-term rate of return on pension assets, discount rates for pension and otherpost-retirement benefit obligations, expected service period, salary increases, retirement ages of employees and healthcare cost trend rates.• Income taxes: The Company follows the asset and liability method of accounting for income taxes. Under this method,future income taxes relate to the expected future tax consequences of differences between the carrying amount of balancesheet items and their corresponding tax values using the substantively enacted income tax rate, which will be in effectfor the year in which the differences are expected to reverse. A valuation allowance is recorded to reduce the carryingamount of future income tax assets to the extent that, in the opinion of management, it is more likely than not thatthe future income tax assets will not be realized. The ultimate realization of future tax assets is dependent upon thegeneration of future taxable income and tax planning strategies. Future income tax assets and liabilities are adjusted forthe effects of changes in tax laws and rates on the date of substantive enactment.<strong>Annual</strong> <strong>Report</strong> <strong>2010</strong> 19
The Company’s income tax provision is based on tax rules and regulations that are subject to interpretation and requireestimates and assumptions that may be challenged by taxation authorities. The Company’s estimates of income taxassets and liabilities are periodically reviewed and adjusted as circumstances warrant, such as changes to tax laws andadministrative guidance, and the resolution of uncertainties through either the conclusion of tax audits or expiration ofprescribed time limits within the relevant statutes. The final results of government tax audits and other events may varymaterially compared to estimates and assumptions used by management in determining the provision for income taxesand in valuing income tax assets and liabilities.• Product warranties: A provision for warranty cost is recorded in cost of sales when the revenue for the related productis recognized. The cost is estimated based on a number of factors, including the historical warranty claims and costexperience, the type and duration of warranty, the nature of product sold and in service, counter-warranty coverageavailable from the Company’s suppliers and product recalls. The Company reviews its recorded product warrantyprovisions and any adjustment is recorded in cost of sales.• Allowances for sales returns and other customer programs: At the time revenue is recognized certain provisions mayalso be recorded, including returns and allowances, which are based on agreements with applicable customers, historicalexperience with a particular customer and/or product, and other relevant factors. Historical sales returns, allowances,write-offs, changes in internal credit policies and customer concentrations are used when evaluating the adequacy ofthe allowance for sales returns. In addition, the Company records estimated reductions to revenue for customerprograms and incentive offerings, including special pricing agreements, promotions, advertising allowances and othervolume-based incentives. Historical sales data, agreements, customer vendor agreements, changes in internal creditpolicies and customer concentrations are analyzed when evaluating the adequacy of the allowances.Future Accounting ChangesInternational Financial <strong>Report</strong>ing StandardsIntroductionOn February 13, 2008, the Accounting Standards Board of Canada confirmed the date of the changeover from Canadian GAAPto International Financial <strong>Report</strong>ing Standards. Canadian publicly accountable enterprises must adapt IFRS to their interim andannual financial statements relating to fiscal years beginning on or after January 1, 2011, with early adoption allowed. The Companyhas chosen for an early adoption of IFRS and is issuing its last financial statements prepared in accordance with Canadian GAAP infiscal <strong>2010</strong>. Effective the first day of fiscal year 2011, the Company’s financial statements will be prepared in accordance with IFRS,with comparative figures and an opening balance sheet restated to conform to IFRS, along with a reconciliation from Canadian GAAPto IFRS, as per guidance provided in IFRS 1, First-Time Adoption of International <strong>Report</strong>ing Standards.Overall SummaryThe Company has identified and calculated the impact of the differences between IFRS and Canadian GAAP on its openingbalance sheet. Further information has been outlined in the detailed report below. There is no expected material impact on theCompany’s <strong>2010</strong> financial reporting results based on the information collected to date.Detailed <strong>Report</strong>There have been no significant changes to the Company’s IFRS changeover plan and the project is progressing according to plan.There have been no significant modifications in key differences in accounting treatments and potential key impacts as assessed inthe Company’s 2009 annual report.Below is an update of the Company’s progress on the IFRS changeover plan. The following table outlines the key phases and theupdated milestones and an assessment of progress towards achieving them.20<strong>Dorel</strong> <strong>Industries</strong> Inc.
Phase 3: Solution Design and DevelopmentActionsSolution DevelopmentSelect accounting policies and prepare accounting policies and procedures manuals / identify businessprocess and system impacts / identify solutions to IFRS impacts / finalize conversion plans, includinginternal controls over financial reporting and disclosure controls and procedures.Timetable Solution Development: <strong>2010</strong>ProgressSolution Development: Completed• Developed tools to prepare IFRS opening balance sheet and comparative information:the Company created a duplicate IFRS environment in its information systems to trackall adjusting IFRS entries for the opening Balance Sheet and throughout the dualreporting period.• Developed any required changes to information systems: the Company did not encounterany significant impact on its information systems.• Developed internal controls over financial reporting: the Company assessed the internal controlsapplicable to its financial reporting processes under IFRS including any relevant changes to thecurrent Canadian GAAP reporting environment.• Developed disclosure controls and procedures: disclosure controls and procedures were updated; theCompany updated its reporting package tools to include all data required for financial statementsdisclosures under IFRS.• Identified business impact of conversion, including the effect on financial covenants, contracts, hedgingactivities, budgeting processes and compensation arrangements:(i) Company’s bank arrangements have been negotiated to allow for the transition from CanadianGAAP to IFRS without significant impact; (ii) other contracts have been reviewed and based on theCompany’s analysis, there is no material impact on the Company’s financial statements as a resultof conversion to IFRS; (iii) Canadian GAAP process to test hedge effectiveness is compliant withIFRS; (iv) budgets and strategic plans were prepared under IFRS for fiscal year 2011; and (v) variableincentive compensation has been amended in reference to IFRS financial targets for relevant periods;no significant impact is expected.• Prepared a model of the IFRS financial statements: a complete IFRS financial statements model wasprepared, and has been reviewed by Finance senior management.Phase 4: ImplementationActionsApprove selected accounting policies and finalize manuals.Roll out accounting policies.Test and remediate, including dry run in a “test environment”.Roll out process and system changes and perform education.Perform reporting under IFRS.<strong>Annual</strong> <strong>Report</strong> <strong>2010</strong> 21
Timetable 2012ProgressIn progress and will continue until the first complete annual financial reporting under IFRS isreleased in 2012.The data collection for the IFRS opening balance sheet is complete and the data collection for eachquarter in fiscal year <strong>2010</strong> is virtually complete. There is no expected material impact on the Company’s<strong>2010</strong> financial reporting results based on the information collected to date. New accounting policies havebeen approved, as applicable. Post-testing and remediation, if any, process and system changes have beenrolled out and divisions educated of any changes.Phase 5: Post -ImplementationActionsTransition to a sustainable operational modelConversion plan assessmentTimetable June 30, 2012ProgressNot yet commencedThe Company has analyzed the IFRS standards and has made choices, as warranted, with regard to these standards and notedthe differences between certain of these standards and current accounting policies. The most significant ones are set out in thefollowing table:StandardsIAS 1:Presentation ofFinancialStatementsComparison between IFRS andCompany current accounting policiesThe main relevant differences between IFRS and Canadian GAAPare the following:a) IFRS allows that expenses recognized in profit or loss shouldbe analyzed either by nature or by function. If an entitycategorizes by function, then additional information on thenature of expenses – at a minimum depreciation, amortizationand employee benefits expense – must be disclosed.b) Under IFRS, in the Statement of Cash Flows, the Companyhas a choice on the presentation of operating cash flows. Thedirect method of presentation is encouraged but the indirectmethod is acceptable.FindingsFindings by Difference:The Company has chosen topresent the expenses in thefinancial statements by function.The Company has chosen topresent the operating cash flowsin the Statement of Cash Flowsusing the indirect method.22<strong>Dorel</strong> <strong>Industries</strong> Inc.
StandardsIAS 12:Income TaxesComparison between IFRS andCompany current accounting policieThe main relevant differences between IFRS and Canadian GAAPare the following:a) Unlike IFRS, under Canadian GAAP a future income taxasset or liability is not recognized for a temporary differencearising from the difference between the historical exchangerate and the current exchange rate translations of thecost of non-monetary assets and liabilities of integratedforeign operations.FindingsFindings by Difference:The Company has calculated anopening balance sheet adjustmentas at December 31, 2009 todecrease future income tax liabilitiesand increase retained earnings byapproximately $2.5 million.IAS 16:Property, Plantand Equipmentb) Under IFRS, potential tax exposures are analyzed individuallyand separately from the calculation of income tax, and theamount of tax provided for is the best estimate of the taxamount expected to be paid. Under Canadian GAAP, thegeneral recognition standard is “probable” or “more likely thannot”. Tax liabilities are measured using amounts “expected tobe paid to” tax authorities, using a single best estimate.c) Under IFRS, the difference between the tax base of the employeeservices received for stock-based compensation and its carryingamount (of $ nil) is a deductible temporary differences thatresults in a future income tax assets. Under Canadian GAAP,future income tax assets recognized in relation to stock-basedcompensation are not explicitly addressed.d) Under IFRS, the tax treatment of temporary differences onintercompany transfers is recognized as a deferred tax expenseor recovery and is calculated using the buyer’s rate. UnderCanadian GAAP, the tax impact is recognized as a current taxexpense or recovery and is calculated using the seller’s rate.The main relevant differences between IFRS and CanadianGAAP are:a) The possibility to evaluate assets at fair value at each balancesheet date.b) Componentization: parts of an asset with different useful liveshave to be amortized separately. This requirement exists underCanadian GAAP but it is further emphasized by IFRS.Based on the information collectedto date, this GAAP difference relatedto IFRS will not have an impact onthe company’s financial statements.The Company has calculated anopening balance sheet adjustmentas at December 31, 2009 todecrease future income tax assetsand decrease retained earnings byapproximately $1.0 million.The Company has calculated anopening balance sheet adjustmentas at December 31, 2009 toincrease future income tax assets by$1.7 million, increase income taxpayable by $0.3 million and to increaseretained earnings by approximately$1.4 million.Findings by Difference:Based on the information collected,none of these GAAP differencesrelated to fair value will have amaterial impact on the Company’sfinancial statements.The Company has not elected toevaluate assets at fair value at eachbalance sheet date. The Companydetermined that fixed assets do nothave to be materially componentizedfurther.<strong>Annual</strong> <strong>Report</strong> <strong>2010</strong> 23
StandardsIAS 17:LeasesComparison between IFRS andCompany current accounting policieThe main relevant difference between IFRS and Canadian GAAP isthe following:The distinction between an operating lease (where only the rent isrecognized in the P&L) and a capital lease (where the item leased isrecorded as an asset in the Balance Sheet) is based on different criteria.IFRS makes the capital versus operating lease distinction much morebased on the substance of the lease contract rather than its form.Canadian GAAP makes the distinction much more based on its form.FindingsFindings by Difference:A thorough analysis of all materialCompany leases was performedusing the classification criteria underIFRS and Canadian GAAP. Noneof the GAAP differences related toleases will have a material impact onthe Company’s financial statementsbased on the information collectedto date.IAS 19:EmployeeBenefitsThe main relevant differences between IFRS and Canadian GAAPare the following:a) Accounting options of defined benefit plans for actuarial gainsand lossesThe options are the following under IFRS:- Present actuarial gains and losses directly in the P&L- Use the “corridor” approach- Present actuarial gains and losses directly in the Balance Sheetwith changes recorded in Other Comprehensive IncomeFindings by Difference:The Company accounts for definedbenefit plans using the “corridorapproach” under Canadian GAAP.Upon transition to IFRS, theCompany will present actuarial gainsand losses directly in the BalanceSheet with changes recorded in OtherComprehensive Income.The options are the following under Canadian GAAP:- Present actuarial gains and losses directly in the P&L- Use the “corridor” approachThe Company has calculated anopening balance sheet adjustment as atDecember 31, 2009 to increase pension& post-retirement benefit obligationsby $2.2 million and decrease retainedearnings by approximately $1.3 millionafter tax.b) Vested past service costsUnder IFRS, liabilities and expenses for vested past servicecosts under a defined benefit plan are recognized immediately.Under Canadian GAAP, they are recognized over the expectedaverage remaining service period.c) Unvested past service costsUnvested past service costs are amortized faster under IFRS.All of the Company’s unrecognizedpast service costs are vested, thusthey will be fully recognized in theIFRS opening balance sheet as atDecember 31, 2009 as describedin the preceding paragraph. Thisdifference applies to the Companyon a prospective basis.24<strong>Dorel</strong> <strong>Industries</strong> Inc.
StandardsIAS 21:The Effect ofChanges inForeign ExchangeRatesIAS 33:EarningsPer Share (“EPS”Comparison between IFRS andCompany current accounting policiesThe main relevant differences between IFRS and Canadian GAAPare the following:a) The main difference relates to the exchange rate used to translatenon monetary assets carried at fair value. Under IFRS, theexchange rate used is as at the date when the fair value wasdetermined instead of the exchange rate as at the Statement ofFinancial Position date.b) Under IFRS, the functional currency is the currency of theprimary economic environment in which the entity operates.Under Canadian GAAP, an entity is not explicitly requiredto assess the unit of measure (functional currency) in whichit measures its own assets, liabilities, revenues and expenses,but rather only assesses the functional currency of its foreignoperations.c) Under IFRS, the reimbursement of an intercompany loanconsidered as a permanent investment (between companieswith different functional currencies) does not necessarily triggerthe recycling of a portion of the CTA in the P&L.d) Under Canadian GAAP reductions in the net permanentinvestment trigger the recycling of CTA in income. TheCompany currently uses the net change method to determinewhether there has been a reduction in permanent investmentthrough either paid up capital reduction, dividends and/orpermanent intercompany loan repayment.The main differences between IFRS and Canadian GAAP arethe following:a) Unlike Canadian GAAP, IFRS does not allow rebuttal of thepresumption of share settlement treatment on contracts thatmay be settled in shares or cash based on past experience ofcontracts settlements.FindingsThere is no material impact on theCompany’s financial statementsfor these differences based on theinformation collected to date.The Company has retroactivelyanalyzed all instances where ithas recognized CTA in the P&Ldue to an intercompany loanreimbursement without loss of controlof its subsidiaries. The Company hascalculated an opening balance sheetadjustment as at December 31, 2009to increase accumulated othercomprehensive income and decreaseretained earnings by approximately$2.4 million.Findings by difference:There is no material impact on theCompany’s financial statementsfor this difference based on theinformation collected to date.b) Under IFRS, for diluted EPS, dilutive potential ordinary sharesare determined independently for each period presented. UnderCanadian GAAP, the computation of diluted EPS for year-todateperiods is based on the weighted average of the number ofincremental shares included in each interim period making upthe year-to-date period.The diluted earnings per share isexpected to be different for theCompany however the impact isnot expected to be material basedon the information collected todate and there is no impact on theopening balance sheet.<strong>Annual</strong> <strong>Report</strong> <strong>2010</strong> 25
StandardsIAS 36:Impairment ofAssetsComparison between IFRS andCompany current accounting policiesThe main relevant differences between IFRS and Canadian GAAPare the following:a) Process of the impairment testUnder Canadian GAAP, the impairment test for long lived assetsis a two step process:- The carrying amount of the asset is compared to the sum ofits undiscounted cash flow expected to result from its use andeventual disposition;- If the carrying amount of the asset is greater than theundiscounted cash flow, then it is compared to the fair value ofthe asset. An impairment may have to be recognized.Under IFRS, it is a one step process; the carrying amount of theasset is directly compared to the recoverable amount of the asset.b) Assigning assets to cash generating unitsUnder IFRS, impairment testing of assets is done at the independentcash generating unit (“CGU”) level.Under Canadian GAAP, the CGU is defined as it generates bothindependent cash inflows and outflows as compared to IFRS thatdefines a CGU as it only generates cash outflowsFindingsFindings by Difference:This difference has been analyzedfor the Company’s impairment testsand is found to have no materialimpact at the transition date on thefinancial statements based on theinformation collected to date.The Company has identified itscash generating units. Impairmenttesting for goodwill will beconducted at the CGU level orgroup of CGU level.The impact of this difference willnot have a material impact on theCompany’s financial statementsbased on the information collectedto date on its opening balance sheet.IAS 37:Provisions,ContingentLiabilities andContingentAssetsc) Reversal of impairment of assetsUnder IFRS, at each balance sheet date, the Company must assesswhether there is an indicator that past impairment charges mayhave decreased and if so, calculate the reversible amount. UnderCanadian GAAP, no such evaluation and reversal is allowed.The main relevant differences between IFRSand Canadian GAAPare the following:a) Under IFRS, provisions involving a large population of itemsmust be evaluated using the expected value method.b) Under IFRS, in a range of estimates where each point in therange is as likely as any other, the mid-point of the range isused. Under Canadian GAAP, the lower point is used.c) The threshold of liability recognition relating to provisions islower under IFRS than under Canadian GAAP.d) Under IFRS, the time value of money must be taken intoconsideration, when material.e) Under IFRS, contingent assets are recorded when they arevirtually certain that the assets will be recovered. UnderCanadian GAAP, contingent assets are not recorded until thecontingency is extinguished.f) Under IFRS, counter claims and/or reimbursements must bereported separately in assets, when virtually certain that theassets will be recovered.The Company has calculatedan adjustment to its openingbalance sheet as at December 31,2009 to increase property, plantand equipment by $1.0 millionand increase retained earnings byapproximately $0.7 million after tax.Findings by Difference:These differences were consideredby the Company and none werefound to have a material impact onthe Company’s financial statementsbased on the information collectedto date.26<strong>Dorel</strong> <strong>Industries</strong> Inc.
StandardsIAS 39:FinancialInstrumentsComparison between IFRS andCompany current accounting policiesThe main relevant differences between IFRS and Canadian GAAPare the following:a) Under Canadian GAAP, when the critical terms of a hedgingrelation match, the short cut method is allowed. Under IFRS,the short cut method is not allowed.FindingsFindings by Difference;Based on the Company’s choice inaccounting policies under CanadianGAAP, this difference does notapply at the transition date.b) Under Canadian GAAP, counterparty credit risk does not haveto be considered when assessing hedge effectiveness. UnderIFRS, counterparty credit risk must be considered.Based on the Company’s choice inaccounting policies under CanadianGAAP, this difference does notapply at the transition date.c) For embedded derivatives, the transitional provisions ofCanadian GAAP contain grandfathering provisions whichallow an adoption timing choice for some embeddedderivatives. Such grandfathering rules do not exist in IFRSthus, potentially resulting in some recognition of embeddedderivatives that were not required to be recognized underCanadian GAAP.Under IFRS, multiple derivatives in a single instrument areaccounted for as a single compound derivative, unless they relateto different risks and are readily separable and independent ofeach other, in which case they are treated as separate derivatives.Under Canadian GAAP, multiple embedded derivatives ina single instrument must be accounted for in aggregate as asingle compound derivative.These differences were consideredby the Company and none werefound to have a material impact onthe Company’s financial statementsbased on the information collectedto date.<strong>Annual</strong> <strong>Report</strong> <strong>2010</strong> 27
StandardsIFRS 2:Share-basedPaymentsComparison between IFRS andCompany current accounting policiesThe main relevant differences between IFRS and Canadian GAAPare the following:a) Share-based payments vesting in installments:Under IFRS, when an entity makes a share based payment thatvests in installments (often referred to as graded vesting), eachtranche of the award should be treated as a separate award.Canadian GAAP offers the option to consider the equityinstruments as a pool and determine fair value using theaverage life of the instruments, provided that compensation isthen recognized on a straight-line basis.Under the Company’s stock option plan, options vest accordingto a graded schedule of 25% per year commencing a day after theend of the first year. From an accounting perspective, the optionoffered by Canadian GAAP was selected i.e. each tranche of theplan is not treated separately. This creates an IFRS differencewith Canadian GAAP.b) Stock options: forfeiture estimates:Under IFRS, an estimate of forfeitures must be factored into thecalculation of periodic compensation expense. Compensationcosts are to be accrued based on the best estimate of the numberof options expected to vest, with revisions made to that estimateif subsequent information indicates that actual forfeitures arelikely to differ from initial estimates. The objective is that, at theend of the vesting period, the cumulative charge to the incomestatement should represent the number of equity instrumentsthat have actually vested multiplied by their fair value.Canadian GAAP offers a choice in accounting for forfeitures.Like IFRS, compensation expense can be accrued based on thebest estimate of the number of instruments expected to vest,with revisions made to that estimate if subsequent informationindicates that actual forfeitures are likely to differ from initialestimates. Unlike IFRS, compensation expense can be accruedassuming that all instruments granted that are subject only toa service requirement are expected to vest, with the effect ofactual forfeitures recognized only as they occur.FindingsFindings by Difference:Share-based payments vestingin installments:The compensation expense will beconsidered over the expected termof each vested tranche. It is expectedthat the amount recorded by theCompany will not be materiallydifferent based on the informationcollected to date.Stock options: forfeiture estimates:The Company will need to modifythe calculation to take into accountan estimation of future forfeitures.The impact is not expected to bematerial for past options based onthe information collected to date.The Company’s accounting policy under Canadian GAAP isto recognize the effect of actual forfeitures only as they occurwhich creates a difference with IFRS.28<strong>Dorel</strong> <strong>Industries</strong> Inc.
StandardsIFRS 3:BusinessCombinationsComparison between IFRS andCompany current accounting policiesThe main relevant differences between IFRS and Canadian GAAPare the following:a) Contingent ConsiderationsInitial Recognition:Under Canadian GAAP, contingent consideration is recognizedat the date of acquisition when the amount can be reasonablyestimated and the outcome is determinable beyond reasonabledoubt. Otherwise, contingent consideration is recognizedwhen resolved.Under IFRS, all contingent consideration has to be recognizedat acquisition, regardless if it can be reasonably estimated or ifthe outcome is determinable beyond reasonable doubt.FindingsFindings by Difference:Contingent ConsiderationsInitial Recognition:This difference does not apply to theCompany at the transition date asall the contingent considerations arerecognized, as the associated criteriafor recognition under CanadianGAAP have been met.Subsequent Recognition:Under Canadian GAAP, when there are revisions to the amountof contingent consideration, the requirement is to recognizethe current fair value of the consideration issued or issuableas an additional cost of the purchase when the contingencyis resolved and the additional consideration is issued orbecomes issuable.Subsequent Recognition:This difference applies to the Companyon a prospective basis. Going forward,contingent considerations will berevaluated every year. Any change infair value will be recorded in theprofit and loss.Under IFRS, when the contingent consideration is (a) classifiedas a liability and (b) not within the scope of IAS 39, changes infair value are recognized in profit or loss.b) Acquisition-related costsUnder Canadian GAAP, certain acquisition-related costsare included in the purchase price, and as such increase thegoodwill amount.Under IFRS, an acquirer shall account for acquisition-relatedcosts as expenses in the periods in which the costs are incurredand the services are received.Acquisition-related costsOn future acquisitions, theCompany will expense such costs asincurred, unless they constitute thecosts associated with issuing debt orequity securities.<strong>Annual</strong> <strong>Report</strong> <strong>2010</strong> 29
The Company has also made choices concerning certain exemptions from retrospective application at the time of changeoverprovided by IFRS 1. As a first step, each exemption permitted under IFRS 1 was reviewed to determine which ones were relevantto the Company. Second, the exemptions that were considered to be relevant were analyzed in order to determine whether theywould be elected or not by the Company. The significant accounting issues are set out in the following table:ExemptionsBusinessCombinationsFindings and ConclusionsIFRS 1 allows the Company to elect not to apply IFRS 3 Business Combinations to past business combinations(business combinations that occurred before the date of transition to IFRS).Given the Company’s history of acquisitions, its current position is not to apply IFRS 3 to anyhistorical business combinations prior to its transition date. The complexity of applying IFRS 3to historical acquisitions and the resultant effort outweighs any potential benefit.Fair Value orRevaluation asDeemed CostUnder IFRS 1, an entity may elect to measure an item of property, plant and equipment in its openingbalance sheet at its fair value and use that fair value as its carrying value as at that date. This election is alsoavailable for intangible assets but only for assets that have an active market.The exemption offered at transition by IFRS 1 will not be used. The Company will adopt the carryingvalues under Canadian GAAP of all items of property, plant and equipment as at the date of transition.EmployeeBenefitsUnder IFRS 1, the Company may elect to recognize in retained earnings all cumulative actuarial gains andlosses at the date of transition to IFRS. The Company has elected to recognize all cumulative actuarial gainsand losses in retained earnings at the date of transition to IFRS.As at December 30, 2009 the net amount unamortized of actuarial losses carried forward was approximately$13.9 million before tax. This will reduce opening retained earnings by $8.4 million after tax, reduce theaccrued benefit asset by $8.4 million, and increase pension and post-retirement benefit obligations by$5.5 million.CumulativeTranslationDifferencesUnder IFRS 1, the Company may elect to recognize all translation adjustments arising on the translation ofthe financial statements of foreign entities in accumulated profits or losses at the opening IFRS balance sheetdate (that is, reset the translation reserve included in equity under Canadian GAAP to zero). If the Companyelects this exemption, the gain or loss on subsequent disposal of the foreign entity will be adjusted only by thoseaccumulated translation adjustments arising after the opening IFRS balance sheet date.In light of the nature of the election, the Company will not use this exemption and will retain the cumulativetranslation difference in its Balance Sheet.Market Risks and UncertaintiesGeneral Economic ConditionsEconomic conditions in <strong>2010</strong> remained difficult in most of the Company’s markets. Unemployment remains at historicallyhigh levels and has a resultant negative impact on consumers’ buying habits. While <strong>Dorel</strong> is not immune to these conditions,the nature of the great majority of the Company’s products, and the customers to which <strong>Dorel</strong>’s products are sold, protect theCompany to a certain extent. Over the course of <strong>Dorel</strong>’s near 50 year history, the Company has experienced several economicdownturns and its products have proven to be ones that consumers continue to purchase. This was illustrated again in <strong>2010</strong> inthat, despite the economic situation; the Company posted good results.30<strong>Dorel</strong> <strong>Industries</strong> Inc.
In the Juvenile segment, the Company believes that demand for its products remains steady as child safety is a constant priorityand parents require products that fill that need regardless of economic conditions. In Recreational / Leisure, the Company believesthat recent consumer trends that consider health and environmental concerns will also help buffer this segment against possibledeclines in overall consumer spending. In addition, <strong>Dorel</strong> offers a great deal of product in the value priced product categoryavailable at its mass merchant customers. This means that should consumers elect to spend less on a particular recreational product,<strong>Dorel</strong> has alternatives to higher priced items. In Home Furnishings, <strong>Dorel</strong> concentrates exclusively on value priced items and sellsthe majority of its products through the mass merchant distribution channel. During difficult economic times, when shoppingfor furniture, consumers are likely to spend less and tend to eschew furniture store outlets and shop at the mass merchants forreasonably priced items.Product Costs and Supply<strong>Dorel</strong> purchases raw materials, component parts and finished goods. The main commodity items purchased for production includeparticleboard and plastic resins, as well as corrugated cartons. Key component parts include car seat and futon covers, hardware,buckles and harnesses, and futon frames. These parts are derived from textiles, and a wide assortment of metals, plastics, and wood.The Company’s finished goods purchases are largely derived from steel, aluminum, resins, textiles, rubber, and wood.Raw material costs continued to increase in <strong>2010</strong>, albeit at a slower pace than the latter part of 2009. Although, resin price increaseswere moderate in the US, more significant increases occurred in Europe in <strong>2010</strong>. Given the current level of oil pricing, furtherincreases in resin prices are possible in 2011. Particleboard pricing in North America increased approximately 10% in <strong>2010</strong>.Container freight costs were significantly higher in <strong>2010</strong> relative to 2009. Container freight rates started declining in the fourthquarter of <strong>2010</strong>. Current expectations are for stable pricing in 2011 as supply is projected to be greater than demand.The Company’s suppliers of components and finished goods experienced input cost increases in <strong>2010</strong>. Although the majorityof increases were moderate, rubber and cotton pricing escalated to record levels well above 2009 pricing. The Chinese currency(“RMB”) appreciated approximately 3% in <strong>2010</strong> and labour costs in China continued to increase.<strong>Dorel</strong> relies on its suppliers for both finished goods and raw materials and has always prided itself on establishing successful longtermrelationships both domestically and overseas. The Company remains committed to actively working with its supplier base toensure that the flow of product is not interrupted. Should the Company’s major existing vendors be unable to supply <strong>Dorel</strong>, thiscould have an adverse affect on the Company going forward.Foreign Currency FluctuationsAs a multinational company, <strong>Dorel</strong> uses the US dollar as its reporting currency. As such, <strong>Dorel</strong> is subject to risk due to variationsin currency values against the US dollar. Foreign currency risk occurs at two levels; operational and translational. Operationalcurrency risk occurs when a given division either incurs costs or generates revenues in a currency other than its own functionalcurrency. The Company’s operations that are most affected by operational currency risk are those that operate in the Euro zone, theUnited Kingdom, Canada, Brazil and Australia. Translational risk occurs upon conversion of non-US functional currency divisions’results to the US dollar for reporting purposes. As <strong>Dorel</strong>’s European, Brazilian and Australian operations are the only significantsubsidiaries that do not use the US dollar as their functional currency, translational risk is limited to only those operations. Thetwo major functional currencies in Europe are the Euro and Pound Sterling.<strong>Dorel</strong>’s European, Australian and Brazilian operations are negatively affected by a stronger US dollar as portions of its purchasesare in that currency, while its revenues are not. <strong>Dorel</strong>’s Canadian operations within Home Furnishings benefit from a stronger USdollar as large portions of its revenues are generated in the United States and the majority of its costs are in Canadian dollars. Thissituation is mitigated somewhat by <strong>Dorel</strong> Distribution Canada’s juvenile operations that import US dollar denominated goods andsells to Canadian customers. As a result, over the past several years, the weakening of the US dollar against the Euro, Pound Sterlingand Canadian dollar has had an overall impact that was not material year-over-year as these various impacts have generally offset oneanother. However, these offsetting impacts occur in different segments, meaning the negative impact of a stronger US dollar occurs inthe Juvenile segment while the positive impact occurs mainly in the Home Furnishings segment. The Recreational / Leisure segmentimpact is generally neutral, with its European operations offsetting against its Canadian operations.<strong>Annual</strong> <strong>Report</strong> <strong>2010</strong> 31
Where advantageous, the Company uses options, futures and forward contracts to hedge against these adverse fluctuationsin currency. Further details on the Company’s hedging strategy and the impact in the year can be found in Note 14 to theCompany’s year-end Consolidated Financial Statements. While the Canadian operations and European operations help offsetthe possible negative impact of changes in the US dollar, a significant change in the value of the US dollar would affectfuture earnings.Concentration of RevenuesFor the year ended December 30, <strong>2010</strong>, one customer accounted for over 10% of the Company’s revenues, at 31.0% of <strong>Dorel</strong>’stotal. In 2009, this customer accounted for 31.4% of revenues. <strong>Dorel</strong> does not have long-term contracts with its customers, andas such revenues are dependent upon <strong>Dorel</strong>’s continued ability to deliver attractive products at a reasonable price, combined withhigh levels of service. There can be no assurance that <strong>Dorel</strong> will be able to sell to such customers on an economically advantageousbasis in the future or that such customers will continue to buy from <strong>Dorel</strong>.Customer and Credit RiskThe majority of the Company’s revenue is derived from sales to major retail chains in North America and Europe. The balanceof <strong>Dorel</strong>’s sales are made mostly to specialty juvenile stores in Europe and independent bike dealers in both the United Statesand Europe. To minimize credit risk, the Company conducts ongoing credit reviews and maintains credit insurance on selectedaccounts. Should certain of these major retailers cease operations, there could be a material short term adverse effect on theCompany’s consolidated results of operations. In the long term, the Company believes that should certain retailers cease to exist,consumers will shop at competitors at which <strong>Dorel</strong>’s products will generally also be sold.Product LiabilityAs with all manufacturers of products designed for use by consumers, <strong>Dorel</strong> is subject to numerous product liability claims,particularly in the United States. At <strong>Dorel</strong>, there is an ongoing effort to improve quality control and to ensure the safety of itsproducts. The Company self-insures to mitigate its product liability exposure. No assurance can be given that a judgment willnot be rendered against it in an amount exceeding the amount of insurance coverage or in respect of a claim for which <strong>Dorel</strong> isnot insured.Income TaxesThe Company’s current organizational structure has resulted in a comparatively low effective income tax rate. This structureand the resulting tax rate are supported by current domestic tax laws in which the Company operates and by the interpretationand application of these tax laws. The rate can also be affected by the application of income tax treaties between these variousjurisdictions. Unanticipated changes to these interpretations and applications of current domestic tax laws, or to the tax rates andtreaties, could impact the effective income tax rate of the Company going forward.Product and Brand DevelopmentTo support continued revenue growth, the Company must continue to update existing products, design innovative new items,develop strong brands and make significant capital investments. The Company has invested heavily in product developmentand plans to keep it at the centre of its focus. In addition, the Company must continue to maintain, develop and strengthen itsend-user brands. Should the Company invest in or design products that are not accepted in the marketplace, or if its products arenot brought to market in a timely manner, and in certain cases, fail to be approved by the appropriate regulatory authorities, thiscould negatively impact future growth.Regulatory EnvironmentThe Company operates in certain industries which are highly regulated and as such operates within constraints imposed byvarious regulatory authorities. In recent years greater concern regarding product safety has resulted in more onerous regulationsbeing placed on the Company as well as on all of the Company’s competitors operating in these industries. <strong>Dorel</strong> has alwaysoperated within this environment and has always placed a great deal of resources on meeting these obligations, and is thereforewell positioned to meet these regulatory requirements. However, any future regulations that would require additional costs couldhave an impact on the Company going forward.32<strong>Dorel</strong> <strong>Industries</strong> Inc.
Liquidity and Access to Capital Resources<strong>Dorel</strong> requires continued access to capital markets to support its activities. Part of the Company’s long-term strategy is to growthrough the acquisition of complementary businesses that it believes will enhance the value of the Company for its shareholders. Tosatisfy its financing needs, the Company relies on long-term and short-term debt and cash flow from operations. Any impedimentsto the Company’s ability to access capital markets, including significant changes in market interest rates, general economicconditions or the perception in the capital markets of the Company’s financial condition or prospects, could have a materialadverse effect on the Company’s financial condition and results of operation.Valuation of Goodwill and other Intangible AssetsAs part of annual impairment tests, the value of goodwill and other indefinite life intangible assets are subject to significantassumptions, such as future expected cash flows, and assumed discount and weighted average cost of capital rates. In addition,the value of customer relationship intangible assets recognized includes significant assumptions in reference to customer attritionrates and useful lives. Should current market conditions adversely effect the Company’s expectations of future results, this couldresult in a non-cash impairment being recognized at some point in the future. Additionally, in the current market environment,some of the other assumptions could be impacted by factors beyond the Company’s control. For example, more conservative riskassumptions could materially affect these valuations and could require a downward adjustment in the value of these intangibleassets in the future.Other InformationThe designation, number and amount of each class and series of its shares outstanding as of March 4, 2011 are as follows:An unlimited number of Class “A” Multiple Voting Shares without nominal or par value, convertible at any time at the option ofthe holder into Class “B” Subordinate Voting Shares on a one-for-one basis, and;An unlimited number of Class “B” Subordinate Voting Shares without nominal or par value, convertible into Class “A” MultipleVoting Shares, under certain circumstances, if an offer is made to purchase the Class “A” shares.Details of the issued and outstanding shares are as follows:Class A Class B TotalNumber $ (‘000) Number $ (‘000) $ (‘000)4,229,510 1,792 28,434,577 177,018 178,810Outstanding stock options and Deferred Share Unit items are disclosed in Note 18 to the Consolidated Financial Statements. Therewere no significant changes to these values in the period between the year end and the date of the preparation of this MD&A.Disclosure Controls and Procedures and Internal Controls over Financial <strong>Report</strong>ingDisclosure controls and proceduresNational Instrument 52-109, “Certification of Disclosure in Issuers’ <strong>Annual</strong> and Interim Filings”, issued by the CanadianSecurities Administrators requires Chief Executive Officers (“CEOs”) and Chief Financial Officers (“CFOs”) to certify that theyare responsible for establishing and maintaining disclosure controls and procedures for the Company, that disclosure controlsand procedures have been designed and are effective in providing reasonable assurance that material information relating to theCompany is made known to them, that they have evaluated the effectiveness of the Company’s disclosure controls and procedures,and that their conclusions about the effectiveness of those disclosure controls and procedures at the end of the period covered bythe relevant annual filings have been disclosed by the Company.<strong>Annual</strong> <strong>Report</strong> <strong>2010</strong> 33
Under the supervision of and with the participation of management, including the President and Chief Executive Officerand Executive Vice-president, Chief Financial Officer and Secretary, management has evaluated the design of the Company’sdisclosure controls and procedures as at December 30, <strong>2010</strong> and have concluded that those disclosure controls and procedureswere appropriately designed and operating effectively in ensuring that information required to be disclosed by the Company in itscorporate filings is recorded, processed, summarized and reported within the required time period for the year then ended.Internal controls over financial reportingNational Instrument 52-109 also requires CEOs and CFOs to certify that they are responsible for establishing and maintaininginternal controls over financial reporting for the Company, that those internal controls have been designed and are effectivein providing reasonable assurance regarding the reliability of financial reporting and the preparation of financial statements inaccordance with Canadian generally accepted accounting principles, and that the Company has disclosed any changes in itsinternal controls during its most recent interim period that has materially affected, or is reasonably likely to materially affect, itsinternal control over financial reporting.During <strong>2010</strong>, management evaluated the Company’s internal controls over financial reporting to ensure that they have beendesigned and are effective in providing reasonable assurance regarding the reliability of financial reporting and the preparation offinancial statements in accordance with Canadian generally accepted accounting principles. Management has used the InternalControl-Integrated Framework to evaluate the effectiveness of internal controls over reporting, which is recognized and suitableframework developed by the Committee of Sponsoring Organizations of the Treadway Commission (“COSO”).Under the supervision of and with the participation of management, including the President and Chief Executive Officer andExecutive Vice-president, Chief Financial Officer and Secretary, management has evaluated the internal controls over financialreporting as at December 30, <strong>2010</strong> and have concluded that those internal controls were effective in providing reasonable assuranceregarding the reliability of financial reporting and the preparation of financial statements in accordance with Canadian generallyaccepted accounting principles.Caution Regarding Forward Looking InformationCertain statements included in this MD&A may constitute “forward-looking statements” within the meaning of applicableCanadian securities legislation. Except as may be required by Canadian securities laws, the Company does not undertake anyobligation to update or revise any forward-looking statements, whether as a result of new information, future events or otherwise.Forward-looking statements, by their very nature, are subject to numerous risks and uncertainties and are based on severalassumptions which give rise to the possibility that actual results could differ materially from the Company’s expectations expressedin or implied by such forward-looking statements and that the objectives, plans, strategic priorities and business outlook may notbe achieved. As a result, the Company cannot guarantee that any forward-looking statement will materialize. Forward-lookingstatements are provided in this MD&A for the purpose of giving information about Management’s current expectations and plansand allowing investors and others to get a better understanding of the Company’s operating environment. However, readers arecautioned that it may not be appropriate to use such forward-looking statements for any other purpose.Forward-looking statements made in this MD&A are based on a number of assumptions that the Company believed werereasonable on the day it made the forward-looking statements. Refer, in particular, to the section of this MD&A entitledMarket Risks and Uncertainties for a discussion of certain assumptions the Company has made in preparing any forwardlookingstatements.34<strong>Dorel</strong> <strong>Industries</strong> Inc.
Factors that could cause actual results to differ materially from the Company’s expectations expressed in or implied by theforward-looking statements include: general economic conditions; changes in product costs and supply channel; foreigncurrency fluctuations; customer and credit risk including the concentration of revenues with few customers; costs associatedwith product liability; changes in income tax legislation or the interpretation or application of those rules; the continued abilityto develop products and support brand names; changes in the regulatory environment; continued access to capital resourcesand the related costs of borrowing; changes in assumptions in the valuation of goodwill and other intangible assets and subjectto dividends being declared by the Board of Directors, there can be no certainty that <strong>Dorel</strong> <strong>Industries</strong> Inc.’s Dividend Policywill be maintained. These and other risk factors that could cause actual results to differ materially from expectations expressedin or implied by the forward-looking statements are discussed throughout this MD&A and, in particular, under Market Risksand Uncertainties.The Company cautions readers that the risks described above are not the only ones that could impact it. Additional risks anduncertainties not currently known to the Company or that the Company currently deems to be immaterial may also have amaterial adverse effect on our business, financial condition or results of operations.Except as otherwise indicated, forward-looking statements do not reflect the potential impact of any non-recurring or other unusualitems or of any dispositions, mergers, acquisitions, other business combinations or other transactions that may be announced orthat may occur after the date hereof. The financial impact of these transactions and non-recurring and other unusual items can becomplex and depends on the facts particular to each of them. The Company therefore cannot describe the expected impact in ameaningful way or in the same way the Company presents known risks affecting the business.Management’s <strong>Report</strong><strong>Dorel</strong> <strong>Industries</strong> Inc.’s <strong>Annual</strong> <strong>Report</strong> for the year ended December 30, <strong>2010</strong>, and the financial statements included herein,were prepared by the Corporation’s Management and approved by the Board of Directors. The Audit Committee of the Boardis responsible for reviewing the financial statements in detail and for ensuring that the Corporation’s internal control systems,management policies and accounting practices are adhered to.The financial statements contained in this <strong>Annual</strong> <strong>Report</strong> have been prepared in accordance with the accounting policies whichare enunciated in said report and which Management believes to be appropriate for the activities of the Corporation. The externalauditors appointed by the Corporation’s shareholders, KPMG, LLP have audited these financial statements and their reportappears below. All information given in this <strong>Annual</strong> <strong>Report</strong> is consistent with the financial statements included herein.Martin SchwartzPresident and Chief Executive OfficerJeffrey SchwartzExecutive Vice-President, Chief Financial Officer and Secretary<strong>Annual</strong> <strong>Report</strong> <strong>2010</strong> 35
AUDITORS’ REPORT To the Shareholders OFDOREL INDUSTRIES INC.We have audited the accompanying consolidated financial statements of <strong>Dorel</strong> <strong>Industries</strong> Inc., which comprise the consolidatedbalance sheets as at December 30, <strong>2010</strong> and 2009, the consolidated statements of income, comprehensive income, changes inshareholders’ equity and cash flows for the years then ended, and notes, comprising a summary of significant accounting policiesand other explanatory information.Management’s Responsibility for the Consolidated Financial StatementsManagement is responsible for the preparation and fair presentation of these consolidated financial statements in accordance withCanadian generally accepted accounting principles, and for such internal control as management determines is necessary to enable thepreparation of consolidated financial statements that are free from material misstatement, whether due to fraud or error.Auditors’ ResponsibilityOur responsibility is to express an opinion on these consolidated financial statements based on our audits. We conducted ouraudits in accordance with Canadian generally accepted auditing standards. Those standards require that we comply with ethicalrequirements and plan and perform the audit to obtain reasonable assurance about whether the consolidated financial statementsare free from material misstatement.An audit involves performing procedures to obtain audit evidence about the amounts and disclosures in the consolidated financialstatements. The procedures selected depend on our judgment, including the assessment of the risks of material misstatementof the consolidated financial statements, whether due to fraud or error. In making those risk assessments, we consider internalcontrol relevant to the entity’s preparation and fair presentation of the consolidated financial statements in order to design auditprocedures that are appropriate in the circumstances, but not for the purpose of expressing an opinion on the effectiveness of theentity’s internal control. An audit also includes evaluating the appropriateness of accounting policies used and the reasonableness ofaccounting estimates made by management, as well as evaluating the overall presentation of the consolidated financial statements.We believe that the audit evidence we have obtained in our audits is sufficient and appropriate to provide a basis for our audit opinion.OpinionIn our opinion, the consolidated financial statements present fairly, in all material respects, the consolidated financial position of<strong>Dorel</strong> <strong>Industries</strong> Inc. as at December 30, <strong>2010</strong> and 2009, and its consolidated results of operations and its consolidated cash flowsfor the years then ended in accordance with Canadian generally accepted accounting principles.KPMG LLPChartered AccountantsMarch 10, 2011Montreal, Canada*CA Auditor permit no 14044KPMG LLP is a Canadian limited liability partnership and a member firm of the KPMG network ofindependent member firms affiliated with KPMG International Cooperative (“KPMG International”),a Swiss entity. KPMG Canada provides services to KPMG LLP.36<strong>Dorel</strong> <strong>Industries</strong> Inc.
Consolidated Balance SheetsAs at December 30, <strong>2010</strong> and 2009(All figures in thousands of U.S. dollars)As atAs atDecember 30, <strong>2010</strong> December 30, 2009$ $Reclassified (Note 12)ASSETSCURRENT ASSETSCash and cash equivalents (Note 26) 15,748 19,847Accounts receivable (Notes 5 and 14) 359,061 349,990Income taxes receivable 14,096 16,264Inventories (Note 6) 510,068 399,866Prepaid expenses 17,823 17,358Future income taxes (Note 24) 42,444 38,042959,240 841,367PROPERTY, PLANT AND EQUIPMENT (Note 7) 157,865 153,279INTANGIBLE ASSETS (Note 8) 396,354 401,831GOODWILL (Note 27) 554,386 569,824OTHER ASSETS (Notes 9 and 14) 28,115 35,8792,095,960 2,002,180See accompanying notes.<strong>Annual</strong> <strong>Report</strong> <strong>2010</strong> 37
Consolidated Balance Sheets (continued)As at December 30, <strong>2010</strong> and 200(All figures in thousands of U.S. dollars)As atAs atDecember 30, <strong>2010</strong> December 30, 2009$ $Reclassified (Note 12)LIABILITIESCURRENT LIABILITIESBank indebtedness (Notes 10 and 14) 30,515 1,987Accounts payable and accrued liabilities (Notes 11 and 14) 370,222 339,294Income taxes payable 12,755 26,970Future income taxes (Note 24) 1,252 85Current portion of long-term debt (Notes 12 and 14) 10,667 122,508425,411 490,844LONG-TERM DEBT (Notes 12 and 14) 319,281 227,075PENSION & POST-RETIREMENT BENEFITOBLIGATIONS (Note 16) 21,538 20,939FUTURE INCOME TAXES (Note 24) 113,249 128,984OTHER LONG-TERM LIABILITIES (Notes 13 and 14) 35,999 25,139SHAREHOLDERS’ EQUITYCAPITAL STOCK (Note 17) 178,816 174,816CONTRIBUTED SURPLUS 23,776 20,311RETAINED EARNINGS 913,490 818,707ACCUMULATED OTHER COMPREHENSIVE INCOME(Note 19) 64,400 95,365977,890 914,0721,180,482 1,109,1992,095,960 2,002,180COMMITMENTS AND GUARANTEES (Note 20)CONTINGENCIES (Note 21)ON BEHALF OF THE BOARDDirectorDirectorSee accompanying notes.38<strong>Dorel</strong> <strong>Industries</strong> Inc.
Consolidated Statements of IncomeFor the years ended December 30, <strong>2010</strong> and 2009(All figures in thousands of U.S. dollars, except per share amounts)<strong>2010</strong> 2009$ $Sales 2,301,393 2,125,459Licensing and commission income 11,593 14,655TOTAL REVENUE 2,312,986 2,140,114EXPENSESCost of sales 1,780,204 1,634,570Selling, general and administrative expenses 328,138 316,272Depreciation and amortization 31,373 27,366Research and development costs 13,626 17,184Interest (Note 23) 18,927 16,3752,172,268 2,011,767Income before income taxes 140,718 128,347Income taxes (Note 24)Current 20,975 24,952Future (8,110) (3,839)12,865 21,113NET INCOME 127,853 107,234EARNINGS PER SHARE (Note 25)Basic 3.89 3.23Diluted 3.85 3.21See accompanying notes.<strong>Annual</strong> <strong>Report</strong> <strong>2010</strong> 39
Consolidated Statements of Comprehensive IncomeFor the years ended December 30, <strong>2010</strong> and 2009(All figures in thousands of U.S. dollars)<strong>2010</strong> 2009$ $NET INCOME 127,853 107,234OTHER COMPREHENSIVE INCOME:Cumulative translation adjustment:Net change in unrealized foreign currency gains (losses)on translation of net investments in self-sustainingforeign operations, net of tax of nil (29,038) 11,331Net changes in cash flow hedges:Net change in unrealized gains (losses) on derivativesdesignated as cash flow hedges (4,415) 861Reclassification to income or the related non financial asset 648 706Future income taxes 1,840 (672)(1,927) 895TOTAL OTHER COMPREHENSIVE INCOME (LOSS) (30,965) 12,226COMPREHENSIVE INCOME 96,888 119,460See accompanying notes.40<strong>Dorel</strong> <strong>Industries</strong> Inc.
Consolidated Statements of Changes in Shareholders’ EquityFor the years ended December 30, <strong>2010</strong> and 2009(All figures in thousands of U.S. dollars)<strong>2010</strong> 2009$ $CAPITAL STOCK (Note 17)Balance, beginning of year 174,816 177,422Issued under stock option plan 5,755 —Reclassification from contributed surplus dueto exercise of stock options 1,402 —Repurchase and cancellation of shares (3,157) (2,606)Balance, end of year 178,816 174,816CONTRIBUTED SURPLUSBalance, beginning of year 20,311 16,070Exercise of stock options (Note 17) (1,402) —Stock-based compensation (Note 18) 4,867 4,241Balance, end of year 23,776 20,311RETAINED EARNINGSBalance, beginning of year 818,707 738,113Net income 127,853 107,234Adjustment to opening retained earnings from adopting a newaccounting standard for inventories, net of tax of $1,415 — (2,096)Premium paid on share repurchase (Note 17) (14,120) (7,898)Dividends on common shares (18,895) (16,614)Dividends on deferred share units (55) (32)Balance, end of year 913,490 818,707ACCUMULATED OTHER COMPREHENSIVE INCOME (Note 19)Balance, beginning of year 95,365 83,139Total other comprehensive income (loss) (30,965) 12,226Balance, end of year 64,400 95,365TOTAL SHAREHOLDERS’ EQUITY 1,180,482 1,109,199See accompanying notes.<strong>Annual</strong> <strong>Report</strong> <strong>2010</strong> 41
Consolidated Statements of Cash FlowsFor the years ended December 30, <strong>2010</strong> and 2009(All figures in thousands of U.S. dollars)<strong>2010</strong> 2009$ $CASH PROVIDED BY (USED IN):OPERATING ACTIVITIESNet income 127,853 107,234Items not involving cash:Depreciation and amortization 51,091 49,191Amortization of deferred financing costs 324 266Accretion expense on contingent considerations (Note 23) 2,571 —Future income taxes (8,110) (3,839)Stock-based compensation (Note 18) 4,530 3,840Pension and post-retirement defined benefit plans (Note 16) 1,001 —Restructuring activities — (721)Loss on disposal of property, plant and equipment 1,070 886180,330 156,857Net changes in non-cash balances related to operations (Note 26) (102,312) 47,659CASH PROVIDED BY OPERATING ACTIVITIES 78,018 204,516FINANCING ACTIVITIESBank indebtedness 28,472 (3,391)Increase of long-term debt 200,000 —Repayments of long-term debt (220,491) (110,522)Share repurchase (Note 17) (17,277) (10,504)Issuance of capital stock (Note 17) 5,755 —Dividends on common shares (18,895) (16,614)CASH USED IN FINANCING ACTIVITIES (22,436) (141,031)INVESTING ACTIVITIESAcquisition of businesses (Notes 4 and 26) (220) (21,661)Additions to property, plant and equipment – net (35,465) (21,893)Additions to intangible assets (19,511) (18,753)CASH USED IN INVESTING ACTIVITIES (55,196) (62,307)Effect of exchange rate changes on cash and cash equivalents (4,485) 1,703NET (DECREASE) INCREASE IN CASHAND CASH EQUIVALENTS (4,099) 2,881Cash and cash equivalents, beginning of year 19,847 16,966CASH AND CASH EQUIVALENTS, END OF YEAR (Note 26) 15,748 19,847See accompanying notes.42<strong>Dorel</strong> <strong>Industries</strong> Inc.
Notes to the Consolidated Financial StatementsFor the years ended December 30, <strong>2010</strong> and 2009(All figures in thousands of U.S. dollars, except per share amounts)NOTE 1 – NATURE OF OPERATIONS<strong>Dorel</strong> <strong>Industries</strong> Inc. (the “Company”) is a global consumer products company which designs, manufactures or sources, marketsand distributes a diverse portfolio of powerful product brands, marketed through its juvenile, recreational/leisure and homefurnishings segments. The principal markets for the Company’s products are the United States, Canada and Europe.NOTE 2 – BASIS OF PRESENTATIONThe financial statements have been prepared in accordance with Canadian Generally Accepted Accounting Principles (GAAP)using the U.S. dollar as the reporting currency. The U.S. dollar is the functional currency of the Canadian parent company. Certaincomparative accounts have been reclassified to conform to the <strong>2010</strong> financial statement presentation.NOTE 3 – SIGNIFICANT ACCOUNTING POLICIESBasis of ConsolidationThe consolidated financial statements include the accounts of the Company and its subsidiaries. All significant inter-companybalances and transactions have been eliminated.Use of EstimatesThe preparation of consolidated financial statements in conformity with generally accepted accounting principles requiresmanagement to make estimates and assumptions that affect the reported amounts of assets and liabilities, related amounts ofrevenues and expenses, and disclosure of contingent assets and liabilities. Significant estimates and assumptions are used toevaluate the carrying values of long-lived assets, assets held for sale and goodwill, fair value measurement of financial instruments,valuation allowances for accounts receivable and inventories, accrual of product warranties, liabilities for potential litigation claimsand settlements including product liability, assets and obligations related to employee pension and post-retirement benefits, theestablishment of worldwide provision for income taxes including future income tax liabilities and the determination of the realizablevalue of future income tax assets, and the allocation of the purchase price of acquired businesses. Estimates and assumptions arereviewed periodically and the effects of revisions are reflected in the consolidated financial statements in the period they aredetermined to be necessary. Actual results could differ from those estimates.Revenue RecognitionSales are recognized at the fair value of the consideration received or receivable upon shipment of product and transfer of risks andrewards of ownership to the customer. The Company records estimated reductions to revenue for customer programs and incentiveofferings, including special pricing agreements, promotions, advertising allowances and other volume-based incentives. Provisionsfor customer incentives and provisions for sales and return allowances are made at the time of product shipment. Sales are reportednet of these provisions and excludes sales taxes.When the Company acts in the capacity of an agent rather than as the principal in a transaction, the revenue recognized is the netamount of commission made by the Company. Licensing and commission income is recognized based on the contract terms onan accrual basis.Cash and Cash EquivalentsCash and cash equivalents include all highly liquid instruments with original maturities of three months or less. The carryingamounts of cash and cash equivalents are stated at cost, which approximates their fair values.<strong>Annual</strong> <strong>Report</strong> <strong>2010</strong> 43
Notes to the Consolidated Financial StatementsFor the years ended December 30, <strong>2010</strong> and 2009(All figures in thousands of U.S. dollars, except per share amounts)NOTE 3 – SIGNIFICANT ACCOUNTING POLICIES (continued)InventoriesInventories are valued at the lower of cost and net realizable value. Cost is determined on a first-in, first-out basis. Inventory costsinclude the purchase price and other costs directly related to the acquisition of materials. Inventory costs also include the costsdirectly related to the conversion of materials to finished goods, such as direct labour, and an allocation of fixed and variableproduction overheads, including manufacturing depreciation expense. The allocation of fixed production overheads to the cost ofinventories is based on a normal range of capacity of the production facilities. Normal capacity is the average production expectedto be achieved over a number of periods under normal circumstances. Cost also may include transfers from other comprehensiveincome of any gain or loss on qualifying cash flow hedges of foreign currency purchases of inventories.Net realizable value is the estimated selling price in the ordinary course of business, less the estimated costs of completion andselling expenses. When the circumstances that previously caused the inventories to be written down below cost no longer exist orwhen there is clear evidence of an increase in net realizable value because of changed economic circumstances, the amount of thewrite-down is reversed. The reversal is limited to the amount of the original write-down.Property, Plant and EquipmentProperty, plant and equipment are recorded at cost less accumulated depreciation and/or accumulated impairment losses, if any. Capitalleases where the risks and rewards of ownership are transferred to the Company are included in property, plant and equipment.Property, plant and equipment are depreciated as follows:MethodRateBuildings and improvements Straight-line 40 yearsMachinery and equipment Declining balance 15%Moulds Straight-line 3 to 5 yearsFurniture and fixtures Declining balance 20%Vehicles Declining balance 30%Computer equipment Declining balance 30%Leasehold improvements Straight-line Over the lesser ofthe useful life andthe term of the leaseThe capitalized value of depreciable assets under capital leases is amortized over the period of expected use, on a basis thatis consistent with the above depreciation methods and rates, if the lease contains terms that allow ownership to pass to theCompany or contains a bargain purchase option. Otherwise, the asset is amortized over the lease term. Assets not in service includeexpenditures incurred to date for plant expansions which are still in process, and property, plant and equipment not yet in serviceas at the balance sheet date. Depreciation of assets not in service begins when they are ready for their intended use.The property, plant and equipment’s residual values and useful lives are reviewed at each financial year end, and adjustedprospectively, if appropriate.44<strong>Dorel</strong> <strong>Industries</strong> Inc.
Notes to the Consolidated Financial StatementsFor the years ended December 30, <strong>2010</strong> and 2009(All figures in thousands of U.S. dollars, except per share amounts)NOTE 3 – SIGNIFICANT ACCOUNTING POLICIES (continued)Intangible AssetsIntangible assets are recorded at cost:TrademarksTrademarks acquired as part of business acquisitions and registered trademarks are considered to have an indefinite life andare therefore not subject to amortization. They are tested annually for impairment or more frequently when events or changesin circumstances indicate that the trademarks might be impaired. The impairment test compares the carrying amount of thetrademarks with its fair value.Customer RelationshipsCustomer relationships acquired as part of business acquisitions are amortized on a straight-line basis over a period of15to 25 years.Supplier RelationshipSupplier relationship acquired as part of a business acquisition is amortized on a straight-line basis over a period of 10 years.PatentsPatents are amortized on a straight-line basis over their expected useful lives ranging from 4 years to 18 years.Non-Compete AgreementNon-compete agreement acquired as part of a business acquisition is amortized on a straight-line basis over a period of fouryears being the period of time the non-compete agreement is in place.Software LicenceSoftware licence is amortized on a straight-line basis over its expected useful live of 10 years.Research and Development CostsThe Company incurs costs on activities which relate to research and development of new products. Research costs areexpensed as they are incurred. Development costs are also expensed as incurred unless they meet specific criteria related totechnical, market and financial feasibility. Deferred development costs are amortized on a straight-line basis over a period oftwo years or expensed if capitalized projects are not completed.GoodwillGoodwill represents the excess of the purchase price, including acquisition costs, over the fair values assigned to identifiablenet assets acquired. Goodwill, which is not amortized, is tested for impairment annually or more frequently when an event orcircumstance occurs that more likely than not reduces the fair value of a reporting unit below its carrying amount.<strong>Annual</strong> <strong>Report</strong> <strong>2010</strong> 45
Notes to the Consolidated Financial StatementsFor the years ended December 30, <strong>2010</strong> and 2009(All figures in thousands of U.S. dollars, except per share amounts)NOTE 3 – SIGNIFICANT ACCOUNTING POLICIES (continued)Goodwill (continued)A two-step impairment test is used to identify potential goodwill impairment and measure the amount of a goodwill impairmentloss to be recognized, if any. The fair value of a reporting unit is first compared with its carrying amount, including goodwill, inorder to identify a potential impairment. When the fair value of a reporting unit exceeds its carrying amount, goodwill of thereporting unit is considered not to be impaired and the second step of the impairment test is unnecessary. When the carryingamount of a reporting unit exceeds its fair value, the implied fair value of the reporting unit’s goodwill is then compared with itscarrying amount to measure the amount of the impairment loss, if any. The implied fair value of goodwill is the excess of the fairvalue of the reporting unit over the fair value of the identifiable net assets of the reporting unit. The fair value of a reporting unitis calculated based on discounted future net cash flows or valuations based on a market approach. When the carrying amountof a reporting unit goodwill exceeds the implied fair value of the goodwill, an impairment loss is recognized in an amount equalto the excess.Impairment or Disposal of Long-Lived AssetsThe Company reviews its long-lived assets, consisting of property, plant and equipment and amortizable intangible assets, forimpairment whenever events or changes in circumstances indicate that the carrying amount of a long-lived asset may not berecoverable. Determination of recoverability is based on an estimate of undiscounted future net cash flows resulting from the useof the assets and its eventual disposition. The amount of the impairment loss recognized is measured as the amount by whichthe carrying amount of the assets exceeds the fair value, with fair value being determined based upon discounted future net cashflows or appraised values, depending on the nature of the assets. Such evaluations for impairment are significantly affected byestimates of future prices for the Company’s product, economic trends in the market and other factors. Quoted market values areused whenever available to estimate fair value. When quoted market values are unavailable, the fair value of the long-lived asset isgenerally based on estimates of discounted expected net cash flows. Assets held for sale are reflected at the lower of their carryingamount or fair values less cost to sell and are not depreciated while classified as held for sale. Assets held for sale are included inother assets on the balance sheet.Costs relating to revolving credit facilityThe Company incurred certain costs related to the revolving credit facility. These deferred charges are recorded at cost lessaccumulated amortization. These amounts are amortized as interest expense on a straight-line basis over the term or life of therelated debt. The deferred charges are included in other assets on the balance sheet.Foreign CurrencyThe assets and liabilities of self-sustaining foreign operations, whose functional currency is other than the U.S. dollar, are translatedinto U.S. dollars at the exchange rates in effect at the balance sheet date. Revenues and expenses are translated at average exchangerates for the period. Differences arising from the exchange rate changes are included in the accumulated other comprehensiveincome (AOCI) component of shareholders’ equity. If there is a reduction in the Company’s permanent investment in aself-sustaining foreign operation, the relevant portion of AOCI is recognized in Selling, general and administrative expenses.Income and expenses in foreign currencies are translated to the respective functional currency of the entity at the averageexchange rates for the period. The monetary items denominated in currencies other than the functional currency of an entityare translated at the exchange rates prevailing at the balance sheet date and translation gains and losses are included in income.Non-monetary items are translated at historical rates.46<strong>Dorel</strong> <strong>Industries</strong> Inc.
Notes to the Consolidated Financial StatementsFor the years ended December 30, <strong>2010</strong> and 2009(All figures in thousands of U.S. dollars, except per share amounts)NOTE 3 – SIGNIFICANT ACCOUNTING POLICIES (continued)Financial InstrumentsA financial instrument is any contract that gives rise to a financial asset of one party and a financial liability or equity instrument ofanother party. Financial assets of the Company mainly comprise cash and cash equivalents, foreign exchange contracts and interestrate swaps with a positive fair value, accounts receivable – trade, accounts receivable – other. Financial liabilities of the Companymainly comprises foreign exchange contracts and interest rate swaps with a negative fair value, bank indebtedness, accounts payableand accrued liabilities, long-term debt, other long-term liabilities and balance of sale payable.All financial instruments, including derivatives, are included in the consolidated balance sheet when the Company becomesa party to the contractual obligations of the instrument. Except for those incurred on the revolving credit facility, transactioncosts are deducted from the financial liability and are amortized using the effective interest method over the expected life of therelated liability.Financial assets and financial liabilities are offset and the net amount reported in the consolidated balance sheet if, and only if, thereis a currently enforceable legal right to offset the recognized amounts and there is an intention to settle on a net basis, or to realizethe assets and settles the liabilities simultaneously.Financial assetsFinancial assets are classified into one of the following categories: held for trading, held-to-maturity investments, loans andreceivables, available-for-sale financial assets, or as derivatives designated as hedging instruments in an effective hedge. Financialinstruments are initially and subsequently measured at fair value with the exception of loans and receivables and investmentsheld-to-maturity which are subsequently measured at amortized cost using the effective interest rate method, less impairment.Subsequent recognition of changes in fair value of financial instruments re-measured each reporting date at fair value dependon their initial classification. Financial assets are classified as held for trading if they are acquired for the purpose of selling orrepurchasing in the near term. This category includes derivative financial instruments entered into by the Company that are notdesignated as hedging instruments in hedge relationships. Held for trading assets are measured at fair value with all gains and lossesincluded in net income in the period in which they arise. Available-for-sale financial instruments are measured at fair value withgains and losses included in other comprehensive income until the asset is removed from the balance sheet or until impaired.Financial assets are derecognized when the Company’s rights to cash flows from the respective assets have expired or have beentransferred and the Company has neither exposure to the risks inherent in those assets nor entitlement to rewards from them.Financial liabilitiesFinancial liabilities are classified into one of the following categories: held for trading, other financial liabilities, or as derivativesdesignated as hedging instruments in an effective hedge. Financial liabilities are classified as held for trading if they are acquired forthe purpose of selling in the near term. This category includes derivative financial instruments entered into by the Company thatare not designated as hedging instruments in hedge relationships. Held for trading financial liabilities are measured at fair valuewith all gains and losses included in net income in the period in which they arise.Financial liabilities are derecognized when the obligation under the liabilities are discharged or cancelled or expired or replaced bya new liability with substantially modified terms.The Company has classified its cash and cash equivalents as held for trading. Accounts receivable are classified as loans andreceivables. Bank indebtedness, accounts payable and accrued liabilities, long-term debt, other long-term liabilities and balance ofsale payable are classified as other financial liabilities, all of which are measured at amortized cost. Derivative financial instrumentsare either classified as held for trading if they are not designated as hedging instruments in hedge relationships or as derivativesdesignated as hedging instruments in an effective hedge.<strong>Annual</strong> <strong>Report</strong> <strong>2010</strong> 47
Notes to the Consolidated Financial StatementsFor the years ended December 30, <strong>2010</strong> and 2009(All figures in thousands of U.S. dollars, except per share amounts)NOTE 3 – SIGNIFICANT ACCOUNTING POLICIES (continued)Financial Instruments (continued)The Company categorizes its financial assets and liabilities measured at fair value into one of three different levels depending onthe observability of the inputs used in the measurement.Level 1:Level 2:Level 3:This level includes assets and liabilities measured at fair value based on unadjusted quoted prices for identical assets andliabilities in active markets that are accessible at the measurement date.This level includes valuations determined using directly or indirectly observable inputs other than quoted pricesincluded within Level 1. Derivative instruments in this category are valued using models or other standard valuationtechniques derived from observable market inputs.This level includes valuations based on inputs which are less observable, unavailable or where the observable data doesnot support a significant portion of the instruments’ fair value.When the fair value of financial assets and financial liabilities recorded in the balance sheet cannot be derived from active markets,they are determined using valuation techniques including discounted cash flow models. The inputs to these models are taken fromobservable markets where possible, but where this is not feasible, a degree of judgment is required in establishing fair values. Thejudgments include considerations of inputs such as liquidity risk, credit risk and volatility. Changes in assumptions about thesefactors could affect the reported fair value of financial instruments.Derivative Financial Instruments and hedge accountingDerivative financial instruments are recorded as either assets or liabilities and are measured at their fair value unless exempted fromderivative treatment as a normal purchase or sale. Certain derivatives embedded in other contracts must also be separated fromthe main contract and measured at fair value. All changes in the fair value of derivatives are recognized in income unless specifichedge criteria are met, which requires that a company formally document, designate and assess the effectiveness of transactions thatreceive hedge accounting. Derivatives that qualify as hedging instruments must be designated as either a “cash flow hedge”, whenthe hedged item is a future cash flow, or a “fair value hedge”, when the hedged item is a recognized asset or liability. For derivativefinancial instruments designated as cash flow hedges, the effective portion of changes in their fair value is recognized in OtherComprehensive Income in the consolidated statement of comprehensive income. Any ineffectiveness within a cash flow hedgeis recognized in income as it arises in the same consolidated income (loss) statement account as the hedged item when realized.Should a cash flow hedging relationship become ineffective or the hedging relationship be terminated, previously unrealized gainsand losses remain within Accumulated Other Comprehensive Income until the hedged item is settled and future changes in valueof the derivative are recognized in income prospectively. When the hedged item settles, amounts recognized in Accumulated OtherComprehensive Income are reclassified to the same income (loss) statement account or reclassified to the related non-financialasset in which the hedged item is recorded. If the hedged item ceases to exist before the hedging instrument expires, the unrealizedgains or losses within Accumulated Other Comprehensive Income are immediately reclassified to income. For a fair value hedge,both the derivative and the hedged item are recorded at fair value in the consolidated balance sheet. The gains or losses from themeasurement of derivative hedging instruments at fair value are recorded in net income, while gains or losses on hedged itemsattributable to the hedged risks are accounted for as an adjustment to the carrying amount of hedged items and are recorded in netincome. Any derivative instrument that does not qualify for hedge accounting is marked-to-market at each reporting date and thegains or losses are included in income.48<strong>Dorel</strong> <strong>Industries</strong> Inc.
Notes to the Consolidated Financial StatementsFor the years ended December 30, <strong>2010</strong> and 2009(All figures in thousands of U.S. dollars, except per share amounts)NOTE 3 – SIGNIFICANT ACCOUNTING POLICIES (continued)Derivative Financial Instruments and hedge accounting (continued)Derivative financial instruments are utilized by the Company in the management of its foreign currency exposures and interest-ratemarket risks and are classified as held for trading unless they are designated as hedging instruments in an effective hedge for whichhedge accounting is applied. These derivative financial instruments are used as a method for meeting the risk reduction objectivesof the Company by generating offsetting cash flows related to the underlying position in respect of amount and timing of forecastedforeign currency cash flows and interest payments. The Company’s policy is not to utilize derivative financial instruments fortrading or speculative purposes. To meet its objective, the Company uses foreign exchange contracts, including futures, forwards,options and interest rate swap agreements.The Company uses interest rate swap agreements to lock-in a portion of its debt cost and reduce its exposure to the variability ofinterest rates by exchanging variable rate payments for fixed rate payments. The Company has designated its interest rate swaps ascash flow hedges for which it uses hedge accounting. The Company has also designated some foreign exchange contracts as cashflow hedges for which it uses hedge accounting.When it utilizes derivatives in hedge accounting relationships, the Company formally documents all of its eligible hedgingrelationships. This process involves associating all derivatives to specific assets and liabilities on the balance sheet or with forecastedor probable transactions. The Company also formally measures the effectiveness of hedging relationships at inception and on anon-going basis.Pension Plans and Post-Retirement BenefitsPension Plans:The Company maintains defined benefit plans and defined contribution plans for their employees. Pension benefit obligationsunder the defined benefit plans are determined annually by independent actuaries using management’s assumptions and theaccumulated benefit method for plans where future salary levels do not affect the amount of employee future benefits and theprojected benefit method for plans where future salaries or cost escalation affect the amount of employee future benefits. Theplans provide benefits based on a defined benefit amount and length of service. Management’s assumptions consist mainly of bestestimate of future salary levels, retirement age of employees, mortality and other actuarial factors.Plan assets are measured at fair value. Actuarial gains or losses arise from the differences between the actual and expectedlong-term rate of return on plan assets for a period or from changes in actuarial assumptions used to determine the accrued benefitobligation. The excess of the net accumulated actuarial gain or loss over 10 percent of the greater of the benefit obligation andthe fair value of plan assets is amortized over the expected average remaining service period. The average remaining service periodof active employees covered by all pension plans is 12 years. Prior service costs arising from plan amendments are deferred andamortized on a straight-line basis over the average remaining service period of employees active at the date of amendment. Whenthe restructuring of a benefit plan gives rise to both a curtailment and a settlement of obligations, the curtailment is accounted forprior to the settlement.Pension expense consists of the following:• the cost of pension benefits provided in exchange for employees’ services rendered in the period;• interest on the actuarial present value of accrued pension benefits less earnings on pension fund assets;<strong>Annual</strong> <strong>Report</strong> <strong>2010</strong> 49
Notes to the Consolidated Financial StatementsFor the years ended December 30, <strong>2010</strong> and 2009(All figures in thousands of U.S. dollars, except per share amounts)NOTE 3 – SIGNIFICANT ACCOUNTING POLICIES (continued)Pension Plans and Post-Retirement Benefits (continued)Pension Plans (continued):• amounts which represent the amortization of the unrecognized net pension assets that arose when accounting policies were firstapplied and prior service costs and amendments, and subsequent gains or losses arising from changes in actuarial assumptions,and experience gains or losses related to return on assets, amortized on a straight-line basis over the expected average remainingservice life of the employee group;• Gains or losses on settlements or curtailments.Post-Retirement Benefits Other Than Pensions:Post-retirement benefits other than pensions include health care and life insurance benefits for retired employees. The costs ofproviding these benefits are accrued over the working lives of employees in a manner similar to pension costs. Actuarial gains orlosses are treated in a similar manner to those relating to pension plans. The average remaining service period of employees coveredby the post-retirement benefit plan is 5 years.Significant elements in determining the assets or liabilities and related income or expense for these plans are the expected returnon plan assets, the discount rate used to value future payment streams, expected trends in health care costs, and other actuarialassumptions. <strong>Annual</strong>ly, the Company evaluates the significant assumptions to be used to value its pension and post-retirement planassets and liabilities based on current market conditions and expectations of future costs.Future Income TaxesIncome taxes expense comprises current and future income taxes. Current and future income taxes are recognized in income except tothe extent that it relates to a business combination or items recognized directly in equity or other comprehensive income.Current income taxes is the expected tax payable or receivable on the taxable income or loss for the year using enacted or substantivelyenacted income tax rates at the reporting date and any adjustment to tax payable or receivable of previous years.The Company follows the asset and liability method of accounting for income taxes. Under this method, future income taxes relateto the expected future tax consequences of differences between the carrying amount of balance sheet items and their correspondingtax values using the substantively enacted income tax rate, which will be in effect for the year in which the differences are expected toreverse. A valuation allowance is recorded to reduce the carrying amount of future income tax assets to the extent that, in the opinionof management, it is more likely than not that the future income tax assets will not be realized. The ultimate realization of future taxassets is dependent upon the generation of future taxable income and tax planning strategies. Future income tax assets and liabilitiesare adjusted for the effects of changes in tax laws and rates on the date of substantive enactment.Future tax assets and future tax liabilities are offset, if a legally enforceable right exists to set off current tax assets against currenttax liabilities and the deferred income taxes relate to the same taxable entity and the same taxation authority.The Company’s income tax provision is based on tax rules and regulations that are subject to interpretation and require estimatesand assumptions that may be challenged by taxation authorities. The Company’s estimates of income tax assets and liabilities areperiodically reviewed and adjusted as circumstances warrant, such as changes to tax laws and administrative guidance, and theresolution of uncertainties through either the conclusion of tax audits or expiration of prescribed time limits within the relevantstatutes. The final results of government tax audits and other events may vary materially compared to estimates and assumptionsused by management in determining the provision for income taxes and in valuing income tax assets and liabilities.50<strong>Dorel</strong> <strong>Industries</strong> Inc.
Notes to the Consolidated Financial StatementsFor the years ended December 30, <strong>2010</strong> and 2009(All figures in thousands of U.S. dollars, except per share amounts)NOTE 3 – SIGNIFICANT ACCOUNTING POLICIES (continued)Stock-Based Compensation and other stock-based paymentsA description of the stock-based compensation and other stock-based payments offered by the Company is included in Note 18to these financial statements.The Company recognizes as an expense, all stock options granted, modified or settled to its employees using the fair value basedmethod. Stock option awards to employees are measured based on the fair value of the options at the grant date and a compensationexpense is recognized over the vesting period of the options, with a corresponding increase to contributed surplus. The fair valueof these options is measured using a Black-Scholes option pricing model. When the stock options are exercised, capital stock iscredited by the sum of the consideration paid, together with the related portion previously recorded to contributed surplus.For the Deferred Share Unit Plan offered to its external directors, the Company records an expense with a corresponding increaseto contributed surplus when the units are granted which is the date the remuneration is to be paid. The amount corresponds to itsdirectors’ fees and fees for attending meeting of the Board of Directors or committees.For the Executive Deferred Share Unit Plan offered to its executive officers, the Company records an increase to contributedsurplus when the units are granted which is on the last business day of each month of the Company’s fiscal year in the case ofsalary and on the date on which the bonus is, or would otherwise be, paid to the participant in the case of bonus. The amountcorresponds to the portion of salary or bonus elected to be paid in the form of deferred share units.Product warrantiesA provision for warranty cost is recorded in cost of sales when the revenue for the related product is recognized. The cost is estimatedbased on a number of factors, including the historical warranty claims and cost experience, the type and duration of warranty, thenature of product sold and in service, counter-warranty coverage available from the Company’s suppliers and product recalls. TheCompany reviews periodically its recorded product warranty provisions and any adjustment is recorded in cost of sales.GuaranteesIn the normal course of business, the Company enters into various agreements that may contain features that meet the definitionof a guarantee. A guarantee is defined to be a contract that contingently requires the Company to make payments to a third partybased on (i) changes in an underlying interest rate, foreign exchange rate, index of prices or rates, or other variable, including theoccurrence or non-occurrence of a specified event (such as a scheduled payment under a contract), that is related to an asset, aliability or an equity security of the guaranteed party, (ii) failure of another party to perform under an obligating agreement, or(iii) failure of another party to pay its indebtedness when due. The stand-by portion of the guarantees is initially measured at fairvalue. The contingent portion of the guarantee is recorded when the Company considers it probable that a payment relating tothe guarantee has to be made to the other party of the contract or agreement. Subsequently, the liability is measured at the higherof the best estimate of the expenditure required to settle the present obligation at the reporting date and the amount recognizedless cumulative amortization.<strong>Annual</strong> <strong>Report</strong> <strong>2010</strong> 51
Notes to the Consolidated Financial StatementsFor the years ended December 30, <strong>2010</strong> and 2009(All figures in thousands of U.S. dollars, except per share amounts)NOTE 3 – SIGNIFICANT ACCOUNTING POLICIES (continued)Future Accounting ChangesInternational Financial <strong>Report</strong>ing Standards (IFRS)On February 13, 2008, the Accounting Standards Board of Canada confirmed the date of the changeover from Canadian GAAPto International Financial <strong>Report</strong>ing Standards. Canadian publicly accountable enterprises must adopt IFRS to their interimand annual financial statements relating to fiscal years beginning on or after January 1, 2011, with early adoption allowed. TheCompany has chosen to early adopt IFRS and is issuing its last financial statements prepared in accordance with CanadianGAAP for the year ended December 30, <strong>2010</strong>. Effective the first day of fiscal year 2011, the Company’s financial statements willbe prepared in accordance with IFRS, with comparative figures and an opening balance sheet restated to conform to IFRS, alongwith a reconciliation from Canadian GAAP to IFRS, as per guidance provided in IFRS 1, First-Time Adoption of International<strong>Report</strong>ing Standards.In preparation for the changeover to IFRS, the Company has developed an IFRS transition plan consisting of five phases: 1)Diagnostic Phase, 2) Design and Planning Phase, 3) Solution Development Phase, 4) Implementation Phase and, 5) PostImplementation Phase.The Company has completed the diagnostic phase, which involved developing an IFRS transition plan based on the results of ahigh-level preliminary assessment of the differences between IFRS and the Company’s current accounting policies. This assessmenthas provided insight into the most significant areas of potential impact to the Company including, but not limited to, property,plant and equipment, leases, goodwill and intangible assets, provisions, employee benefits, foreign exchange, income taxes andfinancial instruments.The Company has further completed the design and development phase. This included establishing a core project team with amandate to oversee the transition process, including any impacts on financial reporting, business processes, internal controls andinformation systems. Regular reporting is provided by the project team to senior management and to the Audit Committee of theBoard of Directors.The Company is now in the implementation phase. The Company has selected its accounting policy choices and IFRS 1exemptions. Impacts on business processes and systems, including those relating to internal controls over financial reporting anddisclosure controls and procedures, have been identified on related choices and exemptions.NOTE 4 – BUSINESS ACQUISITIONHot Wheels and Circle BikesOn October 1 st , 2009, the Company acquired certain assets of UK-based Hot Wheels and Circle Bikes for $15,574 (GBP 9,765),a UK preeminent distributor of the Mongoose and GT brands. As part of the acquisition agreement, additional consideration iscontingent upon a formulaic variable price based mainly on future earnings results of the acquired business up to the year endedDecember 30, 2012. The allocation of the cost of this purchase includes an estimate of the contingent consideration of $7,496 andthis estimate is recorded as a financial liability within other long-term liabilities.The acquisition has been recorded under the purchase method of accounting with the results of operations of the acquired businessbeing included in the accompanying consolidated financial statements since the date of acquisition. The goodwill is deductible for taxpurposes. The total goodwill amount is included in the Company’s Recreational/Leisure segment as reported in Note 27.52<strong>Dorel</strong> <strong>Industries</strong> Inc.
Notes to the Consolidated Financial StatementsFor the years ended December 30, <strong>2010</strong> and 2009(All figures in thousands of U.S. dollars, except per share amounts)NOTE 4 – BUSINESS ACQUISITION (continued)Hot Wheels and Circle Bikes (continued)The allocation of the purchase price of the assets acquired and the liabilities assumed is as follows:$AssetsCash and cash equivalents 290Accounts receivable 2,666Inventories 1,738Prepaid expenses 86Property, plant and equipment 155Trademarks 766Customer relationships 5,941Non-Compete agreement 694Goodwill 4,06316,399LiabilitiesAccounts payable and accrued liabilities 692Other long-term liabilities 133825Net assets acquired 15,574NOTE 5 – ACCOUNTS RECEIVABLEAccounts receivable consist of the following:December 30,<strong>2010</strong> 2009$ $Trade accounts receivable 408,163 394,735Allowance for anticipated credits (56,869) (53,298)Allowance for doubtful accounts (10,364) (13,554)340,930 327,883Foreign exchange contracts 2,554 1,411Other receivables 15,577 20,696359,061 349,990The Company’s exposure to credit and foreign exchange risks, and impairment losses related to accounts receivables, is disclosedin Note 14.<strong>Annual</strong> <strong>Report</strong> <strong>2010</strong> 53
Notes to the Consolidated Financial StatementsFor the years ended December 30, <strong>2010</strong> and 2009(All figures in thousands of U.S. dollars, except per share amounts)NOTE 6 – INVENTORIESInventories consist of the following:December 30,<strong>2010</strong> 2009$ $Raw materials 101,544 77,994Work in process 10,812 6,290Finished goods 397,712 315,582510,068 399,866During the year ended December 30, <strong>2010</strong>, the Company recorded in cost of sales $14,209 (2009 – $13,159) of write-downsof inventory as a result of net realizable value being lower than cost and no inventory write-downs recognized in previous years werereversed (2009 – $nil). The cost of inventories recognized as an expense and included in cost of sales for the year ended December30, <strong>2010</strong> was $1,706,517 (2009 – $1,545,281)NOTE 7 – PROPERTY, PLANT AND EQUIPMENTDecember 30, <strong>2010</strong>AccumulatedCost Depreciation Net$ $ $Land 11,599 — 11,599Buildings and improvements 73,574 17,424 56,150Machinery and equipment 76,688 47,867 28,821Moulds 104,237 80,251 23,986Furniture and fixtures 9,142 6,066 3,076Computer equipment 38,600 27,564 11,036Leasehold improvements 15,336 7,502 7,834Assets not in service 13,051 — 13,051Assets under capital leases 5,658 4,390 1,268Vehicles 2,709 1,665 1,044350,594 192,729 157,86554<strong>Dorel</strong> <strong>Industries</strong> Inc.
Notes to the Consolidated Financial StatementsFor the years ended December 30, <strong>2010</strong> and 2009(All figures in thousands of U.S. dollars, except per share amounts)NOTE 7 – PROPERTY, PLANT AND EQUIPMENT (continued)December 30, 2009AccumulatedCost Depreciation Net$ $ $Land 14,483 — 14,483Buildings and improvements 70,536 15,471 55,065Machinery and equipment 71,294 44,304 26,990Moulds 101,302 71,829 29,473Furniture and fixtures 8,003 5,731 2,272Computer equipment 35,360 23,633 11,727Leasehold improvements 9,962 6,409 3,553Assets not in service 7,888 — 7,888Assets under capital leases 5,427 4,210 1,217Vehicles 1,789 1,178 611326,044 172,765 153,279Assets not in service consist of the following major categories:December 30,<strong>2010</strong> 2009$ $Buildings and improvements 83 313Machinery and equipment 2,297 1,586Moulds 8,909 4,099Computer equipment 1,762 1,89013,051 7,888Depreciation of property, plant and equipment amounted to $27,722 (2009 – $28,585).NOTE 8 – INTANGIBLE ASSETSDecember 30, <strong>2010</strong>AccumulatedCost Amortization Net$ $ $Trademarks 276,236 — 276,236Customer relationships 101,310 24,206 77,104Supplier relationship 1,500 375 1,125Patents 25,969 16,065 9,904Non-compete agreement 679 212 467Software licence 1,977 242 1,735Deferred development costs 52,336 22,553 29,783460,007 63,653 396,354<strong>Annual</strong> <strong>Report</strong> <strong>2010</strong> 55
Notes to the Consolidated Financial StatementsFor the years ended December 30, <strong>2010</strong> and 2009(All figures in thousands of U.S. dollars, except per share amounts)NOTE 8 – INTANGIBLE ASSETS (continued)December 30, 2009AccumulatedCost Amortization Net$ $ $Trademarks 280,723 — 280,723Customer relationships 98,147 19,826 78,321Supplier relationship 1,500 225 1,275Patents 24,775 14,962 9,813Software licence 754 75 679Deferred development costs 50,062 19,042 31,020455,961 54,130 401,831The following table presents the aggregate amount of intangible assets that were acquired or internally developed during the period:December 30,<strong>2010</strong> 2009$ $Acquired 1,347 2,182Internally developed 16,545 16,56117,892 18,743Amortization of intangible assets was as follows:December 30,<strong>2010</strong> 2009$ $Customer relationships 5,098 4,883Supplier relationship 163 150Patents 1,502 1,556Non-Compete agreement 215 —Software licence 167 75Deferred development costs 16,224 13,94223,369 20,60656<strong>Dorel</strong> <strong>Industries</strong> Inc.
Notes to the Consolidated Financial StatementsFor the years ended December 30, <strong>2010</strong> and 2009(All figures in thousands of U.S. dollars, except per share amounts)NOTE 9 – OTHER ASSETSOther assets consist of the following:December 30,<strong>2010</strong> 2009$ $Accrued benefit asset (Note 16) 7,580 8,390Long-term future income tax assets (Note 24) 18,320 25,345Interest rate swaps — 1,476Costs relating to revolving credit facility (1) 1,622 51Assets held for sale — 46Other 593 57128,115 35,879(1) The amortization of financing costs related to the revolving credit facility included in interest on long-term debt expense is $289 (2009 – $214).NOTE 10 – BANK INDEBTEDNESSThe average interest rates on the outstanding borrowings as at December 30, <strong>2010</strong> and 2009 were 4.44% and 4.21% respectively. Asat December 30, <strong>2010</strong>, the Company had available bank lines of credit amounting to approximately $110,243 (2009 – $57,420) ofwhich $30,515 (2009 – $1,987) have been used. These borrowings are renegotiated annually.NOTE 11 – ACCOUNTS PAYABLE AND ACCRUED LIABILITIESDecember 30,<strong>2010</strong> 2009$ $Trade creditors and accruals 276,975 248,850Salaries payable 34,287 31,398Product liability (Note 22) 23,621 25,480Product warranties 14,910 15,579Foreign exchange contracts 3,298 395Interest rate swaps 906 790Balance of sale — 220Other accrued liabilities 16,225 16,582370,222 339,294The Company’s exposure to credit and foreign exchange risks is disclosed in Note 14.<strong>Annual</strong> <strong>Report</strong> <strong>2010</strong> 57
Notes to the Consolidated Financial StatementsFor the years ended December 30, <strong>2010</strong> and 2009(All figures in thousands of U.S. dollars, except per share amounts)NOTE 12 – LONG-TERM DEBTDecember 30,<strong>2010</strong> 2009$ $ReclassifiedSeries “A” Senior Guaranteed Notes (1)Bearing interest at 4.24% per annum to be repaid on April 6, 2015 50,000 —Series “B” Senior Guaranteed Notes (1)Bearing interest at 5.14% per annum with principal repayments as follows: 150,000 —2 annual instalments of $13,000 ending in April 20141 annual instalment of $7,500 ending in April 20155 annual instalments of $23,300 ending in April 2020Series “A” Senior Guaranteed Notes (1)Bearing interest at 6.80 % per annum with principal repayments as follows: 26,500 36,5001 annual instalment of $10,000 ending in July 20111 final instalment of $16,500 in July 2012Series “B” Senior Guaranteed Notes (1)Bearing interest at 5.63% per annum repaid in February <strong>2010</strong> — 55,000Revolving Bank Loans (3)Bearing interest at various rates per annum, averaging 2.35% (2009 – 2.2%)based on LIBOR, Euribor or U.S. bank rates, total availability of $300,000(2009 – $475,000) due to mature in July 2013. This agreement also includesan accordion feature allowing the company to have access to an additionalamount of $200,000 (2009 – $50,000) on a revolving basis. 102,712 257,000Obligations under capital leases 1,379 1,155Less unamortized financing costs (2) (643) (72)329,948 349,583Current Portion (10,667) (122,508)319,281 227,075(1)Interest and principal payments are guaranteed by certain subsidiaries.(2) The amortization of financing costs related to the long-term debt included in interest on long-term debt expense is $35 (2009 – $52).(3) Subsequent to December 30, 2009, effective April 6, <strong>2010</strong>, the Company issued $50,000 of Series “A” Senior Guaranteed Notes and $150,000 of Series “B” SeniorGuaranteed Notes, bearing interest at 4.24% and 5.14%, respectively. As a result of the issuance of the Senior Guaranteed Notes for an aggregate of $200,000,the Company reclassified as at December 30, 2009 $200,000 from the current portion of long-term debt to long-term debt.58<strong>Dorel</strong> <strong>Industries</strong> Inc.
Notes to the Consolidated Financial StatementsFor the years ended December 30, <strong>2010</strong> and 2009(All figures in thousands of U.S. dollars, except per share amounts)NOTE 12 – LONG-TERM DEBT (continued)The aggregate repayments in subsequent years of existing long-term debt will be:Fiscal Year EndingAmount$2011 10,6672012 16,9712013 115,8072014 12,9762015 57,458Thereafter 116,069329,948NOTE 13 – OTHER LONG-TERM LIABILITIESDecember 30,<strong>2010</strong> 2009$ $Employee compensation 4,304 4,725Interest rate swaps 550 —Contingent considerations (Notes 4 and 27) 28,002 18,895Other 3,143 1,51935,999 25,139Employee compensation consists of bonuses based on length of service and profit sharing offered by one of the Company’s subsidiaries.Contingent consideration, resulting from business combinations, is valued at fair value at the acquisition date as part of thebusiness combination. Where the contingent consideration meets the definition of a derivative and thus financial liability, it issubsequently re-measured to fair value at each reporting date. The determination of the fair value is based on discounted cash flows.The key assumptions take into consideration the probability of meeting performance target and the discount factor.IGC (Australia) Pty LtdAs part of the acquisition, the Company entered into a put and call agreement with the minority interest holder for the purchase ofits 45% stake in IGC. Under the terms of this agreement, if specified earnings objectives were not met at the end of 2008 and at theend of each subsequent year until the option is exercised, <strong>Dorel</strong> has an option to buy this 45% minority interest (the call option) ata formulaic variable price based mainly on earnings levels in future periods (the “exit price”). Similarly, the holder of the minorityinterest has an option to sell his 45% stake in IGC to <strong>Dorel</strong> (the put option) for the same variable exit price if a certain earnings targetwas reached in 2008 or at the end of any subsequent year until the option is exercised. In addition, following December 31, 2012,the minority interest holder has the right to sell its 45% stake in IGC to <strong>Dorel</strong> at any time for the same terms. The agreement doesnot include a specified minimum amount of contingent consideration. Under the liability method of accounting, the put and callagreement is reflected in the consolidated financial statements as follows:(i)The put and call agreement is considered to have been fully executed at the time of acquisition, resulting in the purchase by<strong>Dorel</strong> of a further 45% interest in IGC. As a result, <strong>Dorel</strong> has consolidated 100% of IGC at the inception of this agreement.<strong>Annual</strong> <strong>Report</strong> <strong>2010</strong> 59
Notes to the Consolidated Financial StatementsFor the years ended December 30, <strong>2010</strong> and 2009(All figures in thousands of U.S. dollars, except per share amounts)NOTE 13 – OTHER LONG-TERM LIABILITIES (continued)IGC (Australia) Pty Ltd (continued)(ii) When the contingency is re-valued until the put or call option is exercised, the value of the exit price is determined andrecorded as a financial liability and changes in fair value are recognized as an additional element of the purchase price whichimpacts goodwill. The financial liability amounts to $11,609 as at December 30, <strong>2010</strong> (2009 – $12,715) and is presented inother long-term liabilities and an amount of $4,024 has been recorded as a reduction in goodwill (2009 – $11,464) whichhas been reflected in Note 27 of these financial statements.Hot Wheels and Circle BikesAs part of the acquisition agreement, additional consideration is contingent upon a formulaic variable price based mainly onfuture earnings results of the acquired business up to the year ended December 30, 2012. The allocation of the cost of this purchaseincluded an estimate of the contingent consideration of $7,496 (Note 4) and this estimate is recorded as a financial liabilitywithin other long-term liabilities. For each subsequent year until the contingent consideration is resolved, the changes in fairvalue are recognized as an additional element of the purchase price which impact goodwill. The financial liability amounts to$7,060 as at December 30, <strong>2010</strong> (2009 – $2,572) and an amount of $4,104 has been recorded as an increase in goodwill(2009 – $2,572) which has been reflected in Note 27 of these financial statements.Companhia <strong>Dorel</strong> Brasil Porductos Infantis (<strong>Dorel</strong> Brazil)As part of the shareholder agreement, the Company entered into a put and call agreement with the minority interest holder for thepurchase of its 30% stake in <strong>Dorel</strong> Brazil. Under the terms of this agreement, if specified earnings objectives were not met at theend of <strong>2010</strong> and at the end of each subsequent year until the option is exercised, <strong>Dorel</strong> has an option to buy this 30% minorityinterest (the call option) at a formulaic variable price based mainly on earnings levels in future periods (the “exit price”). Similarly,the holder of the minority interest has an option to sell his 30% stake in <strong>Dorel</strong> Brazil following the fiscal year ending in 2013(the put option) for the same variable exit price. The agreement does not include a specified minimum amount of contingentconsideration. Under the liability method of accounting, the put and call agreement is reflected in the consolidated financialstatements as follows:(i)The put and call agreement is considered to have been fully executed at the time the shareholders’ agreement was put inplace, resulting in the purchase by <strong>Dorel</strong> of a further 30% interest in <strong>Dorel</strong> Brazil. As a result, <strong>Dorel</strong> has consolidated 100%of <strong>Dorel</strong> Brazil at the inception of this agreement.(ii) When the contingency is re-valued until the put or call option is exercised, the value of the exit price is determined andrecorded as a financial liability and changes in fair value are recognized as an adjustment to goodwill. The financial liabilityamounts to $9,333 as at December 30, <strong>2010</strong> (2009 – $3,608) and is presented in other long-term liabilities and an amountof $4,144 has been recorded as an increase in goodwill (2009 – $2,119) which has been reflected in Note 27 of these financialstatements.The Company’s exposure to credit and interest rate risks related to other long-term liabilities is disclosed in Note 14. Refer toNote 27 for the continuity of goodwill by industry segment.60<strong>Dorel</strong> <strong>Industries</strong> Inc.
Notes to the Consolidated Financial StatementsFor the years ended December 30, <strong>2010</strong> and 2009(All figures in thousands of U.S. dollars, except per share amounts)NOTE 14 – FINANCIAL INSTRUMENTSFinancial instruments – carrying values and fair valuesThe fair value of financial assets and liabilities, together with the carrying amounts included in the consolidated balance sheet, areas follows:December 30, <strong>2010</strong> December 30, 2009Carrying amount Fair value Carrying amount Fair value$ $ $ $Financial assetsHeld for trading financial assets:Cash and cash equivalents 15,748 15,748 19,847 19,847Foreign exchange contracts included inaccounts receivable — — 533 533Loans and receivables:Accounts receivable – trade 340,930 340,930 327,883 327,883Accounts receivable – other 15,577 15,577 20,696 20,696Derivatives designated as cash flow hedges:Interest rate swaps included in other assets — — 1,476 1,476Foreign exchange contracts includedin accounts receivable 2,554 2,554 878 878Financial liabilitiesHeld for trading financial liabilities:Foreign exchange contracts included inaccounts payable and accrued liabilities — — 395 395Other liabilities:Bank indebtedness 30,515 30,515 1,987 1,987Accounts payable and accrued liabilities 366,018 366,018 337,889 337,889Long-term debt – bearing interest at variable rates:Revolving Bank Loans 102,712 102,712 257,000 257,000Long-term debt – bearing interest at fixed rates 227,236 227,480 92,583 95,536Other long-term liabilities 35,449 35,449 25,139 25,139Balance of sale payable — — 220 220Derivatives designated as cash flow hedges:Foreign exchange contracts included inaccounts payable and accrued liabilities 3,298 3,298 — —Interest rate swaps included inaccounts payable and accrued liabilities 906 906 790 790Interest rate swaps included inother long-term liabilities 550 550 — —<strong>Annual</strong> <strong>Report</strong> <strong>2010</strong> 61
Notes to the Consolidated Financial StatementsFor the years ended December 30, <strong>2010</strong> and 2009(All figures in thousands of U.S. dollars, except per share amounts)NOTE 14 – FINANCIAL INSTRUMENTS (continued)Financial instruments – carrying values and fair values (continued)The Company has determined that the fair value of its short-term financial assets and liabilities approximates their respectivecarrying amounts as at the balance sheet dates because of the short-term nature of those financial instruments. For long-termdebt bearing interest at variable rates, the fair value is considered to approximate the carrying amount. For long-term debtbearing interest at fixed rates, the fair value is estimated based on discounting expected future cash flows at the discount rateswhich represent borrowing rates presently available to the Company for loans with similar terms and maturity. As atDecember 30, <strong>2010</strong> and 2009, the fair value of the other long-term liabilities are comparable to their carrying value since themajority of the amount is recorded based on discounted future cash outflows. The fair value of cash and cash equivalents wasmeasured using Level 2 inputs in the fair value hierarchy. The fair value of the foreign exchange contracts and the interest rateswaps were measured using Level 2 inputs in the fair value hierarchy.The fair value of foreign exchange contracts is measured using a generally accepted valuation technique which is the discountedvalue of the difference between the contract’s value at maturity based on the foreign exchange rate set out in the contract and thecontract’s value at maturity based on the foreign exchange rate that the counterparty would use if it were to renegotiate the samecontract at today’s date under the same conditions. The Company’s or the counterparty’s credit risk is also taken into considerationin determining fair value.The fair value of interest rate swaps is measured using a generally accepted valuation technique which is the discounted value ofthe difference between the value of the swap based on variable interest rates (estimated using the yield curve for anticipated interestrates) and the value of the swap based on the swap’s fixed interest rate. The counterparty’s credit risk is also taken into considerationin determining fair value.Foreign exchange gains (losses)December 30,<strong>2010</strong> 2009$ $Gains (losses) relating to financial assets and liabilities,excluding foreign exchange contracts (5,339) 5,377Gains (losses) relating to foreign exchange contracts, includingamounts realized on contract maturity and changes in fair value of openpositions for the foreign exchange contracts for which the Companydoes not apply hedge accounting 3,325 (5,154)Foreign exchange gains (losses) relating to financial instruments (2,014) 223Other foreign exchange gains (losses) 55 (76)Foreign exchange gains (losses) recognized in net income (1,959) 147Management of risks arising from financial instrumentsIn the normal course of business, the Company is subject to various risks relating to foreign exchange, interest rate, credit andliquidity. The Company manages these risk exposures on an ongoing basis. In order to limit the effects of changes in foreignexchange rates on its revenues, expenses and its cash flows, the Company can avail itself of various derivative financial instruments.The Company’s management is responsible for determining the acceptable level of risk and only uses derivative financial instrumentsto manage existing or anticipated risks, commitments or obligations based on its past experience. The following analysis providesa measurement of risks.62<strong>Dorel</strong> <strong>Industries</strong> Inc.
Notes to the Consolidated Financial StatementsFor the years ended December 30, <strong>2010</strong> and 2009(All figures in thousands of U.S. dollars, except per share amounts)NOTE 14 – FINANCIAL INSTRUMENTS (continued)Foreign Exchange RiskIn order to mitigate the foreign exchange risks, the Company uses from time to time various derivative financial instruments suchas options, futures and forward contracts to hedge against adverse fluctuations in currency rates. The Company’s main source offoreign exchange rate risk resides in sales and purchases of goods denominated in currencies other than the functional currencyof each of <strong>Dorel</strong>’s entities. For the Company’s transactions denominated in currencies other than the functional currency of eachof <strong>Dorel</strong>’s entities, fluctuations in the respective exchange rates relative to the functional currency of each of <strong>Dorel</strong>’s entities willcreate volatility in the Company’s cash flows and in the reported amounts in its consolidated statement of income. The Company’sfinancial debt mainly consists of notes issued in U.S. dollars, for which no foreign currency hedging is required. Short-term linesof credit and overdrafts commonly used by <strong>Dorel</strong>’s entities are in the currency of the borrowing entity and therefore carry noexchange-rate risk. Inter-company loans/borrowings are economically hedged as appropriate, whenever they present a net exposureto exchange-rate risk. Additional earnings variability arises from the translation of monetary assets and liabilities denominated incurrencies other than the functional currency of each of <strong>Dorel</strong>’s entities at the rates of exchange at each balance sheet date, theimpact of which is reported as a foreign exchange gain and loss in the statement of income.Derivative financial instruments are used as a method for meeting the risk reduction objectives of the Company by generatingoffsetting cash flows related to the underlying position with respect to the amount and timing of forecasted transactions. Theterms of the currency derivatives ranges from one to twelve months. <strong>Dorel</strong> does not hold or use derivative financial instrumentsfor trading or speculative purposes.The following tables provide an indication of the Company’s significant foreign currency exposures during the years endedDecember 30, <strong>2010</strong> and 2009, including the period end balances of financial and monetary assets and liabilities denominated incurrencies other than the functional currency of each of <strong>Dorel</strong>’s entities, as well as the amount of revenue and operating expensesduring the period that were denominated in foreign currencies other than the functional currency of each of <strong>Dorel</strong>’s entities. Thetables below do not consider the effect of foreign exchange contracts.December 30, <strong>2010</strong>US CAD Euro GBP AUD$ $ $ $ $Cash and cash equivalents 375 468 362 1,375 —Accounts receivable 823 27,857 2,189 347 2,625Accounts payable and accrued liabilities (27,850) (16,283) (7,122) (6) (142)Inter-company loans 2,943 27 (468) — 11,776Balance sheet exposure excludingfinancial derivatives (23,709) 12,069 (5,039) 1,716 14,259December 30, 2009US CAD Euro GBP AUD$ $ $ $ $Cash and cash equivalents 887 1,016 253 — —Accounts receivable 1,909 20,471 1,748 2,450 4,369Accounts payable and accrued liabilities (29,917) (18,138) (6,460) (400) —Inter-company loans — — — — 8,817Balance sheet exposure excludingfinancial derivatives (27,121) 3,349 (4,459) 2,050 13,186<strong>Annual</strong> <strong>Report</strong> <strong>2010</strong> 63
Notes to the Consolidated Financial StatementsFor the years ended December 30, <strong>2010</strong> and 2009(All figures in thousands of U.S. dollars, except per share amounts)NOTE 14 – FINANCIAL INSTRUMENTS (continued)Foreign Exchange Risk (continued)December 30, <strong>2010</strong>US CAD Euro GBP AUD$ $ $ $ $Revenue 11,541 126,413 13,322 2,206 1,759Expenses 232,111 130,144 38,891 75 823Net exposure (220,570) (3,731) (25,569) 2,131 936December 30, 2009US CAD Euro GBP AUD$ $ $ $ $Revenue 9,610 105,507 12,346 11,567 6,349Expenses 179,016 111,888 15,242 459 800Net exposure (169,406) (6,381) (2,896) 11,108 5,549The following table summarizes the Company’s derivative financial instruments relating to commitments to buy and sell foreigncurrencies through options, futures and forward foreign exchange contracts as at December 30, <strong>2010</strong> and,2009:December 30, <strong>2010</strong> December 30, 2009Foreign exchange contracts Average Notional Fair Average Notional FairCurrencies (sold/bought) rate amount value rate amount value(1) (2) (1) (2)FuturesUS/CAD 0.9440 5,000 302 0.9375 15,000 275ForwardsEUR/US 0.7581 110,360 (1,578) 0.6806 30,400 1,122GBP/US 0.6244 10,250 282 0.6131 2,500 25GBP/EUR 0.8485 20,086 250 — — —NZD/AUD — — — 0.5174 34 (13)OptionsEUR/US — — — 0.7134 13,300 (393)Total (744) 1,016(1)Rates are expressed as the number of units of the currency sold for one unit of currency bought.(2)Exchange rates as at December 30, <strong>2010</strong> and 2009 were used to translate amounts in foreign currencies.64<strong>Dorel</strong> <strong>Industries</strong> Inc.
Notes to the Consolidated Financial StatementsFor the years ended December 30, <strong>2010</strong> and 2009(All figures in thousands of U.S. dollars, except per share amounts)NOTE 14 – FINANCIAL INSTRUMENTS (continued)Foreign Exchange Risk (continued)The following outlines the main exchange rates applied:<strong>2010</strong> <strong>Report</strong>ingYear-to-datedate rateaverage rate December 30, <strong>2010</strong>CAD TO USD 0.9708 1.0054EURO TO USD 1.3247 1.3390GBP TO USD 1.5451 1.5598AUD TO USD 0.9179 1.02352009 <strong>Report</strong>ingYear-to-datedate rateaverage rate December 30, 2009CAD TO USD 0.8760 0.9555EURO TO USD 1.3895 1.4333GBP TO USD 1.5593 1.6166AUD TO USD 0.7804 0.8977Based on the Company’s foreign currency exposures noted above and the foreign exchange contracts in effect in <strong>2010</strong> and 2009,varying the above foreign exchange rates to reflect a 5 percent weakening of the currencies, other than the functional currencyof each of <strong>Dorel</strong>’s entities, would have the following effects during the years ended December 30, <strong>2010</strong> and 2009, as follows,assuming that all other variables remained constant:December 30, <strong>2010</strong>Source of variability from changes in US CAD Euro GBP AUDforeign exchange rates $ $ $ $ $Financial instruments, includingforeign exchange contracts 1,159 635 309 95 758Revenues and expenses 11,196 (164) 2,555 (112) 122Increase(decrease) on pre-tax income 12,355 471 2,864 (17) 880(Decrease) increase on othercomprehensive income (4,268) (176) (720) — —<strong>Annual</strong> <strong>Report</strong> <strong>2010</strong> 65
Notes to the Consolidated Financial StatementsFor the years ended December 30, <strong>2010</strong> and 2009(All figures in thousands of U.S. dollars, except per share amounts)NOTE 14 – FINANCIAL INSTRUMENTS (continued)Foreign Exchange Risk (continued)December 30, 2009Source of variability from changes in US CAD Euro GBP AUDforeign exchange rates $ $ $ $ $Financial instruments, includingforeign exchange contracts 320 (184) 224 (103) 222Revenues and expenses 8,548 285 236 (561) (323)Increase (decrease) on pre-tax income 8,868 101 460 (664) (101)(Decrease) increase on othercomprehensive income (593) (511) — — —An assumed 5 percent strengthening of the currencies, other than the functional currency of each of <strong>Dorel</strong>’s entities, during theyears ended December 30, <strong>2010</strong> and 2009, would have the following effects assuming that all other variables remained constant:December 30, <strong>2010</strong>Source of variability from changes in US CAD Euro GBP AUDforeign exchange rates $ $ $ $ $Financial instruments, includingforeign exchange contracts (1,159) (635) (309) (95) (758)Revenues and expenses (11,196) 164 (2,555) 112 (122)(Decrease) increase on pre-tax income (12,355) (471) (2,864) 17 (880)Increase (decrease) on othercomprehensive income 4,268 176 720 — —December 30, 2009Source of variability from changes in US CAD Euro GBP AUDforeign exchange rates $ $ $ $ $Financial instruments, includingforeign exchange contracts (399) 184 (224) 103 (222)Revenues and expenses (8,548) (285) (236) 561 323(Decrease) increase on pre-tax income (8,947) (101) (460) 664 101Increase (decrease) on othercomprehensive income 579 538 — — —66<strong>Dorel</strong> <strong>Industries</strong> Inc.
Notes to the Consolidated Financial StatementsFor the years ended December 30, <strong>2010</strong> and 2009(All figures in thousands of U.S. dollars, except per share amounts)NOTE 14 – FINANCIAL INSTRUMENTS (continued)Interest Rate RiskThe Company is exposed to interest rate fluctuations, related primarily to its revolving long-term bank loans, for which amountsdrawn are subject to LIBOR, Euribor or U.S. bank rates in effect at the time of borrowing, plus a margin. The Company managesits interest rate exposure and enters into swap agreements consisting in exchanging variable rates for fixed rates for an extendedperiod of time. All other long-term debts have fixed interest rates and are therefore not exposed to cash flow interest rate risk.The Company decided to use interest rate swap agreements to lock-in a portion of its debt cost and reduce its exposure to thevariability of interest rates by exchanging variable rate payments for fixed rate payments. The Company has designated its interestrate swaps as cash flow hedges for which it uses hedge accounting.The maturity analysis associated with the interest rate swap agreements used to manage interest risk associated with long-term debtis as follows:December 30, <strong>2010</strong>Fixed Rate (Percentage) Notional amount Maturity Fair valueInterest rate swap agreements 2.21 50,000 March 23, 2014 (1,456)December 30, 2009Fixed Rate (Percentage) Notional amount Maturity Fair valueInterest rate swap agreements 2.21 50,000 March 23, 2014 686The fair value as at December 30, <strong>2010</strong> and 2009 of the derivatives designated as cash flow hedges are as follows:<strong>2010</strong> 2009$ $Derivatives designated as cash flow hedges:Interest rate swaps included in other assets — 1,476Interest rate swaps included in accounts payable and accrued liabilities (906) (790)Interest rate swaps included in other long-term liabilities (550) —(1,456) 686Based on the currently outstanding interest-bearing revolving long-term bank loans and interest rate swaps as at December 30, <strong>2010</strong>and 2009, if interest rates had changed by 50 basis points, assuming that all other variables had remained the same, the impactwould have the following effects:<strong>2010</strong> 20090.5% increase 0.5% decrease 0.5% increase 0.5% decrease$ $ $ $Increase (decrease) on pre-tax income (514) 514 (1,285) 1,285Increase (decrease) on othercomprehensive income 276 (283) (356) 343<strong>Annual</strong> <strong>Report</strong> <strong>2010</strong> 67
Notes to the Consolidated Financial StatementsFor the years ended December 30, <strong>2010</strong> and 2009(All figures in thousands of U.S. dollars, except per share amounts)NOTE 14 – FINANCIAL INSTRUMENTS (continued)Credit RiskCredit risk stems primarily from the potential inability of clients or counterparties to discharge their obligations and arises primarilyfrom the Company’s trade accounts receivable. The Company may also have credit risk relating to cash and cash equivalents,foreign exchange contracts and interest rate swaps resulting from defaults by counterparties. The Company enters into financialinstruments with a variety of creditworthy parties. When entering into foreign exchange contracts and interest rate swaps, thecounterparties are large Canadian and International banks. Therefore, the Company does not expect to incur material credit lossesdue to its risk management on other financial instruments other than accounts receivable.The maximum credit risk to which the Company is exposed as at December 30, <strong>2010</strong> and 2009, represents the carrying value ofcash equivalents and accounts receivable as well as the fair value of foreign exchange contracts and interest rate swaps with positivefair values.Substantially all trade accounts receivable arise from sales to the retail industry. The Company performs ongoing credit evaluationsof its customers’ financial condition and limits the amount of credit extended when deemed necessary. In addition, a portion of thetotal accounts receivable is insured against possible losses. In <strong>2010</strong>, sales to a major customer represented 31.0% of total revenue(2009 – 31.4%). As at December 30, <strong>2010</strong>, one customer accounted for 13.7% of the Company’s total trade accounts receivablebalance (2009 – 17.9%).The Company establishes an allowance for doubtful accounts on a customer-by-customer basis. It is based on the evaluation of thecollectability of accounts receivable at each balance sheet reporting date, taking into account amounts which are past due, specificcredit risk, historical trends and any available information indicating that a customer could be experiencing liquidity or goingconcern problems. Bad debt expense is included within the selling, general and administrative expenses.The Company’s exposure to credit risk for trade accounts receivable by geographic area and type of customer was as follows:December 30, <strong>2010</strong> December 30, 2009$ $Canada 31,667 28,618United States 161,029 158,502Europe 123,815 119,815Other foreign countries 24,419 20,948340,930 327,883The allocation of accounts receivable to each geographic area is based on the location of selling entity.December 30, <strong>2010</strong> December 30, 2009$ $Mass-market retailers 148,388 148,460Specialty/independent stores 192,542 179,423340,930 327,88368<strong>Dorel</strong> <strong>Industries</strong> Inc.
Notes to the Consolidated Financial StatementsFor the years ended December 30, <strong>2010</strong> and 2009(All figures in thousands of U.S. dollars, except per share amounts)NOTE 14 – FINANCIAL INSTRUMENTS (continued)Credit Risk (continued)Pursuant to their respective terms, trade accounts receivable are aged as follows:December 30, <strong>2010</strong> December 30, 2009$ $Not past due 252,873 247,567Past due 0-30 days 58,495 54,128Past due 31-60 days 15,338 9,858Past due 61-90 days 9,292 11,470Past due over 90 days 15,296 18,414Trade accounts receivable 351,294 341,437Less allowance for doubtful accounts (10,364) (13,554)340,930 327,883Based on past experience, the Company believes that no allowance is necessary in respect of trade receivables not past due and pastdue 0-30 days; 88.6% of these balances (2009 – 88.4%), which includes the amounts owed by the Company’s most significantcustomers, relates to customers that have a good track record with the Company.The movement in the allowance for doubtful accounts with respect to trade accounts receivable was as follows:December 30, <strong>2010</strong> December 30, 2009$ $Balance at beginning of year 13,554 11,305Bad debt expense 2,049 4,758Uncollectible accounts written-off, net of recovery (5,012) (2,721)Increase due to acquisitions (Note 4) — 39Effect of foreign currency exchange rate changes (227) 173Balance at end of year 10,364 13,554Liquidity RiskLiquidity risk is the risk of being unable to honor financial commitments by the deadlines set out under the terms of suchcommitments. The Company manages liquidity risk through the management of its capital structure and financial leverage, asoutlined in “Capital Risk Management” (Note 15). It also manages liquidity risk by continuously monitoring actual and projectedcash flows matching the maturity profile of financial assets and liabilities. The Board of Directors reviews and approves theCompany’s operating and capital budgets, as well as any material transactions not in the ordinary course of business, includingacquisitions or other major investments or divestitures.The Company has committed revolving bank loans for a maximum of $300,000 due to mature in July 2013 which provide foran annual one-year extension. This agreement also includes an accordion feature allowing the Company to have access to anadditional amount of $200,000 on a revolving basis. The revolving bank loans bear interest at LIBOR, Euribor or U.S. bank ratesplus a margin and the effective interest rate for the year ended December 30, <strong>2010</strong>, was 2.35% (2009 – 2.2%). Managementbelieves that future cash flows from operations and availability under existing/renegotiated banking arrangements will be adequateto support the Company’s financial liabilities.<strong>Annual</strong> <strong>Report</strong> <strong>2010</strong> 69
Notes to the Consolidated Financial StatementsFor the years ended December 30, <strong>2010</strong> and 2009(All figures in thousands of U.S. dollars, except per share amounts)NOTE 14 – FINANCIAL INSTRUMENTS (continued)Liquidity Risk (continued)The following table summarizes the contractual maturities of financial liabilities of the Company as of December 30, <strong>2010</strong>,excluding future interest payments but including accrued interest:Total Less than 1 year 1-3 years 4-5 years After 5 years$ $ $ $ $Bank indebtedness 30,515 30,515 — — —Long-term debt –revolving bank loans 102,712 — 102,712 — —Other long-term debt 227,236 10,667 30,066 70,434 116,069Accounts payable and accrued liabilities 366,018 366,018 — — —Foreign exchange contracts 3,298 3,298 — — —Interest rate swaps 1,456 906 622 (72) —Other long term liabilities 35,449 — 28,002 7,447 —Total 766,684 411,404 161,402 77,809 116,069The Company’s only derivative financial liabilities as at December 30, <strong>2010</strong> were foreign exchange contracts and interest rateswaps, for which notional amounts, maturities, average exchange rates and the carrying and fair values are disclosed under “ForeignExchange Risk” and “Interest Rate Risk”.NOTE 15 – CAPITAL RISK MANAGEMENTThe Company’s objectives in managing capital is to provide sufficient liquidity to support its operations while generating areasonable return to shareholders, give the flexibility to take advantage of growth and development opportunities of the business andundertake selective acquisitions, while at the same time taking a conservative approach towards financial leverage and managementof financial risk. The Company’s capital is composed of net debt and shareholders’ equity. Net debt consists of interest-bearingdebt less cash and cash equivalents.The Company manages its capital structure in light of changes in economic conditions. In order to maintain or adjust the capitalstructure, the Company may elect to adjust the amount of dividends paid to shareholders, return capital to its shareholders, issuenew shares or increase/decrease net debt.70<strong>Dorel</strong> <strong>Industries</strong> Inc.
Notes to the Consolidated Financial StatementsFor the years ended December 30, <strong>2010</strong> and 2009(All figures in thousands of U.S. dollars, except per share amounts)NOTE 15 – CAPITAL RISK MANAGEMENT (continued)The Company monitors its capital structure using the ratio of indebtedness to adjusted earnings before interest, taxes, depreciationand amortization, share-based compensation, restructuring costs and extraordinary or unusual items (“adjusted EBITDA”), whichit aims to maintain at less than 3.0:1. The terms of the unsecured notes and the revolving credit facility permit the Company toexceed this limit under certain circumstances. This ratio is calculated as follows: indebtedness/ adjusted EBITDA. Indebtedness isequal to the aggregate of bank indebtedness, long-term debt (including obligations under capital leases), guarantees (including allletters of credit and standby letters of credit), contingent considerations and balance of sales. Adjusted EBITDA is based on the lastfour quarters ending on the same date as the balance sheet date used to compute the indebtedness. The indebtedness to adjustedEBITDA as at December 30, <strong>2010</strong> and 2009 were as follows:December 30,<strong>2010</strong> 2009$ $Bank indebtedness 30,515 1,987Current portion of long-term debt 10,667 122,508Long-term debt 319,281 227,075Guarantees 12,386 17,248Contingent considerations (Note 13) 28,002 18,895Balance of sale payable — 220Indebtedness 400,851 387,933For the trailing four quarters endedDecember 30, (1)<strong>2010</strong> 2009$ $Net income 127,853 108,233Interest, net 18,927 16,390Income taxes expense 12,865 21,145Depreciation and amortization 51,091 49,238Share-based compensation 4,074 3,480Restructuring costs — 135Adjusted EBITDA 214,810 198,621Indebtedness to adjusted EBITDA ratio 1.87:1 1.95:1(1)Includes retroactively the results of the operations of the acquired businesses.There were no changes in the Company’s approach to capital management during the periods. Under the unsecured notes andrevolving credit facility, the Company is subject to certain covenants, including maintaining certain financial ratios. During theyears ended December 30, <strong>2010</strong> and 2009, the Company was in compliance with these covenants.<strong>Annual</strong> <strong>Report</strong> <strong>2010</strong> 71
Notes to the Consolidated Financial StatementsFor the years ended December 30, <strong>2010</strong> and 2009(All figures in thousands of U.S. dollars, except per share amounts)NOTE 16 – PENSION & POST RETIREMENT BENEFIT PLANSPension BenefitsThe Company’s subsidiaries maintain defined benefit plans and defined contribution plans for their employees. Pension benefitobligations under the defined benefit plans are determined annually by independent actuaries using management’s assumptionsand the accumulated benefit method for the plan where future salary levels do not affect the amount of employee future benefitsand the projected benefit method for plans where future salaries or cost escalation affect the amount of employee future benefits.Information regarding the Company’s defined benefit pension plans is as follows:December 30,<strong>2010</strong> 2009$ $Accrued benefit obligations:Balance, beginning of year 43,347 39,182Current service cost 1,592 1,281Interest cost 2,478 2,355Acquisitions — 283Restructuring giving rise to curtailments (12) —Participant contributions 334 401Benefits paid (1,927) (1,649)Effect of exchange rates (859) 193Actuarial (gain) / loss 3,964 1,301Balance, end of year 48,917 43,347Plan assetsFair value, beginning of year 28,208 23,648Actual return on plan assets 3,649 2,744Employer contributions 1,878 3,313Participant contributions 334 401Benefits paid (1,927) (1,649)Effect of exchange rates (288) 40Additional charges (281) (289)Fair value, end of year 31,573 28,208Funded status - plan deficit (17,344) (15,139)Unamortized actuarial loss 16,954 15,510Unamortized transitional obligation 78 93Unamortized past service costs 1,397 1,729Net amount recognized 1,085 2,193December 30,<strong>2010</strong> 2009$ $The net amount recognized consists of the following:Accrued benefit asset: 7,580 8,390Accrued benefit liability (6,495) (6,197)Net amount recognized 1,085 2,19372<strong>Dorel</strong> <strong>Industries</strong> Inc.
Notes to the Consolidated Financial StatementsFor the years ended December 30, <strong>2010</strong> and 2009(All figures in thousands of U.S. dollars, except per share amounts)NOTE 16 – PENSION & POST RETIREMENT BENEFIT PLANS (continued)Pension Benefits (continued)The accrued benefit asset relating to pension benefits is included in other assets and the accrued benefit liability is included inpension & post-retirement benefit obligations on the Company’s Consolidated Balance Sheet.The accrued benefit obligation at the end of the period and the fair value of plan assets at the end of the period for the aggregateof plans with accrued benefit obligations in excess of plan assets are the following:December 30,<strong>2010</strong> 2009$ $Accrued benefit obligation, end of year 48,917 43,347Fair value of plan assets, end of year 31,573 28,208Net pension costs for the defined benefit plans comprise the following:December 30,<strong>2010</strong> 2009$ $Current service cost 1,592 1,281Interest cost 2,478 2,355Actual return on plan assets (3,649) (2,744)Effect of curtailments (12) —Actuarial (gain) / loss 3,964 1,301Cost before adjustments to recognize the long-term nature of the plans 4,373 2,193Difference between actual and expected return on plan assets 1,544 1,135Difference between actuarial loss on accrued benefit obligation andthe amount recognized (2,880) (213)Difference between amortization of past servicecosts and actual amendments for the year 342 342Amortization of transition obligation 9 10Pension expense 3,388 3,467Under the Company’s defined contribution plans, total expense was $1,828 (2009 – $1,712). Total cash payments for employeefuture benefits for <strong>2010</strong>, consisting of cash contributed by the Company to its funded plans, cash contributed to its definedcontribution plans and benefits paid directly to beneficiaries for unfunded plans, was $4,358 (2009 – $6,083).<strong>Annual</strong> <strong>Report</strong> <strong>2010</strong> 73
Notes to the Consolidated Financial StatementsFor the years ended December 30, <strong>2010</strong> and 2009(All figures in thousands of U.S. dollars, except per share amounts)NOTE 16 – PENSION & POST RETIREMENT BENEFIT PLANS (continued)Post-Retirement BenefitsOne of the Company’s subsidiaries maintains a defined benefit post-retirement benefit plan for substantially all its employees.Information regarding this Company’s post-retirement benefit plan is as follows:December 30,<strong>2010</strong> 2009$ $Accrued benefit obligations:Balance, beginning of year 13,482 13,493Current service cost 193 311Interest cost 795 791Benefits paid (652) (1,057)Actuarial (gain) / loss 896 (56)Balance, end of year 14,714 13,482Plan assets:Employer contributions 652 1,057Benefits paid (652) (1,057)Fair value, end of year — —Funded status-plan deficit (14,714) (13,482)Unamortized actuarial (gain)/loss (678) (1,634)Unamortized past service costs 349 374Accrued benefit liability (15,043) (14,742)Net costs for the post-retirement benefit plan comprise the following:December 30,<strong>2010</strong> 2009$ $Current service cost 193 311Interest cost 795 791Actuarial (gain)/loss 896 (56)Cost (benefit) before adjustments to recognizethe long-term nature of the plans 1,884 1,046Difference between actuarial (gain)/loss on accruedbenefit obligation and the amount recognized (956) (15)Difference between amortization of past servicecosts and actual amendments for the year 25 26Net benefit plan expense 953 1,057AssumptionsWeighted-average assumptions used to determine benefit obligations as at December 30:Pension Benefits Post Retirement Benefits<strong>2010</strong> 2009 <strong>2010</strong> 2009% % % %Discount rate 5.23 5.78 5.60 6.00Rate of compensation increase 2.22 2.06 n/a n/a74<strong>Dorel</strong> <strong>Industries</strong> Inc.
Notes to the Consolidated Financial StatementsFor the years ended December 30, <strong>2010</strong> and 2009(All figures in thousands of U.S. dollars, except per share amounts)NOTE 16 – PENSION & POST RETIREMENT BENEFIT PLANS (continued)Assumptions (continued)Weighted-average assumptions used to determine net periodic cost for the years ended December 30:Pension Benefits Post Retirement Benefits<strong>2010</strong> 2009 <strong>2010</strong> 2009% % % %Discount rate 5.78 5.98 6.00 6.25Expected long-term return on plan assets 8.04 7.47 n/a n/aRate of compensation increase 2.06 2.22 n/a n/aThe measurement date used for plan assets and pension benefits and the measurement date used for post-retirement benefitswas December 30 for both <strong>2010</strong> and 2009. The most recent actuarial valuations for the pension plans and post-retirementbenefit plans are dated January 1 st , <strong>2010</strong>. The most recent actuarial valuation of the pension plans for funding purposes was as ofJanuary 1 st, <strong>2010</strong>, and the next required valuation will be as of January 1 st , 2011.Plan assets are held in trust and their weighted average allocations were as follows as at the measurement date:<strong>2010</strong> 2009% %Equity securities 53 53Debt securities 30 31Other 17 16100 100The assumed health care cost trend used for measurement of the accumulated postretirement benefit obligation is 9% in <strong>2010</strong>,decreasing gradually to 5% in 2016 and remaining at that level thereafter. Assumed health care cost trends have an effect on theamounts reported for health care plans. A one percentage point change in assumed health care cost trend rates would have thefollowing effects:1 Percentage 1 PercentagePoint IncreasePoint Decrease$ $Effect on total of service and interest cost 203 (161)Effect on post-retirement benefit obligation 2,266 (1,848)OtherCertain of the Company’s subsidiaries have elected to act as self-insurer for certain costs related to all active employee healthand accident programs. The expense for the year ended December 30, <strong>2010</strong> was $11,833 (2009 – $8,856) under this self-insuredbenefit program.<strong>Annual</strong> <strong>Report</strong> <strong>2010</strong> 75
Notes to the Consolidated Financial StatementsFor the years ended December 30, <strong>2010</strong> and 2009(All figures in thousands of U.S. dollars, except per share amounts)NOTE 17 – CAPITAL STOCKThe capital stock of the Company is as follows:AuthorizedAn unlimited number of preferred shares without nominal or par value, issuable in series.An unlimited number of Class “A” Multiple Voting Shares without nominal or par value, convertible at any time at theoption of the holder into Class “B” Subordinate Voting Shares on a one-for-one basis.An unlimited number of Class “B” Subordinate Voting Shares without nominal or par value, convertible into Class “A”Multiple Voting Shares, under certain circumstances, if an offer is made to purchase the Class “A” shares.Details of the issued and outstanding shares are as follows:December 30,<strong>2010</strong> 2009Number Amount Number Amount$ $Class “A” Multiple Voting SharesBalance, beginning of year 4,229,510 1,792 4,229,710 1,793Converted from Class “A” to Class “B” (1) — — (200) (1)Balance, end of year 4,229,510 1,792 4,229,510 1,792Class “B” Subordinate Voting SharesBalance, beginning of year 28,739,802 173,024 29,172,482 175,629Converted from Class “A” to Class “B” (1) — — 200 1Issued under stock option plan (2) 214,375 5,755 — —Reclassification from contributed surplusdue to exercise of stock options — 1,402 — —Repurchase and cancellation of shares (3) (518,600) (3,157) (432,880) (2,606)Balance, end of year 28,435,577 177,024 28,739,802 173,024TOTAL CAPITAL STOCK 178,816 174,816(1)In 2009, the Company converted 200 Class “A” Multiple Voting Shares into Class “B” Subordinate Voting Shares at an average rate of $0.58 per share.(2)During the year, the Company realized tax benefits amounting to $302 as a result of stock option transactions. The benefit has been credited to capital stock and isnot reflected in the current income tax provision.(2)On March 30, <strong>2010</strong>, the Company filed a notice with the Toronto Stock Exchange (TSX) to make a normal course issuer bid to repurchase for cancellationoutstanding Class “B” Subordinate Voting Shares on the open market. As approved by the TSX, the Company is authorized to purchase up to 700,000 Class“B” Subordinate Voting Shares (representing 2.4% of its issued and outstanding Class “B” Subordinate Voting Shares at the time of the bid) during the period ofApril 1, <strong>2010</strong> to March 31, 2011, or until such earlier time as the bid is completed or terminated at the option of the Company. Any shares the Company purchasesunder this bid will be purchased on the open market plus brokerage fees through the facilities of the TSX at the prevailing market price at the time of the transaction.Shares acquired under this bid will be cancelled. In accordance with this normal course issuer bid, the Company repurchased during the year ended December 30, <strong>2010</strong>a total of 473,500 Class “B” Subordinate Voting Shares for a cash consideration of $15,877. The excess of the shares’ repurchase value over their carrying amount wascharged to retained earnings as share repurchase premiums.During 2009, in accordance with its previous normal course issuer bid which ended on March 19, <strong>2010</strong>, the Company repurchased 432,880 Class “B” SubordinateVoting Shares for a cash consideration of $10,504. During the three-months ended March 31, <strong>2010</strong>, the Company repurchased with its previous normal course issuerbid a total of 45,100 Class “B” Subordinate Voting Shares for a cash consideration of $1,400. The excess of the shares’ repurchase value over their carrying amount wascharged to retained earnings as share repurchase premiums.76<strong>Dorel</strong> <strong>Industries</strong> Inc.
Notes to the Consolidated Financial StatementsFor the years ended December 30, <strong>2010</strong> and 2009(All figures in thousands of U.S. dollars, except per share amounts)NOTE 18 – STOCK-BASED COMPENSATION AND OTHER STOCK-BASED PAYMENTSStock option plansUnder various plans, the Company may grant stock options on the Class “B” Subordinate Voting Shares at the discretion of theBoard of Directors, to senior executives and certain key employees. The exercise price is the market price of the securities at thedate the options are granted. Of the 6,000,000 Class “B” Subordinate Voting Shares initially reserved for issuance, 3,563,875 wereavailable for issuance under the share option plans as at December 30, <strong>2010</strong>. Options granted vest according to a graded schedule of25% per year commencing a day after the end of the first year, and options outstanding expire no later than the year 2015.The changes in outstanding stock options are as follows:December 30,<strong>2010</strong> 2009Weighted AverageWeighted AverageOptions Exercise Price Options Exercise Price$ $Options outstanding, beginning of year 2,539,000 26.27 2,253,750 31.67Granted 88,500 34.80 1,086,500 16.35Exercised (214,375) 25.46 — —Expired (125,000) 34.49 (506,750) 33.46Forfeited (71,375) 26.50 (294,500) 29.07Options outstanding, end of year 2,216,750 26.71 2,539,000 26.27Total exercisable, end of year 1,001,375 29.31 775,000 31.54A summary of options outstanding at December 30, <strong>2010</strong> is as follows:Total OutstandingTotal ExercisableWeightedAverageWeighted Remaining WeightedRange of Average Contractual AverageExercise Prices Options Exercise Price Life Options Exercise Price$ $$16.89 - $22.87 883,875 19.61 3.25 152,625 19.64$30.70 - $37.40 1,332,875 31.41 1.87 848,750 31.042,216,750 26.71 2.42 1,001,375 29.31Total compensation cost recognized in income for employee stock options for the year amounts to $4,074 (2009 – $3,480), andwas credited to contributed surplus.<strong>Annual</strong> <strong>Report</strong> <strong>2010</strong> 77
Notes to the Consolidated Financial StatementsFor the years ended December 30, <strong>2010</strong> and 2009(All figures in thousands of U.S. dollars, except per share amounts)NOTE 18 – STOCK-BASED COMPENSATION AND OTHER STOCK-BASED PAYMENTS (continued)Stock option plans (continued)The compensation cost recognized in income were computed using the fair value of granted options as at the date of grant ascalculated by the Black-Scholes option pricing model. The following weighted average assumptions were used to estimate the fairvalues of options granted during the year:<strong>2010</strong> 2009Risk-free interest rate 2.58% 1.91%Dividend yield 1.66% 3.27%Expected volatility 39.12% 37.11%Expected life 4.43 4.49Directors’ Deferred Share Unit PlanThe Company has a Deferred Share Unit Plan (the “DSU Plan”) under which an external director of the Company may electannually to have his or her director’s fees and fees for attending meetings of the Board of Directors or committees thereof paid inthe form of deferred share units (“DSU’s”). A plan participant may also receive dividend equivalents paid in the form of DSU’s.The number of DSU’s received by a director is determined by dividing the amount of the remuneration to be paid in the formof DSU’s on that date or dividends to be paid on payment date (the “Award Dates”) by the fair market value of the Company’sClass “B” Subordinate Voting Shares on the Award Date. The Award Date is the last day of each quarter of the Company’s fiscalyear in the case of fees forfeited and the date on which the dividends are payable in the case of dividends. The fair market valueof the Company’s Class “B” Subordinate Voting Shares is equal to their average closing trading price during the five trading dayspreceding the Award Date. Upon termination of a director’s service, a director may receive, at the discretion of Board of Directors,either:(a) cash equal to the number of DSU’s credited to the director’s account multiplied by the fair market value of the Class “B”Subordinate Voting Shares on the date a notice of redemption is filed by the director; or(b) the number of Class “B” Subordinate Voting Shares equal to the number of DSU’s in the director’s account; or(c) a combination of cash and Class “B” Subordinate Voting SharesOf the 175,000 DSU’s (2009 – 75,000) authorized for issuance under the plan, 107,259 were available for issuance under the DSUplan as at December 30, <strong>2010</strong>. During the year, 10,613 additional DSU’s were issued (2009 – 14,896) and $345 (2009 $328)was expensed and credited to contributed surplus. An additional 1,067 DSU’s were issued (2009 – 945) for dividend equivalentsand $35 (2009 – $22) was charged to retained earnings and credited to contributed surplus. As t December 30, <strong>2010</strong>, 67,741(2009 – 56,061) DSU’s are outstanding with related contributed surplus amounting to $1,880 (2009 – $1,500).Executive Deferred Share Unit PlanThe Company has an Executive Deferred Share Unit Plan (the “EDSU Plan”) under which executive officers of the Companymay elect annually to have a portion of his or her annual salary and bonus paid in the form of deferred share units (“DSU’s”).The EDSU Plan will assist the executive officers in attaining prescribed levels of ownership of the Company’s shares. A planparticipant may also receive dividend equivalents paid in the form of DSU’s. The number of DSU’s received by an executive officeris determined by dividing the amount of the salary and bonus to be paid in the form of DSU’s on that date or dividends to be paidon payment date (the “Award Dates”) by the fair market value of the Company’s Class “B” Subordinate Voting Shares on the AwardDate. The Award Date is the last business day of each month of the Company’s fiscal year in the case of salary, the date on whichthe bonus is, or would otherwise be, paid to the participant in the case of bonus and the date on which the dividends are payablein the case of dividends. The fair market value of the Company’s Class “B” Subordinate Voting Shares is equal to their weightedaverage trading price during the five trading days preceding the Award Date.78<strong>Dorel</strong> <strong>Industries</strong> Inc.
Notes to the Consolidated Financial StatementsFor the years ended December 30, <strong>2010</strong> and 2009(All figures in thousands of U.S. dollars, except per share amounts)NOTE 18 – STOCK-BASED COMPENSATION AND OTHER STOCK-BASED PAYMENTS (continued)Executive Deferred Share Unit Plan (continued)Upon termination of an executive officer’s service, an executive officer may receive, at the discretion of Board of Directors, either:(a) cash equal to the number of DSU’s credited to the executive officer’s account multiplied by the fair market value of theClass “B” Subordinate Voting Shares on the date a notice of redemption is filed by the executive officer; or(b) the number of Class “B” Subordinate Voting Shares equal to the number of DSU’s in the executive officer’s account; or(c) a combination of cash and Class “B” Subordinate Voting Shares.Of the 750,000 DSU’s authorized for issuance under the plan, 711,322 were available for issuance under the EDSU Planas at December 30, <strong>2010</strong>. During the year, 11,834 (2009 – 25,846) DSU’s were issued for bonus and salary paid and $393(2009 – $401) credited to contributed surplus. An additional 612 (2009 – 386) DSU’s were issued for dividend equivalents and$20 (2009 – $10) was charged to retained earnings and credited to contributed surplus. As at December 30, <strong>2010</strong>, 38,678 DSU’sare outstanding with related contributed surplus amounting to $824 (2009 – $411).NOTE 19 – ACCUMULATED OTHER COMPREHENSIVE INCOMECumulativeCash Flow TranslationHedges Adjustment Total$ $ $Balance as at December 30, 2008 — 83,139 83,139Change during the year 895 11,331 12,226Balance as at December 30, 2009 895 94,470 95,365Change during the year (1,927) (29,038) (30,965)Balance as at December 30, <strong>2010</strong> (1,032) 65,432 64,400NOTE 20 – COMMITMENTS AND GUARANTEES(a) The Company has entered into long-term operating lease agreements for buildings and equipment that expire at variousdates through the year 2028. Rent expense was $37,779 and $30,671 in <strong>2010</strong> and 2009, respectively. Future minimum leasepayments exclusive of additional charges, are as follows:Fiscal Year EndingAmount$2011 32,4302012 26,1862013 19,2402014 11,9292015 10,110Thereafter 27,053126,948<strong>Annual</strong> <strong>Report</strong> <strong>2010</strong> 79
Notes to the Consolidated Financial StatementsFor the years ended December 30, <strong>2010</strong> and 2009(All figures in thousands of U.S. dollars, except per share amounts)NOTE 20 – COMMITMENTS AND GUARANTEES (continued)(b) The Company has entered into various licensing agreements for the use of certain brand names on its products. Under theseagreements, the Company is required to pay royalties as a percentage of sales with minimum royalties of $5,596 due in fiscal2011 and $1,956 due in fiscal 2012 and 2013 combined.(c) As at December 30, <strong>2010</strong>, the Company has capital expenditure commitments of approximately $5,872 and commercialletters of credit outstanding totalling $99.(d) In the normal course of business, the Company enters into agreements that may contain features which meet the definition ofa guarantee:• The Company granted irrevocable standby letters of credit issued by highly rated financial institutions to various thirdparties to indemnify them in the event the Company does not perform its contractual obligations, such as payment ofproduct liability claims, lease and licensing agreements, duties and workers compensation claims. As at December 30, <strong>2010</strong>,standby letters of credit outstanding totalled $12,182. As many of these guarantees will not be drawn upon, these amountsare not indicative of future cash requirements. No material loss is anticipated by reason of such agreements and guaranteesand no amounts have been accrued in the Company’s consolidated financial statements with respect to these guarantees.The Company has determined that the fair value of the non-contingent obligations requiring performance under theguarantees in the event that specified events or conditions occur approximate the cost of obtaining the letters of credit.• The Company has provided a financing provider the right, upon customer default on payment to this financing provider,to sell back certain new products to the Company at predetermined prices. The maximum exposure with respect to thisguarantee as at December 30, <strong>2010</strong> is $105. Should the Company be required to act under such agreement, it is expectedthat no material loss would result after consideration of possible resell recoveries. Historically, the Company has not madeany payments under such vendor financing agreement and the estimated exposure has been accrued in the Company’sconsolidated financial statements with respect to this guarantee.NOTE 21 – CONTINGENCIESThe breadth of the Company’s operations and the global complexity of tax regulations require assessments of uncertainties andjudgments in estimating the ultimate taxes the Company will pay. The final taxes paid are dependent upon many factors, includingnegotiations with taxing authorities in various jurisdictions, outcomes of tax litigation and resolution of disputes arising fromfederal, provincial, state and local tax audits. The resolution of these uncertainties and the associated final taxes may result inadjustments to the Company’s tax assets and tax liabilities.The Company is currently a party to various claims and legal proceedings. If management believes that a loss arising from thesematters is probable and can reasonably be estimated, that amount of the loss is recorded, or the minimum estimated liability whenthe loss is estimated using a range and no point within the range is more probable than another. When a loss arising from suchmatters is probable, legal proceedings against third parties or counterclaims are recorded only if management, after consultationwith outside legal counsels, believes such recoveries are likely to be realized. As additional information becomes available, anypotential liability related to these matters is assessed and the estimates are revised, if necessary. Based on currently availableinformation, management believes that the ultimate outcome of these matters, individually and in aggregate, will not have amaterial adverse effect on the Company’s financial position or overall trends in results of operations.In 2006, anti-dumping duties were imposed upon the Company by the United States Department of Commerce (“DOC”). Theseduties pertain to certain metal furniture imported from China into the United States that was subject to anti-dumping dutiesduring the period between December 3, 2001 through May 31, 2003. In relation to this charge the Company had a pending claimagainst a major international law firm. That claim relates to a breach of professional duty by the law firm for its failure to timelyfile a request for an administrative review by the DOC of the duties imposed. During the fourth quarter of 2009, an agreementwas reached with this law firm that resulted in a gain of $6,400 being recorded in cost of sales.80<strong>Dorel</strong> <strong>Industries</strong> Inc.
Notes to the Consolidated Financial StatementsFor the years ended December 30, <strong>2010</strong> and 2009(All figures in thousands of U.S. dollars, except per share amounts)NOTE 22 – PRODUCT LIABILITYThe Company insures itself to mitigate its product liability exposure.The estimated product liability exposure was calculated by an independent actuary based on historical sales volumes, pastclaims history and management and actuarial assumptions. The estimated exposure includes incidents that have occurred, aswell as incidents anticipated to occur on units sold prior to December 30, <strong>2010</strong>. Significant assumptions used in the actuarialmodel include management’s estimates for pending claims, product life cycle, discount rates, and the frequency and severity ofproduct incidents.As at December 30, <strong>2010</strong>, the Company’s recorded liability amounts to $23,621 (2009 – $25,480), which represents the Company’stotal estimated exposure related to current and future product liability incidents.NOTE 23 – INTERESTInterest expense consists of the following:December 30,<strong>2010</strong> 2009$ $Interest on long-term debt – including effect ofcash flow hedge related to the interest rate swaps 15,563 14,969Accretion expense on contingent considerations 2,571 —Other interest 793 1,40618,927 16,375<strong>Annual</strong> <strong>Report</strong> <strong>2010</strong> 81
Notes to the Consolidated Financial StatementsFor the years ended December 30, <strong>2010</strong> and 2009(All figures in thousands of U.S. dollars, except per share amounts)NOTE 24 – INCOME TAXESVariations of income tax expense from the basic Canadian federal and provincial combined tax rates applicable to income fromoperations before income taxes are as follows:December 30,<strong>2010</strong> 2009$ % $ %PROVISION FOR INCOME TAXES 41,230 29.3 39,531 30.8ADD (DEDUCT) EFFECT OF:Difference in effective tax rates of foreign subsidiaries (7,989) (5.7) (13,591) (10.6)Recovery of income taxes arising fromthe use of unrecorded tax benefits (16,652) (11.8) (5,415) (4.2)One time adjustment for us functional currency election (2,725) (1.9) — —Change in valuation allowance 765 0.5 (2,599) (2.0)Non-deductible stock options 1,194 0.8 1,071 0.8Other non-deductible items (2,957) (2.1) (36) —Change in future income taxesresulting from changes in tax rates 2,087 1.5 1,023 0.8Effect of foreign exchange (1,343) (1.0) 672 0.5Other - Net (745) (0.5) 458 0.312,865 9.1 21,113 16.4The tax effects of significant items comprising the Company’s net future income tax liabilities are as follows:December 30,<strong>2010</strong> 2009$ $Capital and operating loss carryforwards 28,521 26,185Deferral of partnership (gain) loss 823 (406)Employee pensions and post-retirement 4,406 3,878Other long-term liabilities 215 243Accounts receivable 11,144 6,178Inventories 10,097 9,681Accrued expenses 19,014 20,213Stock options 1,136 1,148Derivatives 811 (915)Property, plant and equipment (20,915) (24,981)Intangible assets (80,446) (83,816)Goodwill (24,029) (20,514)Prepaid expenses 35 (64)Valuation allowance (3,068) (2,310)Foreign exchange and other (1,481) (202)(53,737) (65,682)82<strong>Dorel</strong> <strong>Industries</strong> Inc.
Notes to the Consolidated Financial StatementsFor the years ended December 30, <strong>2010</strong> and 2009(All figures in thousands of U.S. dollars, except per share amounts)NOTE 24 – INCOME TAXES (continued)The short-term and long-term future income tax assets and liabilities are as follows:December 30,<strong>2010</strong> 2009$ $Short-term future income tax assets 42,444 38,042Long-term future income tax assets (Note 9) 18,320 25,345Short-term future income tax liabilities (1,252) (85)Long-term future income tax liabilities (113,249) (128,984)(53,737) (65,682)As at December 30, <strong>2010</strong>, the Company has $4,654 of capital losses with no expiry and $92,970 of operating loss carryforwards,of which $11,600 will expire between 2017 and 2019 and $41,623 will expire between 2025 and 2030. The remaining $39,747has no expiration date. The Company also has unclaimed expenses available to reduce federal income tax amounting to $2,060and expiring between 2011 and 2015. The Company recognized a future income tax asset for all of these unused tax losses andother available income tax reductions but used a valuation allowance to reduce the related future income tax asset to the amountthat is more likely than not to be realized. As limitations on the utilization of these tax assets may apply, the Company has provideda valuation allowance in the amount of $3,068 as at December 30, <strong>2010</strong> for the full value of the capital losses and unclaimedexpenses and for a portion of the operating loss carryforwards.The Company has not recognized a future income tax liability for the undistributed earnings of its subsidiaries in the current orprior years since the Company does not expect to sell or repatriate funds from those investments, in which case the undistributedearnings may become taxable. Any such liability cannot reasonably be determined at the present time.NOTE 25 – EARNINGS PER SHAREThe following table provides a reconciliation between the number of basic and fully diluted shares outstanding:December 30,<strong>2010</strong> 2009Weighted daily average number of Class “A” Multipleand Class “B” Subordinate Voting Shares 32,855,191 33,232,606Dilutive effect of stock options and deferred share units 363,076 167,934Weighted average number of diluted shares 33,218,267 33,400,540Number of anti-dilutive stock options and deferred share unitsexcluded from fully diluted earnings per share calculation 1,141,800 1,551,395<strong>Annual</strong> <strong>Report</strong> <strong>2010</strong> 83
Notes to the Consolidated Financial StatementsFor the years ended December 30, <strong>2010</strong> and 2009(All figures in thousands of U.S. dollars, except per share amounts)NOTE 26 – STATEMENT OF CASH FLOWSNet changes in non-cash balances related to operations are as follows:December 30,<strong>2010</strong> 2009$ $Accounts receivable (12,789) (27,312)Inventories (111,821) 113,630Prepaid expenses (743) (378)Accounts payable, accruals and other long-term liabilities 34,193 (39,437)Income taxes (11,152) 1,156Total (102,312) 47,659Details of business acquisitions:December 30,<strong>2010</strong> 2009$ $Acquisition of businesses — (23,643)Cash acquired — 290— (23,353)Balance of sale (paid) (220) 1,692(220) (21,661)The components of cash and cash equivalents are:December 30,<strong>2010</strong> 2009$ $Cash 15,673 17,525Short-term investments 75 2,322Cash and cash equivalents 15,748 19,847Supplementary disclosure:December 30,<strong>2010</strong> 2009$ $Interest paid (14,754) (14,173)Income taxes paid (37,121) (26,639)Income taxes received 9,108 5,28484<strong>Dorel</strong> <strong>Industries</strong> Inc.
Notes to the Consolidated Financial StatementsFor the years ended December 30, <strong>2010</strong> and 2009(All figures in thousands of U.S. dollars, except per share amounts)NOTE 26 – STATEMENT OF CASH FLOWS (continued)Acquiring a long-lived asset by incurring a liability does not result in a cash outflow for the Company until the liability is paid. Assuch, the consolidated statement of cash flows excludes the following non-cash transactions:December 30,<strong>2010</strong> 2009$ $Acquisition of property, plant and equipment financed byaccounts payable and accrued liabilities 2,480 1,085Acquisition of intangible assets financed byaccounts payable and accrued liabilities 479 130NOTE 27 – SEGMENTED INFORMATIONThe Company’s significant business segments include:• Juvenile Products Segment: Engaged in the design, sourcing, manufacturing and distribution of children’s furniture andaccessories which include infant car seats, strollers, high chairs, toddler beds, cribs and infant health and safety aids.• Recreational / Leisure Segment: Engaged in the design, sourcing and distribution of recreational and leisure products andaccessories which include bicycles, jogging strollers, scooters and other recreational products.• Home Furnishings Segment: Engaged in the design, sourcing, manufacturing and distribution of ready-to-assemblefurniture and home furnishings which include metal folding furniture, futons, step stools, ladders and other importedfurniture items.The accounting policies used to prepare the information by business segment are the same as those used to prepare the consolidatedfinancial statements of the Company as described in Note 3.The Company evaluates financial performance based on measures of income from segmented operations before interest andincome taxes. The allocation of revenues to each geographic area is based on where the selling company is located.Geographic Segments – OriginDecember 30,Property, plant andTotal Revenueequipment and Goodwill<strong>2010</strong> 2009 <strong>2010</strong> 2009Canada 261,632 247,878 50,851 51,336United States 1,322,030 1,191,755 365,261 371,596Europe 607,807 540,269 270,770 278,455Other foreign countries 121,517 160,212 25,369 21,716Total 2,312,986 2,140,114 712,251 723,103<strong>Annual</strong> <strong>Report</strong> <strong>2010</strong> 85
Notes to the Consolidated Financial StatementsFor the years ended December 30, <strong>2010</strong> and 2009(All figures in thousands of U.S. dollars, except per share amounts)NOTE 27 – SEGMENTED INFORMATION (continued)Industry SegmentsDecember 30,Recreational /Total Juvenile Leisure Home Furnishings<strong>2010</strong> 2009 <strong>2010</strong> 2009 <strong>2010</strong> 2009 <strong>2010</strong> 2009$ $ $ $ $ $ $ $Total Revenue 2,312,986 2,140,114 1,030,209 995,014 774,987 681,366 507,790 463,734Cost of sales 1,780,204 1,634,570 750,159 720,517 591,434 527,627 438,611 386,426Selling, general andadministrative expenses 305,870 292,066 153,586 149,239 121,411 106,209 30,873 36,618Depreciation & amortization 31,210 27,227 23,567 20,776 6,625 5,009 1,018 1,442Research and development costs 13,626 17,184 7,829 11,948 3,192 2,684 2,605 2,552Earnings from Operations 182,076 169,067 95,068 92,534 52,325 39,837 34,683 36,696Interest 18,927 16,375Corporate expenses 22,431 24,345Income taxes 12,865 21,113Net income 127,853 107,234Total Assets 2,074,892 1,969,655 1,036,153 999,808 807,745 756,557 230,994 213,290Additions to property, plantand equipment – net 35,263 21,893 24,966 13,297 7,189 6,763 3,108 1,833Depreciation related tomanufacturing activitiesincluded in Cost of sales 19,718 21,825 12,794 15,564 2,840 2,006 4,084 4,255Total AssetsDecember 30,<strong>2010</strong> 2009$ $Total assets for reportable segments 2,074,892 1,969,655Corporate assets 21,068 32,525Total Assets 2,095,960 2,002,18086<strong>Dorel</strong> <strong>Industries</strong> Inc.
Notes to the Consolidated Financial StatementsFor the years ended December 30, <strong>2010</strong> and 2009(All figures in thousands of U.S. dollars, except per share amounts)NOTE 27 – SEGMENTED INFORMATION (continued)GoodwillThe continuity of goodwill by industry segment is as follows:December 30,Recreational /Total Juvenile Leisure Home Furnishings<strong>2010</strong> 2009 <strong>2010</strong> 2009 <strong>2010</strong> 2009 <strong>2010</strong> 2009$ $ $ $ $ $ $ $Balance, beginning of year 569,824 540,187 365,118 343,155 173,534 165,860 31,172 31,172Additions (1) (7,378) 9,943 — 4,860 (7,378) 5,083 — —Contingent considerations(Notes 4 and 13) 4,224 16,155 120 13,583 4,104 2,572 — —Foreign exchange (12,284) 3,539 (12,280) 3,520 (4) 19 — —Balance, end of year 554,386 569,824 352,958 365,118 170,256 173,534 31,172 31,172(1) The <strong>2010</strong> adjustment relates to the finalisation of the purchase price allocation of Hot Wheels and Circle Bikes which resulted in a reallocation from goodwill tointangible assets (Note 4).Concentration of Credit RiskSales to the Company’s major customer as described in Note 14 were concentrated as follows:Canada United States Foreign<strong>2010</strong> 2009 <strong>2010</strong> 2009 <strong>2010</strong> 2009% % % % % %Juvenile 0.9 0.8 7.3 7.3 0.1 1.4Recreational/Leisure 0.1 — 8.8 8.4 — —Home furnishings 4.0 4.7 9.4 6.7 0.4 2.1<strong>Annual</strong> <strong>Report</strong> <strong>2010</strong> 87
www.dorel.com
www.dorel.com1255 Greene Avenue, suite 300Westmount, Quebec, Canada H3Z 2A4T (514) 934-3034F (514) 934-9932djgusa.comsafety1st.commaxi-cosi.comquinny.combebeconfort.comingoodcare.compacific-cycle.comcannondale.comsugoi.caschwinn.comgtbicycles.commongoose.cominstep.netcoscoproducts.comameriwood.comaltrafurniture.comcoscojuvenile.comebbaby.com