please allow a few minutes due to file size - Canadian Tourism ...
please allow a few minutes due to file size - Canadian Tourism ...
please allow a few minutes due to file size - Canadian Tourism ...

You also want an ePaper? Increase the reach of your titles
YUMPU automatically turns print PDFs into web optimized ePapers that Google loves.
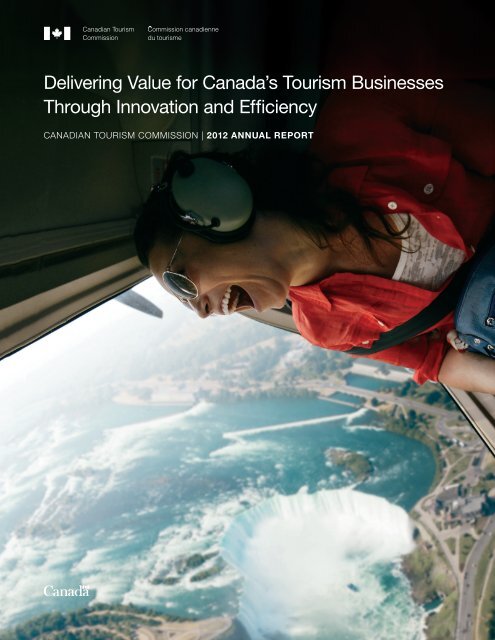
Delivering Value for Canada’s <strong>Tourism</strong> BusinessesThrough Innovation and EfficiencyCANADIAN TOURISM COMMISSION | 2012 ANNUAL REPORT
CONTENTS1 About the CTC2 Message from the Chair of the Board3 Message from the President & CEO4 Results at a Glance6 Helping <strong>Tourism</strong> Businesses13 Year in Review13 Global <strong>Tourism</strong> Industry Overview14 <strong>Tourism</strong> Industry in Canada16 Competi<strong>to</strong>r Performance19 CTC Highlights of 201225 Marketing Canada <strong>to</strong> the World28 Awards and Recognition in 201230 Performance Measurement33 Corporate Governance38 Management Discussion and Analysis46 Financial Statements53 Notes <strong>to</strong> the Audited Financial StatementsThis Annual Report showcases key activities and initiatives undertaken throughout2012. The Annual Report serves as the principal mechanism for the <strong>Canadian</strong><strong>Tourism</strong> Commission <strong>to</strong> report <strong>to</strong> the Parliament of Canada and demonstrate theresults achieved with public resources.NunavutCover image:Niagara Helicopters Tour,Niagara Falls, Ontario
About the CTCThe <strong>Canadian</strong> <strong>Tourism</strong> Commission (CTC) is Canada’snational <strong>to</strong>urism marketing organization. Governed by the<strong>Canadian</strong> <strong>Tourism</strong> Commission Act, we lead the <strong>Canadian</strong> <strong>to</strong>urismindustry in marketing Canada as a premier, four-season <strong>to</strong>urismdestination, and provide a consistent voice for Canada in theinternational <strong>to</strong>urism marketplace.As a federal Crown corporation, we report <strong>to</strong> Parliament throughthe Minister of Industry, who has delegated his duties and powerrelated <strong>to</strong> the CTC <strong>to</strong> the Minister of State (Small Business and<strong>Tourism</strong>). Our purpose is <strong>to</strong> sustain a vibrant and profitable <strong>to</strong>urismindustry by supporting a cooperative relationship between theprivate sec<strong>to</strong>r and the governments of Canada, the provinces andthe terri<strong>to</strong>ries. The CTC was founded on the principle of public/private sec<strong>to</strong>r partnerships; through contributions that leverage ourfederal funding, we achieve the maximum return on investment forour <strong>to</strong>urism marketing initiatives.We collaborate with our partners in the <strong>to</strong>urism industry <strong>to</strong> promoteCanada’s extraordinary experiences in 11 countries around theworld. Our current approach targets international travellers in theAmericas (Mexico and Brazil), Europe (the United Kingdom (UK),Germany and France), Asia (China, India, Japan and South Korea)and Australia. We also conduct business events sales activitiesin the United States (US). Our regional hub structure <strong>allow</strong>s us <strong>to</strong>be nimble and opportunistic so that we can adjust our marketingprograms <strong>to</strong> reflect changing market conditions and capitalize onnew marketing opportunities as they arise. Moreover, we performmarket research, offer stunning visuals through our Brand CanadaLibrary and provide resources <strong>to</strong> help industry leverage Canada’ssuccessful <strong>to</strong>urism brand, Canada. Keep Exploring.The immediate beneficiary of our activity is Canada’s <strong>to</strong>urismindustry, with over 157,000 1 <strong>to</strong>urism-related businesses supportingover 608,000 2 jobs in the <strong>Canadian</strong> economy. The ultimatebeneficiary is the <strong>Canadian</strong> taxpayer, who enjoys <strong>to</strong>urism’scontribution <strong>to</strong> the quality of life in Canada through public andprivate investments in parks, transportation infrastructure,attractions, events and event facilities.© Nunavut <strong>Tourism</strong>1Statistics Canada, Income and Expenditure Division, Special Tabulation, 2011.2National <strong>Tourism</strong> Indica<strong>to</strong>rs, Quarterly estimates, Third quarter 2012,Statistics Canada.<strong>Canadian</strong> <strong>Tourism</strong> Commission 2012 Annual Report 1
Message from the Chair of the Board<strong>Tourism</strong> is above all a people business. The past year hasenabled me <strong>to</strong> connect with and learn from more folks inthe <strong>Canadian</strong> <strong>to</strong>urism industry than ever before, from coast<strong>to</strong> coast <strong>to</strong> coast.It started with an invitation from the Honourable MaximeBernier, Minister of State (Small Business and <strong>Tourism</strong>),for the CTC <strong>to</strong> review the funding practices of national<strong>to</strong>urism organizations around the world and <strong>to</strong> return with acomprehensive report.So began an epic series of industry consultations aroundCanada for Michele and myself. We listened <strong>to</strong> andcompared notes with the <strong>Canadian</strong> <strong>to</strong>urism industry,from provincial <strong>to</strong>urism associations, industry leaders andsmall business owners <strong>to</strong> prominent federal, provincialand municipal government figures from Yukon and BritishColumbia <strong>to</strong> Quebec and Atlantic Canada.Our industry showed great leadership and provided freshgrassroots insights during these discussions. I’d like <strong>to</strong> thankthe Hotel Association of Canada and the <strong>Tourism</strong> IndustryAssociation of Canada for their invaluable support andleadership in this process and in raising the pro<strong>file</strong> for theopportunities presented by our industry for job creation andeconomic growth.We’re always looking ahead at the CTC, sifting the biggertrends for fresh opportunities. Our team has identified theyouth travel market as a great opening for long-term <strong>to</strong>urismgrowth in Canada, especially in the build-up <strong>to</strong> our country’s150 th anniversary in 2017. I look forward <strong>to</strong> seeing this workdevelop and flourish further in 2013 and beyond.More CTC thought leadership came last year in the creationof the Export <strong>Tourism</strong> Council. Despite <strong>to</strong>tal <strong>to</strong>urism revenuereaching $82 billion in 2012, most of that growth came fromthe domestic market. This Council brings <strong>to</strong>gether industryleaders who have significant investments in export marketsand will be invaluable in helping <strong>to</strong> inform our strategicdirection in the international marketplace.In a global context, the G20 world leaders recognized for thefirst time the importance of travel and <strong>to</strong>urism as a driver ofeconomic recovery, growth and jobs. Marketing budgets arebeing strengthened around the globe, while governmentsadjust air, visa and border access policies <strong>to</strong> maximizecompetitiveness. And Canada can compete. We have agreat brand and a stellar reputation.This year, I would like <strong>to</strong> make special mention of our industrypartners. Over the years, on average our partners havedoubled the amount invested in the CTC by the government.While that result is harder <strong>to</strong> achieve in leaner times, as wasthe case in 2012, it’s still an impressive demonstration ofthe confidence placed in us by the industry and our mutualcommitment <strong>to</strong> growing international <strong>to</strong>urism revenue.In 2012, partner contributions <strong>to</strong>talled nearly $62 million,harnessing our collective marketing voice <strong>to</strong> $138 million.The CTC has an incredible team of passionate professionals.On behalf of everyone on our board, I extend mycompliments and thanks <strong>to</strong> each one of them for all theirefforts in 2012. It is an honour for me, fellow board membersand the industry volunteers on our five advisory committees<strong>to</strong> be associated with such an outstanding team.Where next? Our markets are showing encouraging signs ofvitality, and that does not include the steady rise in numbersin <strong>Canadian</strong>s travelling more in their own country. The USmarket has bot<strong>to</strong>med out and a turnaround in <strong>Canadian</strong>fortunes has begun. Our emerging and re-emerging marketsare building a head of steam. And Australia goes fromstrength <strong>to</strong> strength. Opportunity is knocking, folks.Steve AllanChair2 <strong>Canadian</strong> <strong>Tourism</strong> Commission 2012 Annual Report
Message from the President & CEO“Innovation is the specific instrument ofentrepreneurship. The act that endows resourceswith a new capacity <strong>to</strong> create wealth.”— Peter Drucker, 1993What Drucker said 20 years ago still holds true for the<strong>to</strong>urism industry and for us especially at the <strong>Canadian</strong><strong>Tourism</strong> Commission. Our goal in 2012 was <strong>to</strong> competefiercely with our international rivals, be <strong>to</strong>p drawer in terms ofmarketing innovation and <strong>to</strong> deliver results—and revenue—for Canada. We delivered those, in spades.Pride of place at 2012’s innovation table must go <strong>to</strong> our35 Million Direc<strong>to</strong>rs project. It delivered a stunning visuals<strong>to</strong>ry that delighted and inspired people around the world<strong>to</strong> come visit Canada. The project also stirred a great senseof national pride in <strong>Canadian</strong>s <strong>to</strong> help promote our countryand <strong>to</strong> support our national <strong>to</strong>urism industry in communitiesacross Canada.We had asked <strong>Canadian</strong>s during the summer <strong>to</strong> sendus their images and videos that they believed capturedCanada’s heart and soul. More than 8,000 submissions later,we knew we had struck gold. The video, “Canada. Sharedby <strong>Canadian</strong>s,” has been seen by more 2.5 million peoplearound the world on YouTube.Our ground-breaking Signature Experiences Collection ®program went from strength <strong>to</strong> strength in 2012. Fullylaunched in almost all our international markets, theCollection, now 163 members strong, showcases Canada’sdistinctive <strong>to</strong>urism experiences <strong>to</strong> the travel trade andconsumers alike, giving us an extra edge in a crowded<strong>to</strong>urism marketplace.The competition certainly got <strong>to</strong>ugher in 2012, with thelaunch of Brand USA. <strong>Canadian</strong>s are being wooed by bigmoney poured in<strong>to</strong> great campaigns by our close southernneighbour. This is a genuine game-changer for our industryat home. There have been changes on the domestic front,<strong>to</strong>o. New <strong>to</strong>urism Crown corporations sprang up in 2012 forBritish Columbia, Saskatchewan and Nova Scotia. Broadlyspeaking, there is an increased sophistication and alignmentwith best practices among our partners. The CTC got an Agrade for efficiency in 2012: we introduced new cloud-basedsystems across our internal business, providing our staff witheffective, easy-<strong>to</strong>-use-<strong>to</strong>ols that saved money and freed uptime and resources for our marketing work.We re-launched our partnership with the <strong>Tourism</strong> IndustryAssociation of Canada on industry communications,research products and education around issues. Two ofthe trickiest subjects we now deal with in tandem are visasand air access from our key markets. We also started aseries of <strong>to</strong>wn halls in December <strong>to</strong> meet grassroots <strong>to</strong>urismstakeholders and pool ideas on how <strong>to</strong> take the <strong>Canadian</strong><strong>to</strong>urism industry forward.I’m delighted <strong>to</strong> report on our excellent results from the pastyear that are directly attributable <strong>to</strong> our measured marketingactivities in 2012:• $687 million in <strong>to</strong>urism export revenue for Canada’seconomy;• $212 million <strong>to</strong>wards government revenue;• 5,073 jobs created or protected by <strong>Canadian</strong> <strong>to</strong>urismbusinesses.For every dollar invested in our consumer marketingcampaigns, we generated $56 for Canada’s visi<strong>to</strong>r economy.It’s been another great year working with all our teams at theCTC. I often tell our partners that the CTC’s two main assetsare our brand, Canada. Keep Exploring, and our people, whoamaze me, push me <strong>to</strong> excel and are a source of ceaselesspride. Going forward in<strong>to</strong> 2013 with such talented peoplemakes me confident we will continue <strong>to</strong> meet our goals ofdelivering fresh ideas for attracting visi<strong>to</strong>rs <strong>to</strong> Canada andincreasing the revenue streams in<strong>to</strong> our country.Keep exploring!Michele McKenziePresident & CEO<strong>Canadian</strong> <strong>Tourism</strong> Commission 2012 Annual Report 3
How Results many at travellers a Glance did the CTCinspire <strong>to</strong> visit Canada in 2012?60% of overnight travel <strong>to</strong> Canadacomes from our 10 leisure marketsand accounts for 61% of Canada’sinternational <strong>to</strong>urist receipts.=Converted travellersUK146,100GERMANY123,000UNITED STATESFRANCE106,300MEXICO13,200598,100CONVERTEDTRAVELLERS*BRAZIL21,100* Travellers from CTC’s direct-<strong>to</strong>-consumer advertising andtravel trade 4 <strong>Canadian</strong> promotions. <strong>Tourism</strong> Commission 2012 Annual Report
What does this mean forCanada’s <strong>to</strong>urism economy?Consumer campaigns$607 million++Travel trade promotions$36 millionBusiness events$44 million=CTC’s contribution<strong>to</strong> <strong>to</strong>urism economy$687 million$JAPANINDIACHINA84,800S.KOREA3,80032,300CTC’s contribution <strong>to</strong>government revenue$212 million2,800Contribution <strong>to</strong> federalgovernment revenue$90 million$AUSTRALIA64,800Supporting5,073 jobsNote: Estimated short-term results based on third party evaluations of campaign effectiveness.<strong>Canadian</strong> <strong>Tourism</strong> Commission 2012 Annual Report 5
section titleHelping <strong>Tourism</strong> Businessesthrough leadershipThe global <strong>to</strong>urism market is highly competitiveand saturated with enticing destinations. More than ever,travellers have greater choice in where in the world theywant <strong>to</strong> visit, including <strong>to</strong> emerging and exotic destinationsnot readily available <strong>to</strong> them before. That’s why it is all themore important for the CTC <strong>to</strong> demonstrate our ability <strong>to</strong>lead Canada’s international <strong>to</strong>urism marketing efforts, andlead successfully.We continue <strong>to</strong> invest in markets that provide the largestsources of <strong>to</strong>urism revenue for Canada, while also tappingin<strong>to</strong> growth from new and emerging markets. We target thosetravellers who have a high propensity <strong>to</strong> spend, and invest inthose markets where Canada’s strong <strong>to</strong>urism brand leads.In a fast-paced industry like <strong>to</strong>urism, we rely on our research<strong>to</strong> keep abreast of changing global conditions and markettrends. Our market allocation decisions are guided by oursophisticated research models which rigorously identifymarkets offering the maximum potential for return.This return on our investment is then quantifiedas attributable <strong>to</strong>urism export revenue,which in turn supports jobs andgenerates tax revenue for all levels ofgovernment.CN Tower, Toron<strong>to</strong>, Ontario6
Helping <strong>to</strong>urism businessesWe similarly use our foundation of business insights andmarket research <strong>to</strong> continually improve our marketing and <strong>to</strong>impact the strategies of <strong>to</strong>urism businesses. For example,recognizing the demand for <strong>Canadian</strong> outdoor activities,including hunting and fishing, in 2012 we launched websitepages with links <strong>to</strong> outfitter sites directed at enthusiastslooking for authentic outdoor experiences that have a longtradition in Canada. While the knowledge that we gatherhelps <strong>to</strong> inform our decision making, members of the<strong>Canadian</strong> <strong>to</strong>urism industry also use our extensive productionof research publications (e.g. <strong>Tourism</strong> Snapshot, Global<strong>Tourism</strong> Watch summary reports, Market Insights) <strong>to</strong> helpgrow their businesses.Keeping the <strong>to</strong>urism industry informed and equipped with<strong>to</strong>ols is a key focus for us. Our CTC News is the place <strong>to</strong>read about our work, keeping the industry up-<strong>to</strong>-date withour latest campaigns and activities in all our markets. OurBrand Canada Library offers a one-s<strong>to</strong>p shop <strong>to</strong> travel tradeand media for over 5,000 professional images and videoclips of Canada’s urban and natural landscapes. The Libraryreflects the essence and diversity of Canada which can beused <strong>to</strong> add an authentic <strong>Canadian</strong> flavour <strong>to</strong> marketingmaterials. And for over 30 years, we have been leadingthe annual Rendez-vous Canada, Canada’s premier go<strong>to</strong>marketplace which connects international buyers with<strong>Canadian</strong> sellers of <strong>to</strong>urism products.Given our strategy <strong>to</strong> invest where the Canada brand canlead, <strong>to</strong> ensure the highest possible return, we determinedthat our limited resources prevented us from havingan adequately strong impact in the US Leisure market.Furthermore, redirecting those dollars <strong>to</strong> focus on higheryielding international markets could generate measurablegains. Overall, this shift enabled us <strong>to</strong> demonstrate ourleadership position with a solid and unified Canada brandin markets of highest return. Our partners recognizethe benefits of working <strong>to</strong>gether under the leadershipof Canada’s <strong>to</strong>urism brand as it helps amplify Canada’scollective voice in a crowded global marketplace.Whether it’s market research, embracing new technologiesor knowing which markets offer the greatest return, wepride ourselves on our ability <strong>to</strong> lead the <strong>Canadian</strong> <strong>to</strong>urismindustry. Leadership is not just about working harder, butabout working smarter.Being on <strong>to</strong>p of the communications revolution is anothermark that’s earned us a reputation a leader. Years ago,before social media <strong>to</strong>ok off, we saw its potential for anew kind of marketing. We eagerly embraced new socialplatforms such as Facebook, Twitter, YouTube and Flickr in<strong>to</strong>our marketing channels, putting these <strong>to</strong>ols in<strong>to</strong> the handsof visi<strong>to</strong>rs so they could tell their s<strong>to</strong>ries <strong>to</strong> fellow travellersand become advocates for Canada. We broke new groundas an early adopter of social media, and its integrationin<strong>to</strong> our marketing approach has enabled us <strong>to</strong> buildCanada’s <strong>to</strong>urism brand globally and engage influencers andconsumers in two-way dialogue.Over the last year, we continued a strategic move thatbegan in 2010, ceasing direct-<strong>to</strong>-consumer advertising andmarketing through travel agents and <strong>to</strong>ur opera<strong>to</strong>rs in theUS. In 2012, we also terminated our media relations, publicrelations and social media work in the US, remaining active inthat market only through our business events sales activitiesand our annual Canada Media Marketplace event. While USLeisure has traditionally been—and remains—important <strong>to</strong>Canada’s <strong>to</strong>urism industry, it is also ferociously competitive.Kootenays, British Columbia<strong>Canadian</strong> <strong>Tourism</strong> Commission 2012 Annual Report 7
section titleHelping <strong>to</strong>urism businessesthrough marketing excellenceInnovation is a core value that acts as a corners<strong>to</strong>ne ofour work at the CTC, and we strive <strong>to</strong> develop creative ways<strong>to</strong> motivate travellers <strong>to</strong> discover Canada. Our 35 MillionDirec<strong>to</strong>rs campaign in 2012 was an innovative approach<strong>to</strong> connect emotionally with potential travellers by puttingcameras in<strong>to</strong> the hands of <strong>Canadian</strong>s. The final product wasa two-minute <strong>to</strong>urism marketing video made by <strong>Canadian</strong>sfor the world. As Canada’s national <strong>to</strong>urism marketer, we arealways looking <strong>to</strong> develop new and clever ways <strong>to</strong> promoteCanada globally.Quebec City, Quebec8
Helping <strong>to</strong>urism businessesOne of the key assets at our disposal is the strength ofthe Canada brand, ranking in the <strong>to</strong>p spot in 2010 and2011, and #2 in 2012, by leading international consultancyFutureBrand. This past year also saw Canada advance its<strong>to</strong>urism position within the index by seven places <strong>to</strong> sixth.Canada’s own <strong>to</strong>urism brand—Canada. Keep Exploring—is a key element of the overall country brand managedand promoted under the CTC’s direction. This compellingnational brand has a unique drawing power—a force that noindividual, local or regional marketing effort can match 3 .Another prominent consultancy, The Reputation Institute,also regarded Canada in a positive light and ranked it thecountry with the best reputation in the world in both 2011and 2012, and as the <strong>to</strong>p most recommended country <strong>to</strong>visit in 2012. Canada’s strong brand image, coupled with theunique experiences we offer, are critical elements on whichwe capitalize. Along with our industry partners, we exposeprospective travellers <strong>to</strong> captivating marketing that connectswith them emotionally and helps Canada <strong>to</strong> be <strong>to</strong>p of mind.Recognizing that the consumer is at the heart of ourmarketing approach, we use our proprietary cus<strong>to</strong>mersegmentation <strong>to</strong>ol, the Explorer Quotient ® (EQ ® ), <strong>to</strong> uniquelylink social values <strong>to</strong> travel preferences. This enables us<strong>to</strong> precisely target the people most likely <strong>to</strong> visit Canadathrough tailored campaigns.Successful marketing depends on knowing who ourtarget cus<strong>to</strong>mers are. We build on Canada’s stellar globalreputation and develop creative strategies and innovative<strong>to</strong>ols that maximize the power of our marketing budget. Byfocusing purposefully on segments of greatest opportunity,we, along with our partners, are creating a strong future forCanada’s <strong>to</strong>urism industry.Our dynamic Signature Experiences Collection ® (SEC)also helps <strong>to</strong> ensure that Canada stands out from thecompetition. It moves beyond Canada’s traditional “pillars”of wildlife and geography, and responds <strong>to</strong> consumers’increasing demand for experiential travel options that takethem off the beaten path. While tangibly showcasing thekinds of extraordinary experiences travellers can have fromcoast <strong>to</strong> coast <strong>to</strong> coast, we also offer a wide range of <strong>to</strong>ols<strong>to</strong> help <strong>to</strong>urism businesses compete for discerning travellersby promoting themselves internationally as “experiences”rather than “products”.Toolkits for industry include theCTC Brand Standards Guide,the Experiences Toolkit, and theEQ Toolkit.3Results from the CTC’s 2011 Global <strong>Tourism</strong> Watch survey reveal thatwhile 21% of international travellers are aware of Canada, less than 1%are aware of its provinces or terri<strong>to</strong>ries.Aikens Lake Wilderness Lodge, Mani<strong>to</strong>ba<strong>Canadian</strong> <strong>Tourism</strong> Commission 2012 Annual Report 9
Helping <strong>to</strong>urism businessesthrough economic growthAs one of the world’s fastest growing sec<strong>to</strong>rs 4 , <strong>to</strong>urismis strategically important for Canada <strong>to</strong> generate exportrevenues that provide new dollars <strong>to</strong> the economy. Thehealthy domestic market is well served by our provincialand terri<strong>to</strong>rial partners. We’ve chosen <strong>to</strong> focus fully on theinternational traveller, thereby reducing duplication of effortsin promoting Canada <strong>to</strong> <strong>Canadian</strong>s.A <strong>to</strong>urist from one of our leisure markets spends an averageof $1,441 on a trip <strong>to</strong> Canada 5 , while a <strong>Canadian</strong> spendsless than $300 travelling domestically 6 . While the <strong>Canadian</strong>economy benefits from increasing domestic <strong>to</strong>urismdemand, dependence on this market is a serious concern asthere is limited potential for growth <strong>due</strong> <strong>to</strong> a relatively smallpopulation base.4UNWTO <strong>Tourism</strong> Highlights, 2012 Edition.5International Travel Survey, Statistics Canada.6Travel Survey of Residents of Canada, Statistics Canada. Canal Covered Bridge near St. George, New Brunswick10 <strong>Canadian</strong> <strong>Tourism</strong> Commission 2012 Annual Report
Helping <strong>to</strong>urism businessesWith more and more <strong>Canadian</strong>s travelling abroad, the traveldeficit is forecast <strong>to</strong> reach a record high of $17.8 billion in2012 7 , a deterioration of 9% year over year as paymentsby <strong>Canadian</strong>s abroad were more than double receiptsfrom visi<strong>to</strong>rs <strong>to</strong> Canada. As the sixth biggest spenderon international travel 8 , Canada is now seen as a netcontribu<strong>to</strong>r <strong>to</strong> the world’s <strong>to</strong>urism economy. Our strategy,therefore, focuses on revenue. Generating revenue from theinternational traveller helps <strong>to</strong> alleviate the long-term relianceon the domestic market for <strong>to</strong>urism growth. Through effective<strong>to</strong>urism marketing and promotions supported by alignedmarket research, the CTC helps create jobs and generatewealth for <strong>Canadian</strong>s by stimulating demand for Canada’svisi<strong>to</strong>r economy.A <strong>to</strong>p priority for us is <strong>to</strong> deliver returns on the taxpayerdollars invested in our organization. Using a rigorousand commercially accepted methodology <strong>to</strong> assess theeffectiveness of our campaigns <strong>allow</strong>s us <strong>to</strong> conservativelyattribute our work <strong>to</strong> tangible economic impacts. Our shorttermresults for 2012 indicate that our measured marketingactivities generated $687 million for Canada—that’s newmoney being injected directly in<strong>to</strong> the <strong>Canadian</strong> economy,not domestic spending circulating within the country.Supporting government programs through the generationof tax revenue is another priority for us, and so far in 2012our marketing efforts have contributed $212 million ingovernment tax revenue. $90 million of this was directed <strong>to</strong>the federal treasury, and our contributions are only expected<strong>to</strong> increase once long-term results 9 are in.We’ve stayed true <strong>to</strong> our goal of delivering revenue and jobsfor our country via innovative marketing, the main source ofour competitive advantage <strong>to</strong> generate demand for travel.The CTC is trusted <strong>to</strong> get results, and the alignment of ourpartners and their contributions <strong>to</strong> our marketing activitiesare sound testaments <strong>to</strong> this. In fact, in 2012, partnerscontributed close <strong>to</strong> $62 million—equivalent <strong>to</strong> 80 centsfor every dollar we received in federal funding—harnessingour collective marketing voice <strong>to</strong> $138 million. Our wellexecutedmarketing programs drive not only revenue growthfor Canada but job growth as well, and our partnershipsenable us <strong>to</strong> provide an even greater return <strong>to</strong> the <strong>Canadian</strong>taxpayer. So far in 2012, our targeted <strong>to</strong>urism promotionactivities have supported over 5,000 jobs for <strong>Canadian</strong><strong>to</strong>urism businesses. No other national <strong>to</strong>urism organizationthat we know of puts more effort in<strong>to</strong> understanding thespecific impact of marketing within the context of overall<strong>to</strong>urism performance.© Linda HalesNahanni, Northwest Terri<strong>to</strong>riesSaskatchewan7International Travel Account, Fourth Quarter 2012, Statistics Canada(preliminary).8UNWTO World <strong>Tourism</strong> Barometer, Volume 11, January 2013.9Short-term results include travel booked up <strong>to</strong> three months aftercampaign completion; long-term results include travel booked up <strong>to</strong> ayear after campaign completion.<strong>Canadian</strong> <strong>Tourism</strong> Commission 2012 Annual Report 11
section titleCanada Day Celebration, Parliament Hill,Ottawa, Ontario12
Year in ReviewGlobal <strong>Tourism</strong> Industry Overview<strong>Tourism</strong> is a trillion dollar global business generating fierce competition within the industry.Tourists spend $3 billion a day, or $2 million a minute, making <strong>to</strong>urism a lucrative industry inwhich countries can invest <strong>to</strong> help stimulate their economies and drive trade and investment.It accounts for one in every 12 jobs 10 , and in terms of exports, it ranks fourth globally after fuels,chemicals and food 11 .Throughout the course of 2012, the <strong>to</strong>urism industry proved its resilience yet again. <strong>Tourism</strong>has become one of the world’s fastest-growing industries, and is showing no signs of slowingdown. Despite the global financial and economic crisis, people still desire <strong>to</strong> travel the world. Infact, international <strong>to</strong>urist arrivals surpassed the one billion mark in 2012, an increase of 4% over2011 12 . Between now and 2030, international <strong>to</strong>urist arrivals are set <strong>to</strong> increase by an average of43 million a year <strong>to</strong> reach 1.8 billion 13 .Despite ongoing economic difficulties in many parts of the world, international <strong>to</strong>urismexpenditure in 2012 was marked by impressive growth from the world’s two largest emergingmarkets. China, the world’s third largest <strong>to</strong>urism spender, saw a surge of 42% in expenditureabroad in the first three quarters of 2012. At the same time, the strength of Russia’s economyand the increasing affluence of its citizens saw the country’s outbound expenditures grow by31%, making it the seventh largest <strong>to</strong>urism spender 14 .Although the highest growth rates in expenditure abroad among the <strong>to</strong>p ten markets came fromemerging economies, important traditional source markets showed particularly strong results.Australia saw its international travel expenditure increase by 5% in 2012. In Europe, despiteeconomic pressures, expenditure on international travel by <strong>to</strong>p spender Germany grew at 3%,while the UK increased by 5% after two flat years. France, on the other hand, registered adecline of 7% in outbound travel expenditure 15 .In Asia, Japan returned <strong>to</strong> growth with a 3% increase in international spending in 2012,after registering a decline of 11% the previous year following the March earthquake disaster.Likewise, both South Korea (2%) and India (8%) saw increases in travel spending abroad 16 .As for the Americas, the weak economy and high unemployment rates did not deterAmericans from travelling as the US saw a 7% growth in its international spending in 2012.For its part, Brazil’s international <strong>to</strong>urism expenditure also increased by 5% over last year 17 .Overall, despite a slow global economic recovery and continued volatility in Europe, 36 of the<strong>to</strong>p 46 international <strong>to</strong>urism spenders saw an increase in their outbound travel spending inthe first three quarters of 2012 compared <strong>to</strong> the same period of the previous year 18 . This is astrong indication of the <strong>to</strong>urism sec<strong>to</strong>r’s remarkable stability and potential for long-term growth.10UNWTO press release, “International <strong>to</strong>urism hits one billion”, December 12, 2012.11UNWTO <strong>Tourism</strong> Highlights, 2012 Edition.12UNWTO World <strong>Tourism</strong> Barometer, Volume 11, January 2013.13UNWTO <strong>Tourism</strong> Highlights, 2012 Edition.14UNWTO World <strong>Tourism</strong> Barometer, Volume 11, January 2013.15Ibid.16Ibid.17Ibid.18Ibid.<strong>Canadian</strong> <strong>Tourism</strong> Commission 2012 Annual Report 13
year in review<strong>Tourism</strong> Industry in CanadaCanada’s <strong>to</strong>urism sec<strong>to</strong>r is widely varied, ranging from small- and medium-<strong>size</strong>d enterprisesoperating in a single location <strong>to</strong> large, far-reaching corporations. It also includes marketingorganizations at the provincial, regional and destination levels, as well as <strong>to</strong>urism industry andtrade associations.<strong>Tourism</strong> is a key driver of Canada’s economy, creating jobs and earnings <strong>to</strong> all levels of government.It accounts for more than 608,500 jobs across the country, and in 2012, generated over $82 billionin <strong>to</strong>urism revenue. With over $15 billion of this coming in from international travellers, <strong>to</strong>urism isCanada’s number one service export 19 . In fact, out of 22 categories in 2011, leisure travel accountedfor nearly 17% of Canada’s international trade in services 20 .However, over the years, the industry has seen the contribution from international travellers<strong>to</strong> <strong>to</strong>urism revenue falling significantly. Since 2000, <strong>to</strong>urism revenue from outside Canada hasdropped from 35% <strong>to</strong> just below 19%. While this decline is largely attributed <strong>to</strong> diminished travelfrom the US market, this comes at a time when global receipts are growing exponentially, havingmore than doubled from under $500 billion in 2000 <strong>to</strong> over $1 trillion in the last decade 21 .At the same time, <strong>Canadian</strong>s are spending more when travelling abroad, contributing <strong>to</strong>Canada’s travel deficit. Ranked as the world’s sixth largest spender in 2011, Canada increasedits expenditure on outbound travel by 7% in 2012 22 , widening the gap between how much<strong>Canadian</strong>s are spending on international travel and how much Canada is bringing in.Table 1: Economic activity of <strong>to</strong>urism in Canada2010 2011 2012*Changefrom 2011Total <strong>to</strong>urism revenue:DomesticInternational$73.4 billion$58.5 billion$14.9 billion$78.7 billion$63.6 billion$15.1 billion$82.4 billion$67.0 billion$15.4 billion+5%+5%+2%<strong>Tourism</strong>’s contribution <strong>to</strong> Canada’s GDP $29.3 billion $31.1 billion $32.4 billion +4%Government revenue generated by <strong>to</strong>urism 23Federal portion$20.1 billion$9.0 billion$21.4 billion$9.6 billion$22.7 billion$10.2 billion+6%+6%Jobs supported through <strong>to</strong>urism spending 594,500 602,800 608,500 +1%Total travel deficit $14.2 billion $16.4 billion $17.8 billion +9%In 2011,<strong>to</strong>urism wasCanada’slargest serviceexport.Source: National <strong>Tourism</strong> Indica<strong>to</strong>rs, Quarterly estimates, Third quarter 2012, Statistics Canada.*CTC Research estimates.2319Table 376-0108 – International transactions in services, by category, quarterly (dollars), CANSIM (database), StatisticsCanada.20Ibid.21National <strong>Tourism</strong> Indica<strong>to</strong>rs, Quarterly estimates, Third quarter 2012, Statistics Canada.22UNWTO World <strong>Tourism</strong> Barometer, Volume 11, January 2013.23Government Revenue Attributable <strong>to</strong> <strong>Tourism</strong>, 2011, Statistics Canada.14 <strong>Canadian</strong> <strong>Tourism</strong> Commission 2012 Annual Report
year in reviewIn 2012, <strong>to</strong>tal receipts from overnight visi<strong>to</strong>rs from the CTC’s 10 leisure markets amounted <strong>to</strong>an estimated $3.7 billion, an increase of less than 2% since 2011. Losses from France, SouthKorea and the UK were offset by gains in arrivals and overall spending from Australia, Brazil,China, India, Japan and Mexico. A strong <strong>Canadian</strong> dollar coupled with sluggish economies inthe Eurozone gave way <strong>to</strong> a marked slowdown in arrivals <strong>to</strong> Canada from France and the UK, aswell as stagnant growth from Germany. Despite continuing recessionary conditions throughoutmuch of Europe and looming economic uncertainty globally, Canada still relies on the CTC’s coremarkets of Australia, France, Germany and the UK for almost 60% of overseas <strong>to</strong>urism revenue.In the case of South Korea, the loss in arrivals <strong>to</strong> Canada may be partially <strong>due</strong> <strong>to</strong> the market’sslowing export economy. As the world economy improves, it is expected that traveller spendingwill also increase.Table 2: Overnight arrivals <strong>to</strong> Canada (000s) and expenditure by CTC marketAustraliaBrazilChinaFranceGermanyIndiaJapanMexicoSouth KoreaUKTotal CTC marketsUS <strong>to</strong>talWorldArrivalsExpenditureArrivalsExpenditureArrivalsExpenditureArrivalsExpenditureArrivalsExpenditureArrivalsExpenditureArrivalsExpenditureArrivalsExpenditureArrivalsExpenditureArrivalsExpenditureArrivalsExpenditureArrivalsExpenditureArrivalsExpenditure2010 2011 2012*202$353 million71$134 million193$315 million408$527 million316$476 million150$145 million215$330 million116$157 million157$257 million661$811 million2,490$3.5 billion11,749$6.3 billion15,866$11.9 billion216$392 million75$139 million237$407 million422$544 million290$450 million163$163 million186$307 million125$177 million140$236 million623$796 million2,476$3.6 billion11,597$6.1 billion15,703$12.0 billion235$419 million81$152 million288$481 million421$543 million290$451 million171$163 million203$322 million133$186 million130$209 million599$751 million2,551$3.7 billion11,847$6.4 billion16,050$12.4 billionChange from2011+9%+7%+8%+9%+22%+18%–0.2%–0.1%-+0.2%+5%+0.2%+9%+5%+7%+5%–7%–11%–4%–6%+3%+2%+2%+4%+2%+4%Source: International Travel Survey, Statistics Canada.* CTC Research estimates.<strong>Canadian</strong> <strong>Tourism</strong> Commission 2012 Annual Report 15
year in reviewInternational travel <strong>to</strong> Canada is high value for the economy and drives increased competitiveinvestment and product development. As illustrated below, the yield from an overseas <strong>to</strong>uristis more than five times that of a domestic traveller, consistent with our strategy <strong>to</strong> focus onthose travellers who stay longer in Canada and spend more during their visits. Export <strong>to</strong>urism isstrategically important <strong>to</strong> Canada’s future competitiveness, and our continued focus will be oninternational markets that represent maximum potential for return on investment.Table 3: Per trip expenditure by travellers by CTC market2010 2011 2012*Australia $1,745 $1,816 $1,781Brazil $1,881 $1,863 $1,874China $1,630 $1,721 $1,670France $1,292 $1,288 $1,289Germany $1,509 $1,550 $1,555India $966 $997 $952Japan $1,532 $1,652 $1,588Mexico $1,356 $1,424 $1,399South Korea $1,630 $1,686 $1,609UK $1,228 $1,278 $1,253Total CTC markets $1,408 $1,459 $1,441Canada $270 $260 † $265US $532 $529 $518Sources: International Travel Survey and Travel Survey of Residents of Canada (TSRC), Statistics Canada.* CTC Research estimates.†Due <strong>to</strong> a change in the TSRC implemented for the 2011 reference year, the 2011 figure is not comparable <strong>to</strong> TSRCfigures from prior years.Competi<strong>to</strong>r PerformanceOver the past six decades, <strong>to</strong>urism has experienced continued expansion andhas become one of the largest and fastest growing economic sec<strong>to</strong>rs in theworld. Despite occasional shocks, the industry has seen virtually uninterruptedgrowth. Travel is rebounding in many parts of the world, and competi<strong>to</strong>rs see thisas an opportune time <strong>to</strong> enact travel policy changes and invest heavily in <strong>to</strong>urismmarketing and development. Additionally, for the first time, G20 leaders arerecognizing the importance of travel and <strong>to</strong>urism as a driver of jobs, growth andeconomic recovery.With international <strong>to</strong>urism a key priority for the US government, the establishmen<strong>to</strong>f a national <strong>to</strong>urism marketing agency and improvements in visa processing forselect countries are yielding positive effects for the US <strong>to</strong>urism industry. The countryexperienced a tremendous 18% boom in Brazilian travel in the first eight monthsof the year, having greatly improved its visa processing time for visi<strong>to</strong>rs from thatcountry from three months <strong>to</strong> just three weeks. Trips <strong>to</strong> the US grew from all CTCmarkets, with the exception of France and the UK which exhibited modest declines<strong>due</strong> <strong>to</strong> the depreciating euro and looming fiscal uncertainty.“We recognize therole of travel and<strong>to</strong>urism as a vehiclefor job creation,economic growth anddevelopment…”— G20 Leaders’ Declaration,June 201216 <strong>Canadian</strong> <strong>Tourism</strong> Commission 2012 Annual Report
year in reviewCanada similarly experienced decreased visitation from our traditional European markets of Franceand the UK, but continued <strong>to</strong> make improvements in the emerging/re-emerging markets of Brazil,India, Japan and Mexico. Over the last year, overnight arrivals <strong>to</strong> Canada from the CTC’s leisuremarkets increased 3%, exceeded by the US’ growth rate of 6.8% and slightly below Australia’s3.7% for the same markets.While the UK experienced an overall slight decline in arrivals in the first three quarters of 2012, itdid make a significant gain in the emerging market of China (+20%). This is also true for Canada(+22%), as well as competi<strong>to</strong>rs Australia (+16%) and the US (+39%). With a wealthier middleclass and the granting of Approved Destination Status <strong>to</strong> specific countries, including Canadaand the US, China’s outbound travel has grown accordingly. In fact, Chinese travel <strong>to</strong> long-hauldestinations beyond northeast Asia has nearly tripled over the last decade, and Canada along withkey competi<strong>to</strong>rs benefited from this surge through double digit growth in 2012. Going forward,long-haul travel will remain highly competitive with Australia, the US and European countriesinvesting heavily <strong>to</strong> attract Chinese travellers.The disastrous effects following the earthquake and tsunami in 2011 led <strong>to</strong> a sharp decline inoutbound travel by Japanese <strong>to</strong>urists. With the Japanese economy rebounding in 2012, travellersresumed their propensity for international travel from the previous year, enabling Canada (+9%),Australia (+6%), the US (+15%) and the UK (+7%) <strong>to</strong> experience renewed growth in this market.Table 4: Estimated overnight trips <strong>to</strong> Canada, Australia, the US and the UK in 2012 byCTC market (000s) and change from 2011Trips fromCanadaAustraliaUS (first 8months)*UK (first 9months)*Trips Change Trips Change Trips Change Trips ChangeAustralia 235 +9% - - 705 +6% 765 -14%Brazil 81 +8% 31 +6% 1,108 +18% 217 +0.5%China 288 +22% 626 +16% 1,031 +39% 139 +20%France 421 -0.2% 98 +4% 1,039 -1% 2,852 +4%Germany 290 - 155 +1% 1,240 +5% 2,198 -4%India 171 +5% 159 +7% 525 +7% 288 -1%Japan 203 +9% 354 +6% 2,435 +15% 205 +7%Mexico 133 +7% 5.4 † -3% † 9,117 +6% 65 +5%South Korea 130 -7% 197 -1% 841 +7% 117 -4%UK 599 -4% 594 -2% 2,467 -2% - -Total CTC markets 2,551 3% 2,190 4% 20,508 7% 6,846 -1%Sources: CTC Research estimates based on International Travel Survey, Statistics Canada; Visi<strong>to</strong>rs by country of residence,<strong>Tourism</strong> Australia, December 2012; US Office of Travel and <strong>Tourism</strong> Industries, Monthly <strong>Tourism</strong> Statistics, August 2012; UK Officeof National Statistics, International Passenger Survey, third quarter, 2012.* Based on data available at time of publishing.†Forecasts by Oxford Economics, <strong>Tourism</strong> Decision Metrics, February 15, 2013.<strong>Canadian</strong> <strong>Tourism</strong> Commission 2012 Annual Report 17
year in reviewDespite economic uncertainty, <strong>to</strong>urism is one of the <strong>few</strong> sec<strong>to</strong>rs that continues <strong>to</strong> grow, drivingeconomic progress and fueling job creation. The world’s expanding middle class has led <strong>to</strong> asurge in the demand for travel <strong>to</strong> emerging and exotic destinations, eroding the shares of Westernand European destinations. In 1950, the <strong>to</strong>p 15 travel destinations accounted for 97% of theworld’s share of outbound travellers. Today, they account for just over half.Table 5: Canada’s competitive position, share of international <strong>to</strong>urist arrivalsRanking1950 1970 1990 2011Country Share Country Share Country Share Country Share1 USItalyFranceFrance2 Canada Canada US US3 Italy France Spain China4 France Spain Italy Spain5 Switzerland US Hungary Italy6 Ireland Austria Austria Turkey7 Austria Germany UK UK8 Spain 97% Switzerland 75% Mexico 67% Germany 56%9 Germany Yugoslavia Germany Malaysia10 UK UK Canada Mexico11 Norway Hungary Switzerland Austria12 Argentina Czechoslovakia Greece Russia13 Mexico Belgium Portugal Hong Kong14 Netherlands Bulgaria Malaysia Ukraine15 Denmark Romania Croatia ThailandOther 3% Other 25% Other 33% Other 44%Source: UNWTO.Canada’s own competitive position has declined from being a Top 10 destination in the worldin 1990 in terms of arrivals, <strong>to</strong> number 18 in 2011 24 . Similarly, Canada’s share of the lucrativeworld travel market has been waning steadily, falling from 3.3% in 1990 <strong>to</strong> 1.6% in 2011 25 . Overthe last two decades, there has been a global trend of mature destinations losing business<strong>to</strong> up-and-comers such as Turkey, China and Malaysia. The emergence of low-cost carriersand the ease of cross-border travel have facilitated enhanced access and mobility <strong>to</strong> differentregions of the world.The exposure <strong>to</strong> different cultures and exotic destinations is a lure for international enthusiasts witha strong propensity <strong>to</strong> travel. The burgeoning economies and greater discretionary spending ofthe middle classes in South America, Asia and Africa have also fueled the demand for internationaltravel. With the number of international travellers on the rise, this shift of travel consumption fromthe West <strong>to</strong> the East is expected <strong>to</strong> continue. In addition, as governments of many developingand emerging nations have recognized the economic benefits of international <strong>to</strong>urism, theirinvestments in <strong>to</strong>urism marketing have become a strategic focus, further weakening Canada’scompetitive position.24UNWTO World <strong>Tourism</strong> Barometer, Volume 11, January 2013.25UNWTO <strong>Tourism</strong> Highlights, 2000 and 2012 Editions.18 <strong>Canadian</strong> <strong>Tourism</strong> Commission 2012 Annual Report
year in reviewCTC Highlights of 2012The following are examples of activities the CTC under<strong>to</strong>ok over the course ofthe previous year that demonstrate advancement of our 2012-2016 corporateobjectives and priorities (see page 36).Newfoundland and LabradorNunavut© Barry Rogers© David Greer35 Million Direc<strong>to</strong>rsThe CTC asked <strong>Canadian</strong>s <strong>to</strong> take on the job of promoting their own country thispast summer when it put them in the direc<strong>to</strong>r’s chair <strong>to</strong> capture their favouritetravel experiences and destinations in Canada. <strong>Canadian</strong>s were asked <strong>to</strong> sharepho<strong>to</strong> and video footage of their most memorable experiences and locales fromcoast <strong>to</strong> coast <strong>to</strong> coast—footage that would intrigue and inspire internationaltravellers <strong>to</strong> explore Canada on their next holiday.The nationwide, user-generated content campaign, known as 35 MillionDirec<strong>to</strong>rs, set the CTC out on an inspiring journey <strong>to</strong> create a s<strong>to</strong>ry <strong>to</strong>ld from thepoint of view of those who know the country best—<strong>Canadian</strong>s—on what makesthem proud about their homeland, and why it’s the most exciting place on earthfor visi<strong>to</strong>rs <strong>to</strong> explore.After filtering through over 8,200 entries and 65 hours of footage, the CTCfeatured the most inspiring submissions in a two-minute broadcast videodesigned <strong>to</strong> whet the appetite of international travellers looking for unique andauthentic travel experiences. Originally launched on CTV’s Canada AM andTVA’s Salut Bonjour, the video is currently being used in marketing campaigns <strong>to</strong>provide a fresh glimpse of Canada’s regional and cultural diversity, and globallyhas amassed over 2.5 million YouTube views. The clever initiative gave <strong>Canadian</strong>sa chance <strong>to</strong> be a part of promoting their own country with pride and a sense offun, and supported a <strong>to</strong>urism industry that is integral <strong>to</strong> so many communitiesacross Canada.Every dollar theCTC invested in itsmeasured 2012Stampede-relatedconsumer advertisingcampaigns generatedapproximately $14 forthe <strong>Canadian</strong> <strong>to</strong>urismeconomy.Stampede2012 marked the 100 th anniversary of the Calgary Stampede. Recognizingthe significance of this his<strong>to</strong>ric miles<strong>to</strong>ne, the federal government, throughCanada’s Economic Action Plan, supported the landmark celebration with a$5 million investment for the CTC <strong>to</strong> increase awareness of the Stampede in keyinternational <strong>to</strong>urism markets. With his<strong>to</strong>rically low international visi<strong>to</strong>r attendanceand awareness of the signature event typically concentrated locally, the CTCleveraged the Stampede’s centennial celebrations <strong>to</strong> attract greater numbersof international travellers <strong>to</strong> Canada by showcasing the event through creativeadvertising, marketing via <strong>to</strong>ur opera<strong>to</strong>rs and travel agents, media attention,social media buzz and public relations.Showcasing the Stampede through targeted campaigns in key overseas marketsincreased international awareness of the event, and inspired foreign travellers<strong>to</strong> visit Canada. The CTC’s measured Stampede-related marketing activitiesreached over 141 million people, leading <strong>to</strong> over 8,900 travellers booking trips <strong>to</strong>Canada in the six months leading up <strong>to</strong> the centennial celebrations 26 . In terms ofeconomic impact, spending by these travellers equated <strong>to</strong> more than $9.2 million26Based on short-term results for the CTC’s Stampede-focused direct-<strong>to</strong>-consumer advertisingcampaigns in the UK, Germany, South Korea and Brazil, and promotional activities with <strong>to</strong>uropera<strong>to</strong>rs and travel agents.<strong>Canadian</strong> <strong>Tourism</strong> Commission 2012 Annual Report 19
year in reviewin <strong>to</strong>urism revenue for the <strong>Canadian</strong> economy. It also generated an estimated$2.8 million in government revenue, including $1.2 million in revenue for thefederal government, and supported 71 jobs for <strong>Canadian</strong> <strong>to</strong>urism businesses.With the boost from the Government of Canada’s investment, the CTC leveragedthe Calgary Stampede’s 100 th anniversary celebrations <strong>to</strong> bring about meaningfullegacies – cementing the Stampede’s stature as an international must-see event,and boosting Alberta’s and Canada’s pro<strong>file</strong> as a destination for global travellers.Both will bring lasting economic rewards <strong>to</strong> the country as a whole.Calgary, AlbertaCalgary, AlbertaSignature Experiences Collection ®From building sand castles in the monumental Athabasca Sand Dunes <strong>to</strong>following a gastronomic slalom course in Whistler, Canada offers world travellersexperiences that are anything but ordinary. It is exotic <strong>to</strong>urism experiences fromevery region of the country such as these that are featured in our SignatureExperiences Collection ® (SEC), a collection that differentiates Canada from thecompetition. By connecting emotionally with potential travellers, the SEC helpsCanada stand out in a crowded marketplace.A pillar in Canada’s Federal <strong>Tourism</strong> Strategy, the SEC helps eligible <strong>to</strong>urismbusinesses promote their product internationally, as members of the SECbecome the priority pool of <strong>to</strong>urism experiences from which we choose contentfor our marketing campaigns. The collection also provides export-ready contentthat <strong>to</strong>ur opera<strong>to</strong>rs and travel agents can include in their promotional materialsand Canada itineraries.In 2012, the SEC welcomed another outstanding 48 experiences in<strong>to</strong> itscollection, bringing the <strong>to</strong>tal pool <strong>to</strong> 163 since its launch in 2011 and furthercementing its reputation as the go-<strong>to</strong> source for truly authentic, <strong>Canadian</strong><strong>to</strong>urism experiences.Billed as the “GreatestOutdoor Show onEarth”, the CalgaryStampede lived up <strong>to</strong>its name when it set anew record attendancelevel in 2012. Over1.4 million peoplecelebrated the 100 thanniversary signatureevent – a 20% increaseover 2011.Athabasca Sand Dunes,SaskatchewanWhistler, British Columbia20 <strong>Canadian</strong> <strong>Tourism</strong> Commission 2012 Annual Report
year in reviewA night under the ice in Québec CityThere’s more than just a “Hazy Shade of Winter”<strong>to</strong> central and eastern Canada—visi<strong>to</strong>rs flock fromaround the world <strong>to</strong> enjoy the experiences thecoldest season brings.The unique design and beautiful sculptures of theHôtel de Glace in Québec City, QC are just someof the reasons this ice-hotel is part of our SignatureExperiences Collection ® . Boasting huge snow vaultsand crystalline ice sculptures, the hotel welcomesvisi<strong>to</strong>rs <strong>to</strong> experience a true Nordic adventure by spending the night under ice in one of its44 intimate rooms. Situated in an urban park surrounded by trees, this must-see attraction isconveniently located just 15 <strong>minutes</strong> away from ski resorts and down<strong>to</strong>wn.Since opening its doors in 2001, the authentic Hôtel de Glace has welcomed over half amillion people from around the world <strong>to</strong> experience its phenomenal work of art.Tonging and Shucking off the coas<strong>to</strong>f Atlantic CanadaExposing travellers <strong>to</strong> the real Canada is at theheart of a Prince Edward Island oyster farm’sTong and Shuck experience. Featured in our SEC,Future Seafoods invites visi<strong>to</strong>rs aboard an oysterdory at their farm in Salutation Cove <strong>to</strong> <strong>to</strong>ng for theseafood treats themselves and learn the skills ofoyster shucking.© <strong>Tourism</strong> PEI/John SylvesterInteracting with Atlantic Canada’s unique culture goes beyond enjoying the conventionallobster dinner or taking a scenic drive along the coast. Allowing visi<strong>to</strong>rs <strong>to</strong> mingle withinteresting islanders was the inspiration that encouraged the local family-run business<strong>to</strong> open up their fishing boats <strong>to</strong> travellers wanting <strong>to</strong> get up close and personal with theoyster fishing experience.<strong>Canadian</strong> <strong>Tourism</strong> Commission 2012 Annual Report 21
year in reviewTradeshows and media marketplacesThe CTC hosts a number of events every year <strong>to</strong> provide <strong>Canadian</strong> <strong>to</strong>urism industry partnerswith opportunities <strong>to</strong> connect with travel agents, <strong>to</strong>ur opera<strong>to</strong>rs and media from internationalmarkets. These shows include a popular format that matches <strong>to</strong>urism product buyers andsellers in one-<strong>to</strong>-one, business-<strong>to</strong>-business appointments. In the media marketplaces, one-<strong>to</strong>oneappointments also <strong>allow</strong> <strong>Canadian</strong> partners <strong>to</strong> meet with magazine, newspaper and onlineedi<strong>to</strong>rs, as well as with TV and radio producers from international markets <strong>to</strong> share their latestnews, ideas, projects and travel s<strong>to</strong>ries. Workshops, information booths and other networkingevents are also features of the marketplaces.In 2012, the CTC led the following tradeshows and marketplaces:AsiaAustraliaBrazilCanadaMexicoUSShowcase Canada-AsiaCanada CorroborreeShowcase Canada-BrazilRendez-vous Canada and GoMedia Canada MarketplaceConozca Canada and GoMedia MexicoCanada Media MarketplaceBusiness Events Canada (formerly Meetings, Conventions & Incentive Travel)Business Events Canada (BEC) is the CTC’s new brand platform for the internationalMeetings, Conventions and Incentive Travel program. This strategic change reflects thecontinuing importance of the meetings industry <strong>to</strong> Canada’s economy. Incentive travel andtravel pertaining <strong>to</strong> meetings and conventions attract close <strong>to</strong> two million visi<strong>to</strong>rs each year <strong>to</strong>Canada from our key markets of the US, France, Germany and the UK. This represents almost23% of all money spent by inbound overnight travellers, and equates <strong>to</strong> $1.8 billion. Canadais the number one location for outbound meetings business from the US, which accounts forabout $1.4 billion of this <strong>to</strong>tal spending 27 .The shift <strong>to</strong> BEC also highlights the crucial role that meetings play in bolstering Canada’sinternational business aims. Business events often provide delegates and visi<strong>to</strong>rs with theirfirst look at Canada and present a clear opportunity <strong>to</strong> build new relationships, generate newinvestment and offer future growth opportunities for the country.Going forward, BEC will sharpen its sales focus and align with the federal government’s GlobalCommerce Strategy. Priority sec<strong>to</strong>rs outlined in the Strategy will provide the business line uponwhich we will focus our tactical efforts. With an increased focus on business and economicdevelopment, we will show how meetings held in Canada can lure international delegates fromdifferent industries <strong>to</strong> invest in Canada’s economy and enhance Canada’s brand reputationaround the world.Where a fullbusiness dayis more thana day full ofbusiness.27CTC tabulations from Statistics Canada, International Travel Survey, 2011 Travel Characteristics.22 <strong>Canadian</strong> <strong>Tourism</strong> Commission 2012 Annual Report
year in reviewSocial mediaSocial media is an important element of the CTC’s overall marketing communications strategy.Our main objective of leveraging social media channels such as Facebook, Twitter, YouTube,Instagram and Tumblr is <strong>to</strong> stimulate more people <strong>to</strong> share their s<strong>to</strong>ries and experiences aboutCanada in order <strong>to</strong> drive consideration of Canada as a potential destination amongst a wideraudience. Our focus is <strong>to</strong> be present where travellers are speaking with travellers and supportingthe conversation.We enjoyed a lot of success with Instagram in terms of increasing cus<strong>to</strong>mer engagement in 2012.Instagram is ideal for showing what’s happening in Canada in the moment, and submissions inresponse <strong>to</strong> our call for user-generated content helped us build advocacy for Canada. Rather thantapping in<strong>to</strong> the CTC’s image library, engaging cus<strong>to</strong>mers <strong>to</strong> share their own content helps drivea sense of urgency for fellow consumers <strong>to</strong> visit now. Since we started in 2011, travellers haveshared more than 35,000 pho<strong>to</strong>s of Canada using the hashtag #ExploreCanada.2012 also saw us host our first ever Global Blogger familiarization <strong>to</strong>ur designed <strong>to</strong> enhanceintegrated media coverage of <strong>Canadian</strong> travel experiences. Nineteen influential internationalmedia and bloggers from our various markets travelled on themed itineraries across thecountry, with the objective of increasing positive pho<strong>to</strong> and s<strong>to</strong>ry sharing via this group’spersonal networks.Social media has <strong>allow</strong>ed us <strong>to</strong> cost-effectively build Canada’s <strong>to</strong>urism brand globally, and it willcontinue <strong>to</strong> be useful as a means of engaging influencers and consumers in two-way dialogue.Michael Bublé: “Home for the Holidays”In 2012 we partnered with Warner Brothers Music <strong>to</strong> influence and leverage content ininternational artist Michael Bublé’s Christmas special which was produced in Vancouver.The objective was <strong>to</strong> integrate destination content in<strong>to</strong> the NBC program and in<strong>to</strong> the singingsensation’s own social media platforms. With the influence of the CTC, the NBC primetime program featured various locations in Michael’s home <strong>to</strong>wn of Vancouver. We furtherproduced a “behind the scenes” video at these locations that resulted in over 40,000 viewsin the first <strong>few</strong> weeks of being posted <strong>to</strong> Michael’s YouTube channel. When the program airedin prime time on NBC, Michael tweeted live a variety of additional Vancouver and <strong>Canadian</strong>content <strong>to</strong> his 1.2 million followers.A promotion for the Christmas special was also broadcast in the UK across one of its largestradio networks. The <strong>Canadian</strong> crooner acted as guest DJ for the two-hour show, which wassyndicated across different UK radio stations <strong>to</strong> a potential audience of over 80,000 listeners.Thirty-second commercial spots featuring <strong>Canadian</strong> holiday-themed packages peppered theshow, providing consumers with a call <strong>to</strong> action <strong>to</strong> book travel <strong>to</strong> Canada.<strong>Canadian</strong> <strong>Tourism</strong> Commission 2012 Annual Report 23
year in reviewOngoing operational efficienciesThe CTC Board of Direc<strong>to</strong>rs expects us <strong>to</strong> conduct operations on the principle of efficiency asa matter of ongoing business. Efficiency is not a one-time event at the CTC; our managementworks <strong>to</strong> meet strict efficiency and program budget maximization goals as part of the overallperformance management of the organization. As a result, we continuously look <strong>to</strong> identifyopportunities <strong>to</strong> increase our operational efficiency, <strong>allow</strong>ing us <strong>to</strong> maximize the allocation of ourbudget <strong>to</strong> programming activities. Noteworthy examples include introducing a defined contributionpension program in 2006, and the strategic shift that began in 2010 which led <strong>to</strong> the reduction ofpermanent staff, the closure of five international offices, and the move <strong>to</strong> a hub structure enablingus <strong>to</strong> scale up or down with greater flexibility. Our lean and scalable business model <strong>allow</strong>s us <strong>to</strong>adapt quickly <strong>to</strong> changing market conditions and leverage new opportunities as they arise.The strategic shift also saw us cede leadership in the US Leisure market <strong>to</strong> our partners, andwe began directing our focus <strong>to</strong> where the Canada brand leads internationally. In 2012, wefinalized this exit by ceasing our media relations, public relations and social media activities in theUS, remaining active solely in the business events sphere and with our annual Canada MediaMarketplace event.In 2012, additional operational efficiency gains were attained through the introduction of a newsuite of cloud-based systems for internal business functions. The new suite replaces legacysystems that were outdated, complex and expensive <strong>to</strong> maintain. This move provides our staffwith the right <strong>to</strong>ols that are easy <strong>to</strong> use, and frees up additional resources which can be directed<strong>to</strong> marketing and sales activities.Most recently, the CTC Board Secretariat launched a new project entitled Paperless Board.The former process for the preparation of briefing material for in-person board meetings was amanual and time consuming one, and not considered a best practice among the CTC’s peerorganizations. By implementing new technology, briefing materials for board meetings are nowcompiled electronically, instilling greater efficiency and enabling ease of access <strong>to</strong> materialsthrough one common portal.24 <strong>Canadian</strong> <strong>Tourism</strong> Commission 2012 Annual Report
year in reviewMarketing Canada <strong>to</strong> the WorldTo achieve our goal of growing revenue for Canada’s <strong>to</strong>urism economy, we follow a strategyof focusing on markets where Canada’s <strong>to</strong>urism brand leads and yields the highest return oninvestment, while also tapping in<strong>to</strong> growth from new and emerging markets. Despite our exitfrom the US Leisure market, we remain active in the markets that account for more than 60% ofall international arrivals <strong>to</strong> Canada. By deepening our relationship with high-yield cus<strong>to</strong>mers—those who stay longer and spend more—we influence their travel decisions and increaseCanada’s <strong>to</strong>urism revenue even when arrivals are down. We track the incremental <strong>to</strong>urismrevenue generated from our measured direct-<strong>to</strong>-consumer advertising campaigns, promotionswith our travel trade partners, and confirmed bookings from business events based on atraveller’s average trip expenditure for a given market. The table below summarizes the impactsthat these activities in 2012 had on Canada’s economy:Table 6: Attributable results from CTC’s measured marketing activitiesDirect-<strong>to</strong>consumerAdvertising*Travel TradePromotionsBookedBusinessEventsConverted/booked travellers † 408,700 189,400 N/A 598,100<strong>Tourism</strong> export revenue $607 million $36 million $44 million $687 millionGovernment tax revenue $187 million $11 million $14 million $212 millionFederal tax revenue $80 million $5 million $6 million $90 millionJobs supported 4,483 263 327 5,073* Short-term results based on travel booked up <strong>to</strong> three months after campaign completion.†Refers <strong>to</strong> travellers influenced <strong>to</strong> visit Canada upon seeing a CTC campaign.TotalResults from direct-<strong>to</strong>-consumer advertisingDirect-<strong>to</strong>-consumer advertising is the most effective way <strong>to</strong> influence demand for Canada asa vacation destination. We partner with key private and public-sec<strong>to</strong>r <strong>to</strong>urism organizations onadvertising and marketing campaigns, and in 2012 engaged in integrated advertising campaignsusing television, cinema, print, and online mediums.To determine the relationship between advertising expenditures, campaign awareness, andsales that can be conservatively attributed <strong>to</strong> the marketing program, we evaluate the successof our direct-<strong>to</strong>-consumer marketing efforts through third-party administered advertisingevaluation and conversion studies 28 . A review of our study methodology in 2011 revealedpotential areas of improvement in the timing of when our studies are conducted. In essence,increasing the time delay between the campaigns and the subsequent advertising studies would<strong>allow</strong> for people in long-haul markets sufficient time <strong>to</strong> plan and make their trips. This wouldresult in a more fulsome evaluation of the campaigns’ impacts, and in 2012 we revised ourmethodology <strong>to</strong> <strong>allow</strong> for this change.An additional adjustment in our methodology relates <strong>to</strong> the frequency in which the evaluationsare conducted. Although the CTC currently engages in direct-<strong>to</strong>-consumer advertisingcampaigns in nine of our 10 leisure markets each year, it is cost-prohibitive <strong>to</strong> continueconducting an ad evaluation in each market annually. As a result, our direct-<strong>to</strong>-consumercampaigns are now studied on a rotating basis, with select markets evaluated each year 29 .28Studies are administered by Longwoods International.29In 2013, ad campaigns in China, France, Japan, Mexico and the UK will be evaluated, and the ad campaign inAustralia will be assessed in 2014.<strong>Canadian</strong> <strong>Tourism</strong> Commission 2012 Annual Report 25
year in reviewIn 2012, ad campaigns in Brazil, Germany, South Korea and the UK were assessed, andthe CTC extrapolated results for the remaining leisure markets where direct-<strong>to</strong>-consumercampaigns <strong>to</strong>ok place 30 .The following table outlines the short-term results for our 2012 direct-<strong>to</strong>-consumer campaigns.Results from the longer-term conversion phase of the study (conducted up <strong>to</strong> a year aftercampaigns end) will increase the overall results by including travellers who were motivated <strong>to</strong>visit Canada but <strong>to</strong>ok longer <strong>to</strong> book a trip. These final results will be available by summer 2013.Table 7: Short-term results from direct-<strong>to</strong>-consumer campaigns2012 Short-term ResultsConverted travellers 408,700Return on investment from marketing campaigns 56 : 1Attributable <strong>to</strong>urism export revenue$607 millionAttributable government tax revenue$187 millionAttributable federal tax revenue$80 millionAttributable jobs supported 4,483© <strong>Tourism</strong> Whistler-Mike CraneResults from travel trade promotionsThe CTC works directly with international travel companies <strong>to</strong> develop and sell Canada as avacation destination. Travel agents with a solid understanding of Canada’s <strong>to</strong>urism productsare more likely <strong>to</strong> influence consumers <strong>to</strong> visit Canada. The CTC engages in key travel tradeactivities—such as the Canada Specialist Program (www.canada.travel/csp)—<strong>to</strong> educate travelagents and <strong>to</strong>ur opera<strong>to</strong>rs on <strong>Canadian</strong> products and <strong>to</strong> encourage <strong>to</strong>ur opera<strong>to</strong>rs <strong>to</strong> includeCanada in their sales offerings. We also motivate existing <strong>to</strong>ur opera<strong>to</strong>rs <strong>to</strong> add more <strong>Canadian</strong>product and experiences <strong>to</strong> their catalogues, effectively increasing <strong>Canadian</strong> shelf space in thesupply chain.While only in our second year of measuring attributable results from travel trade promotions, weare able <strong>to</strong> estimate the level of <strong>to</strong>urism revenue generated as a direct result of our investmentsin promotional activities with the travel trade. These promotional activities through the traveltrade result in actual sales of <strong>Canadian</strong> travel and travel packages <strong>to</strong> travellers in each of ourleisure markets.© Banff Lake Louise <strong>Tourism</strong>/Paul ZizkaTable 8: Results from travel trade promotions2012 ResultsBooked travellers 189,400Return on investment from travel trade promotions 12 : 1Attributable <strong>to</strong>urism export revenue$36 millionAttributable government tax revenue$11 millionAttributable federal tax revenue$5 millionAttributable jobs supported 26330In 2013, this type of ROI extrapolation will only be necessary for Australia, as it will not be assessed until 2014.Going forward, since ad evaluation studies in our markets will be conducted on a rotating basis biennially,economic impact results will be aggregated and reported for only those markets where studies are conducted.© CN Tower26 <strong>Canadian</strong> <strong>Tourism</strong> Commission 2012 Annual Report
Year in ReviewResults from booked business eventsOur Business Events Canada program is designed <strong>to</strong> generate businessopportunities for various private- and public-sec<strong>to</strong>r <strong>Canadian</strong> partners, resulting inthe booking of meetings, conventions and incentive travel. Canada’s state-of-theartfacilities, high service levels, diverse destinations and distinctive niche productexperiences are promoted in key geographic and segment-specific markets <strong>to</strong>generate new business opportunities away from competing destinations. In theUS, our BEC initiatives position Canada as an attractive alternative <strong>to</strong> internationalmeeting and incentive destinations, offering the cachet of a foreign experiencewith the familiarity and ease of home.Ottawa, OntarioWe estimate the economic value generated through business events that werebooked in a given year. For each booked event, we determine the level ofattendee spending using industry-accepted benchmarks. The sum of attendeespending for all booked events for a given year is the economic value. For 2012,this economic value is $44 million. Additional results stemming from our BECactivities can be found in the table below.Table 9: Results from booked business events2012 ResultsReturn on investment from booked business events 11 : 1Attributable <strong>to</strong>urism export revenue$44 millionAttributable government tax revenue$14 millionAttributable federal tax revenue$6 millionAttributable jobs supported 327Toron<strong>to</strong>, OntarioSince 2011, the CTC has been reporting on the economic value of our BECprogram for a given year based on business opportunities presented in thesame year. As the conversion of a business opportunity in<strong>to</strong> a definite sale canbe a multi-year process, we have been underestimating, and therefore, underreporting,our attributable results and impacts on the broader <strong>to</strong>urism economy.Beginning in 2013, we will report on all business secured in a given year,regardless of the year when the opportunities materialized.The CTC’s measured marketing activities in 2012contributed $687 million in <strong>to</strong>urism revenue<strong>to</strong> the <strong>Canadian</strong> economy, and $212 million ingovernment revenue. Our work also supportedover 5,000 jobs in the <strong>to</strong>urism sec<strong>to</strong>r.Vancouver, British Columbia<strong>Canadian</strong> <strong>Tourism</strong> Commission 2012 Annual Report 27
Awards and Recognition in 2012The CTC prides itself on inventive marketing, and constantly looks for ways <strong>to</strong> gain a competitive edge in the global<strong>to</strong>urism marketplace. The following is a list of various awards presented <strong>to</strong> the CTC in 2012.Corporate AwardsFutureBrand’s Country Brand IndexIn 2012, FutureBrand’s Country Brand Index ranked Canada the No. 2country brand out of 113 countries. (Canada ranked No. 1 in 2010and 2011.) Canada improved in all seven <strong>to</strong>urism attributes, raisingCanada’s overall rank on the <strong>to</strong>urism dimension by seven places <strong>to</strong>No. 6. The report also cited Canada’s world-class ski resorts.Reputation Institute’s Country RepTrakReputation Institute’s 2012 Country RepTrak ranked Canada as thecountry with the best reputation in the world for the second year in arow, and as the world’s most recommended country <strong>to</strong> visit.Marketing and Public Relations AwardsAd and Design Club of Canada AwardsInteractive Agency of the Year awardGold award for Interactive Media,DigitalSilver award for Interactive Media,Business <strong>to</strong> ConsumerSilver award for Interactive Media,Best Use of Game MechanicsSilver for Advertising“Keep Exploring” integratedcampaign“Drop the Pin”“Keep Exploring” integratedcampaign“Keep Exploring” integratedcampaignApplied Arts’ Advertising & Interactive AwardsAdvertising Complete Ad CampaignInteractive Online Campaign“Keep Exploring” integratedcampaign“Keep Exploring”American Society of Association Executives Annual Meeting& ExpoBest in Show awardCTC pavilion<strong>Canadian</strong> e-<strong>Tourism</strong> Awards2 nd place for Best User-generatedContent“Tumblr Royally Curious”campaign3 rd place for Best Online Campaign “Hello Canada” campaign<strong>Canadian</strong> Marketing Association AwardsGold award for Digital, ConsumerServicesSilver award for Advertising,Consumer Services“Keep Exploring”“Keep Exploring”Tofino, British Columbia28 <strong>Canadian</strong> <strong>Tourism</strong> Commission 2012 Annual Report
awards and recognition in 2012Expedia Media SolutionsInnovation awardGlobal Times AwardsNo. 1 Overseas Travel Destinationaward“Upgrade <strong>to</strong> Canada”campaign in France andGermanyMarketing in ChinaHospitality Sales & Marketing Association InternationalAdrian AwardsGold award for Advertising“Keep Exploring”Gold award for Digital“Explore Canada Like a Local”Silver award for Digital“Keep Exploring” integratedcampaignPlatinum award for Public RelationsFeature Placement – TelevisionSilver award for Public RelationsCampaign Special EventLotus AwardsMerit for Best WebsiteMerit for Best Digital App/MobileMarketing AwardsFinalist, Integrated CampaignFinalist, Digital Website/MicrositesBringing NBC’s “TODAY”show <strong>to</strong> Montréal“Flirtation with Canada”campaign“Drop the Pin”“Keep Exploring”“Keep Exploring” integratedcampaign“Keep Exploring” websiteNorth American EffiesFinalist for Travel/<strong>Tourism</strong>/DestinationSina’s Golden Track AwardsBest DestinationTop Travel Magazine AwardsMarket Leader awardTravel Agents Choice AwardsLong haul destination of the year forsoft adventureTravel Bulletin Star AwardsStar Tourist Office for Incentives“Keep Exploring” integratedcampaign (2011)Marketing in ChinaMarketing in ChinaMarketing in the UK<strong>Canadian</strong> <strong>Tourism</strong>CommissionTravel Journalism Awards for ExcellenceMost Outstanding <strong>Tourism</strong>Marketing in AustraliaOrganization in Australia awardUK Travel Marketing AwardsGold award for Integrated Campaign “Keep Exploring” integratedcampaign (2011)Webby AwardsFinalist for <strong>Tourism</strong>“Explore Canada Like a Local”<strong>Canadian</strong> <strong>Tourism</strong> Commission 2012 Annual Report 29
Performance MeasurementPerformance measurement on an ongoing basisenables us <strong>to</strong> assess our progress on fulfilling our strategyand mission, and provides us with the information needed <strong>to</strong>guide our decision-making processes.Since 2008, the CTC has been using the BalancedScorecard (BSC) as our performance measurementframework. This strategy management <strong>to</strong>ol links objectives,performance measures and targets <strong>to</strong> our strategy at alllevels, and integrates financial with non-financial measures <strong>to</strong>provide a holistic view of our overall performance. Assessingperformance through five different perspectives (Shareholder& Stakeholder, Cus<strong>to</strong>mer, Budget and Finance, InternalOperations, and Workforce) enables us <strong>to</strong> maximize ourpotential <strong>to</strong> grow <strong>to</strong>urism export revenues for Canada.We measure organizational performance in relation <strong>to</strong> theexternal environment, but we also moni<strong>to</strong>r and adapt <strong>to</strong>the <strong>to</strong>urism economy. While the BSC contains a mixtureof CTC performance measures and <strong>to</strong>urism industryindica<strong>to</strong>rs, industry indica<strong>to</strong>rs are included for the purposesof moni<strong>to</strong>ring the overall health of the industry and reflect thecombined efforts of all members of the industry. Therefore,we do not set CTC targets for these measures.For 2012, the measures deemed most critical <strong>to</strong> achieving ourgoal of growing <strong>to</strong>urism export revenues for Canada were:• Attributable <strong>to</strong>urism export revenue;• Partner contributions; and• Employee engagement.As a result of our direct-<strong>to</strong>-consumer, travel trade andbusiness event activities, we are able <strong>to</strong> estimate the value of<strong>to</strong>urism export revenue generated for Canada that is directlyattributable <strong>to</strong> the CTC. In 2012, based on our direct-<strong>to</strong>consumeractivities and sales resulting from our travel tradepromotions and business events, the CTC generated anestimated $687 million for Canada’s <strong>to</strong>urism economy.Although this result is far below our 2012 target of generating$2.31 billion for the <strong>to</strong>urism economy, the result should beinterpreted with the following caveats in mind:1) The revised ad evaluation and conversion methodologyhas brought about greater controls <strong>to</strong> isolate the effec<strong>to</strong>f advertising on the purchase decision. Due <strong>to</strong> theincreased time delay (from three months <strong>to</strong> six months)between campaigns and the subsequent advertisingstudies, direct-<strong>to</strong>-consumer results are short-term only.The overall attributable <strong>to</strong>urism export revenue resultis expected <strong>to</strong> increase once longer-term conversionresults are available in summer 2013.2) The $2.31 billion target for 2012 was set in anticipationof federal appropriations being maintained at currentlevels. However, the reduction <strong>to</strong> the CTC’s core budgetthrough Budget 2012 resulted in decreased marketallocations <strong>to</strong> programming budgets.3) The $2.31 billion target for 2012 was set at the endof 2010 in consideration of 2010 results. Exceptionalperformance results were attained that year <strong>due</strong><strong>to</strong> improved global economic conditions and theheightened international awareness of Canada from the2010 Winter Olympic Games.Although 2012 ad campaigns in Brazil, Germany, SouthKorea and the UK were assessed and results wereextrapolated for the remaining leisure markets where direct<strong>to</strong>-consumercampaigns <strong>to</strong>ok place, this type of returnon investment (ROI) extrapolation will only be necessaryfor Australia in 2013, as it will not be assessed until 2014.Going forward, as ad evaluation studies in our marketswill be conducted on a rotating basis biennially, economicimpact results will be aggregated and reported for only thosemarkets where studies were conducted.In 2012, partner contributions <strong>to</strong>talled nearly $62 million($9.9 million in “cash” and $51.8 million in “non-cash”),resulting in a contribution ratio of 0.8 : 1 against ourappropriations of approximately $76 million and exceedingour target of 0.6 : 1. This result demonstrates the continuedrelevancy of our programs <strong>to</strong> partners.Our employee engagement index held steady at 74%,reflecting our employees’ belief in the CTC’s mission andvision and their commitment <strong>to</strong> the organization. This result iscomparable <strong>to</strong> industry standards.30 <strong>Canadian</strong> <strong>Tourism</strong> Commission 2012 Annual Report
performance measurement2012 Enterprise Balanced Scorecard Results2011 Result 2012 Target 2012 Result<strong>Tourism</strong> Industry Indica<strong>to</strong>rsShareholder & Stakeholder1.1 Objective: Increase demand for Canada’s visi<strong>to</strong>r economya <strong>Tourism</strong> export revenue $15.1 billion N/A $15.4 billion (est.)b <strong>Tourism</strong> GDP 2% N/A 2% (est.)c <strong>Tourism</strong> employment 602,800 N/A 608,500 (est.)d International <strong>to</strong>urist receipts from CTC’s markets $9.7 billion N/A $3.7 billion* (est.)e Average spend per person per night among CTC’s markets $105.62 N/A $80.48* (est.)CTC Performance MeasuresShareholder & Stakeholder1.2 Objective: Focus on markets where Canada’s <strong>to</strong>urism brand leads and yields the highest return on investmenta Marketing campaign ROI 37 : 1 75 : 1 56 : 1 †b Program ROI 11 : 1 35 : 1 N/A ‡c Number of people converted from direct-<strong>to</strong>-consumer advertising 322,818 686,700 408,700 †d Economic contribution of MC&IT program $61.5 million $189 million $44 millione Attributable <strong>to</strong>urism export revenue § $590 million $2.31 billion $687 million †f Attributable jobs created and/or maintained 4,781 20,478 5,073 †g Attributable federal tax revenue $78.2 million $305.8 million $90 million †1.3 Priority: Lead industry in international brand alignment and consistencya Partner brand alignment 82% 60% N/A b Partner satisfaction 89% 80% N/A 1.4 Priority: Advance a culture of innovation and entrepreneurial development among <strong>to</strong>urism businessesa Member advocacy of SEC program N/A Benchmark 83%Cus<strong>to</strong>mer2.1 Priority: Ensure cus<strong>to</strong>mer relevancy and differentiate Canadaa Aided destination awareness 33.4% 35% 35%b Aided destination consideration 71.4% 74% 78%c Country brand rank 1 Top 5 2Budget and Finance3.1 Priority: Foster organizational excellencea Partner contribution § 0.8 : 1 0.6 : 1 0.8 : 1b Proportion of budget allocated <strong>to</strong> programming 74.6% Min 70% 72%Internal Operations4.1 Priority: Foster organizational excellencea Systems effectiveness N/A 47% N/A**Workforce5.1 Priority: Foster organizational excellencea Core values index 69.3% 70% 66%b Employee engagement index § 74% 65% 74%* Reflects exit from US Leisure market.†Based on short-term conversion results; final results with longer-termconversions will be available by summer 2013.‡Upon further consideration, measure was deemed no longer relevant.§Critical metric.Data collected every two years through the Biennial Partner Survey;next survey in 2013.** Result not available as implementation of the applicable IT applicationswas delayed until late 2012.<strong>Canadian</strong> <strong>Tourism</strong> Commission 2012 Annual Report 31
performance measurementEnterprise Balanced Scorecard Measure Definitions1.1 a <strong>Tourism</strong> export revenueTotal spend by foreign visi<strong>to</strong>rs on <strong>Canadian</strong>produced<strong>to</strong>urism goods and services. Purchasesmay take place outside of Canada if a <strong>Canadian</strong>company supplies the goods or services (e.g.purchase of an airline ticket from a <strong>Canadian</strong>international carrier for travel <strong>to</strong> Canada). Source:National <strong>Tourism</strong> Indica<strong>to</strong>rs, Statistics Canada.1.1 b <strong>Tourism</strong> GDPUnduplicated value of production, within theboundaries of a region, of goods and servicespurchased by <strong>to</strong>urists, represented as a share of<strong>to</strong>tal GDP. Source: National <strong>Tourism</strong> Indica<strong>to</strong>rs,Statistics Canada.1.1 c <strong>Tourism</strong> employmentNumber of jobs generated, directly or indirectly,by <strong>to</strong>urism spending. It is based on an estimateof jobs rather than “hours of work.” Thus,someone who works 10 hours a week countsfor as much, by this measure, as someone whoworks 50 hours a week. Source: National <strong>Tourism</strong>Indica<strong>to</strong>rs, Statistics Canada.1.1 d International <strong>to</strong>urist receipts fromCTC’s marketsTotal spend by visi<strong>to</strong>rs from CTC’s key markets on<strong>Canadian</strong>-produced <strong>to</strong>urism goods and servicesduring stays of at least one night. Purchasesmay take place outside of Canada if a <strong>Canadian</strong>company supplies the goods or services (e.g.purchase of an airline ticket from a <strong>Canadian</strong>international carrier for travel <strong>to</strong> Canada). Source:International Travel Survey, Statistics Canada.1.1 e Average spend per person per nightamong CTC’s marketsMeasure of yield achieved from inbound visi<strong>to</strong>rsfrom CTC’s key markets, based on <strong>to</strong>tal tripspend and the number of nights spent in Canada.1.2 a Marketing campaign ROIValue of <strong>to</strong>urist receipts generated by CTC’score marketing campaigns per dollar spent <strong>to</strong>execute the campaign. This form of conversioncounts those individuals who were consideringtravelling <strong>to</strong> Canada but had not yet booked atrip prior <strong>to</strong> being exposed <strong>to</strong> the campaign, andwere positively influenced <strong>to</strong> visit or book a trip <strong>to</strong>Canada upon seeing the advertising.1.2 b Program ROIValue of <strong>to</strong>urist receipts generated by CTC’score marketing program (includes advertisingcampaigns, consumer shows, public and mediarelations, and trade development) per dollar spent<strong>to</strong> execute the program. This form of conversioncounts those individuals who were consideringtravelling <strong>to</strong> Canada but had not yet booked atrip prior <strong>to</strong> being exposed <strong>to</strong> the campaign, andwere positively influenced <strong>to</strong> visit or book a trip <strong>to</strong>Canada upon seeing the advertising.1.2 c Number of people convertedNumber of people who converted as a result ofCTC’s core marketing campaigns over those whorecalled the CTC core campaigns. Calculated asthe proportion of travellers who recalled seeingthe advertising against the <strong>size</strong> of the long-haulpopulation, aged 18 and over.1.2 d Economic contribution of MC&ITprogramThe attributable <strong>to</strong>urism export revenue forCanada generated as a result of CTC’s MC&ITleads conversion in<strong>to</strong> definite business, calculatedas: (<strong>to</strong>tal # of converted leads in<strong>to</strong> definitebusiness) x (average visi<strong>to</strong>r spending for meeting/travel type). Average spend data from DestinationMarketing Association International (DMAI).1.2 e Attributable <strong>to</strong>urism export revenueExport <strong>to</strong>urism revenue (see definition for 1.1a)that is attributable <strong>to</strong> CTC’s leisure travel, traveltrade and MC&IT activities.1.2 f Attributable jobs created and/ormaintainedThe estimated attributable employment from<strong>to</strong>urism revenue generated by CTC’s marketing,travel trade and MC&IT programs. Source:Statistics Canada data.1.2 g Attributable federal tax revenueEstimated attributable federal tax revenuegenerated by CTC’s marketing, travel tradeand MC&IT programs. Calculations are basedon CTC’s Advertising Tracking and ConversionStudies data and Statistics Canada’s GovernmentRevenue Attributable <strong>to</strong> <strong>Tourism</strong> indica<strong>to</strong>rs. Forevery $100 of international <strong>to</strong>urism revenue, thefederal government collects $13.11.1.3 a Partner brand alignmentPercentage of partners that have aligned with atleast one element of the CTC brand: visual identity(e.g. logo, colour palette, typography, patternbar graphics); <strong>to</strong>ne and writing style; experientialpho<strong>to</strong>graphy style; and/or assets (video, text,social media). Source: CTC’s Biennial PartnerSurvey.1.3 b Partner satisfactionPercentage of partners that are satisfied with theirrelationship with the CTC. Source: CTC’s BiennialPartner Survey.1.4 a Member advocacy of SEC programThe extent that <strong>Canadian</strong> <strong>to</strong>urism suppliersfeatured in the Signature Experiences Collection ®believe in the value of the program, andadvocate the program <strong>to</strong> other <strong>Canadian</strong> <strong>to</strong>urismbusinesses and suppliers within the industry.2.1 a Aided destination awarenessPercentage of long-haul travellers in CTCmarkets who rate their knowledge of vacationopportunities in Canada as “excellent” or “verygood” after having been prompted with a set ofpredetermined destinations.2.1 b Aided destination considerationPercentage of long-haul travellers in CTC marketswho are somewhat or very interested in visitingCanada in the next two years when promptedabout Canada among a set of competitivedestinations.2.1 c Country brand rankAnnual rank of country brands, according <strong>to</strong>the FutureBrand’s Country Brand Index. Theapproach incorporates a global quantitativesurvey, expert opinions and external statistics,which are compared and combined <strong>to</strong> betterunderstand drivers, preference, importance andrelativism of country brands.3.1 a Partner contributionRatio of <strong>to</strong>tal partner contributions (cash,in-kind, third party) versus CTC parliamentaryappropriations.3.1 b Proportion of budget allocated <strong>to</strong>programmingPercentage of the CTC’s <strong>to</strong>tal budget, exclusive ofpartner contributions, allocated <strong>to</strong> programming.Programming excludes overhead costs, operatingexpenditures and compensation.4.1 a Systems effectivenessEmployee satisfaction with the support providedby applicable IT applications, as measuredthrough the CTC’s annual Internal Survey.5.1 a Core values indexAverage value of three Employee Surveyquestions regarding how the company effectivelydemonstrates CTC’s core values of innovation,collaboration and respect.5.1 b Employee engagement indexAn index measuring an employee’s belief in theCTC’s mission and vision, and their commitment<strong>to</strong> the CTC as demonstrated through their hardwork, passion and organizational pride.32 <strong>Canadian</strong> <strong>Tourism</strong> Commission 2012 Annual Report
Corporate GovernanceConstitutionThe CTC is a federal Crown corporation wholly owned by the Government ofCanada (the “shareholder”). We are accountable <strong>to</strong> Canada’s Parliament throughthe Minister of Industry. By convention, the Minister of Industry has delegated hisduties and power related <strong>to</strong> the CTC <strong>to</strong> the Minister of State (Small Business and<strong>Tourism</strong>). The <strong>Canadian</strong> <strong>Tourism</strong> Commission Act, the Financial AdministrationAct (FAA) and subsequent regulations provide the legislative basis for theestablishment of the CTC and our activities. We are not governed by the PublicService Employment Act and are considered a separate employer. However, weare subject <strong>to</strong> the requirements of several acts, including:• Official Languages Act• Privacy Act• Access <strong>to</strong> Information Act• Canada Human Rights Act• Values and Ethics Code for thePublic Sec<strong>to</strong>r• Canada Labour Code• Employment Insurance Act• Multiculturalism Act• Employment Equity Act• Federal Accountability Act• Public Servants DisclosureProtection Act• Conflict of Interest Act• Alternative Fuels ActThe Government of Canada primarilyregulates Crown corporations throughits enabling legislation and the FAA.We are currently listed under Part I,Schedule III of the FAA, and as such, arerequired <strong>to</strong> submit an Annual Report,a Corporate Plan and an OperatingBudget <strong>to</strong> the responsible Minister,and undergo regular audits by theAudi<strong>to</strong>r General of Canada. A SpecialExamination is mandated under the FAAand a report on the findings must besubmitted <strong>to</strong> the Board of Direc<strong>to</strong>rs. Thenext examination is <strong>due</strong> in 2016.Aikens Lake Wilderness Lodge, Mani<strong>to</strong>ba33
Corporate GovernanceBoard of Direc<strong>to</strong>rsA 12-member Board of Direc<strong>to</strong>rs (currently two vacancies) oversees the management of the organization andholds management accountable for its performance. The Board, which also includes the President & CEO ofthe CTC, is composed of senior business professionals who possess the experience, competencies and skillsrequired <strong>to</strong> guide the CTC and help it deliver its strategic goals, seize opportunities and mitigate risks.The Chair of the Board and the President & CEO are appointed by the Governor-in-Council. The remainingdirec<strong>to</strong>rs are appointed by the Minister of Industry with the approval of the Governor-in-Council. The CTC Actnames the Deputy Minister of Industry as ex officio direc<strong>to</strong>r.The President & CEO is accountable <strong>to</strong> the Board of Direc<strong>to</strong>rs for the management and performanceof the organization. The Board is accountable <strong>to</strong> Parliament through the Minister of Industry. Theprimary vehicles for reporting <strong>to</strong> the Crown are the Annual Report and the five-year Corporate Plan,a summary of which is tabled annually in Parliament and available on the CTC corporate website athttp://en-corporate.canada.travel/about-ctc/corporate-reports.Board AccomplishmentsConsistent with recognized best practices, the Board conducted a board evaluation in 2012. The 2012 surveyresults are strongly positive.The CTC made advancements in various areas of board governance in 2012. The skills-focused board pro<strong>file</strong> wasupdated <strong>to</strong> ensure the right level and skills were reflected on the CTC Board. A further gap analysis identified areaslacking in the present board make-up and <strong>to</strong>ols such as a CTC Direc<strong>to</strong>r Recruitment Process and a database ofpotential direc<strong>to</strong>rs were established <strong>to</strong> support direc<strong>to</strong>r recruitment. The CTC Board also modernized its process in2012 by moving away from a paper board book system <strong>to</strong> an entirely paperless process.The CTC remains committed <strong>to</strong> reaching out and working with the <strong>to</strong>urism industry and has mechanisms inplace <strong>to</strong> ensure our engagement with industry, including:• The CTC’s advisory committees and their important role of providing strategic advice <strong>to</strong> the Board of Direc<strong>to</strong>rsand the President & CEO;• The provincial/terri<strong>to</strong>rial <strong>to</strong>urism Deputy Ministers’ forum that meets up <strong>to</strong> twice annually <strong>to</strong> ensure that alljurisdictions are current on the CTC’s activities and have the opportunity <strong>to</strong> provide input;• Regular meetings with the CTC’s destination marketing counterparts of provincial and terri<strong>to</strong>rial marketingorganizations, as well as with the Destination Marketing Association of Canada, an organization thatrepresents <strong>Canadian</strong> civic destination marketing;• The Export <strong>Tourism</strong> Council that meets up <strong>to</strong> twice annually and includes key industry leaders in the <strong>to</strong>urismexport business; and• Annual meetings with similar national <strong>to</strong>urism organizations with the objective of establishing best practicesand international benchmarks.In 2012, the CTC Board of Direc<strong>to</strong>rs met four times in person in different regions of the country and six times viaconference call. Attendance at these meetings averaged 86%.34 <strong>Canadian</strong> <strong>Tourism</strong> Commission 2012 Annual Report
Corporate GovernanceSteve AllanChair of the CTC Board ofDirec<strong>to</strong>rs andVice-President,Ernst & Young, Inc.Montie BrewerVice-Chair of the BoardWinchester, MACalgary, ABMichele McKenzie(ex officio direc<strong>to</strong>r)President and CEO,<strong>Canadian</strong> <strong>Tourism</strong>CommissionVancouver, BCJohn Knubley(ex officio direc<strong>to</strong>r)Deputy Minister,Industry CanadaOttawa, ONScott AllisonVice-President,<strong>Canadian</strong> Operations,Marriott Hotels of CanadaDavid JovanovicNiagara Falls, ONToron<strong>to</strong>, ONDray Ma<strong>to</strong>vicPresident,Halex Ventures Inc.Niagara Falls, ONAlexander RefordDirec<strong>to</strong>r,Les Jardins de Métis Inc.Grand-Métis, QCRod TaylorChief Executive Officer,Waste <strong>to</strong> Energy CanadaGeorge YoungHuntsville, OntarioWhitehorse, YK<strong>Canadian</strong> <strong>Tourism</strong> Commission 2012 Annual Report 35
Corporate GovernanceCommittees of the Board of Direc<strong>to</strong>rsIn 2012, the CTC Board of Direc<strong>to</strong>rs included the followingcommittees:Governance & Nominating Committee• Recommends the appointment of direc<strong>to</strong>rs <strong>to</strong> theMinister of Industry and moni<strong>to</strong>rs Board and committeeeffectiveness.Chair: Alexander RefordMembers: Steve Allan, George YoungAudit & Pension Committee• Oversees financial and management control systems,the administration and investment activities of the CTC’spension plans and internal audits.Chair: Steve Allan (Interim)Members: Scott Allison, Montie Brewer, Dray Ma<strong>to</strong>vicHuman Resources Committee• Reviews the Human Resources Strategic Plan, <strong>to</strong>talcompensation for executive employees, and successionplanning.Chair: Scott AllisonMembers: Steve Allan, Rod TaylorAdvisory Committee ChairsAccording <strong>to</strong> the CTC’s corporate bylaws, the Board ofDirec<strong>to</strong>rs may, from time <strong>to</strong> time, create advisory committeescomposed of such persons as it may deem necessary <strong>to</strong>advise it on any matters pertaining <strong>to</strong> the affairs of the CTC.In 2012, there were six CTC Advisory Committees chairedby and comprising <strong>to</strong>urism industry leaders and experts. Thecommittees take their direction from the Board (strategicdirections) and report <strong>to</strong> both the Board and the CEO. Inconsultation with the industry, the committees and the staffdevelop annual and multi-year strategic plans consistent withthe Board’s strategic direction for each program area.Brand Experiences CommitteeAndrew LindVice-President and General ManagerJonview CanadaCore Markets CommitteeChristena Keon Sirsly (until September 2012)David Whitaker (since September 2012)President & CEO<strong>Tourism</strong> Toron<strong>to</strong>Emerging Markets CommitteeMike RubyPresidentMuskoka Language International Inc.Meetings, Conventions, and Incentive TravelMarketing CommitteePatricia LyallPresident & CEODestination HalifaxResearch CommitteeStephen PearceVice-PresidentLeisure Travel & Destination Management<strong>Tourism</strong> Vancouver36 <strong>Canadian</strong> <strong>Tourism</strong> Commission 2012 Annual Report
Corporate GovernanceSenior Management CommitteeMichele McKenziePresident and Chief Executive OfficerMs. McKenzie joined the CTC in 2004 after serving as Deputy Minister of <strong>Tourism</strong>, Culture and Heritage for theProvince of Nova Scotia. She has held positions on a number of boards including the Nova Scotia Liquor Corporation,the Art Gallery of Nova Scotia and the Nova Scotia Museum. She is a member of the Institute of Corporate Direc<strong>to</strong>rs,serves on the Board of the Vancouver Community College Foundation, holds a Bachelor’s degree in CommercialRecreation / Marketing and conducted MBA studies at Dalhousie University.Chantal PéanSenior Vice-President, Corporate Affairs and Corporate SecretaryMs. Péan joined the CTC in 1991 and was appointed Vice-President of Corporate Affairs and Corporate Secretaryin 2000, and Senior Vice-President of Corporate Affairs and Corporate Secretary in 2003. She holds a Bachelor ofScience degree from the University of Mani<strong>to</strong>ba, and a Bachelor of Law, Notary Diploma (Droit notarial) and MBA fromthe University of Ottawa.Greg KlassenSenior Vice-President, Marketing Strategy and CommunicationsMr. Klassen joined the CTC in 2001 after having worked in marketing with both Telus and AT&T, and having taughtmarketing at Algonquin College in Ottawa. He was appointed Vice-President of Marketing in 2005, and Senior Vice-President of Marketing Strategy and Communications in 2008. He holds an MBA from Thunderbird, The AmericanGraduate School of International Management and a Bachelor’s degree in Economics from the University of Vic<strong>to</strong>ria.Lena BullockVice-President, Finance and Chief Financial OfficerMs. Bullock joined the CTC in 2005 as Executive Direc<strong>to</strong>r, Financial Operations, and was appointed Vice-President ofFinance and Chief Financial Officer in 2009. She has a Bachelor of Commerce from the University of British Columbiaand is a Chartered Accountant with extensive experience in the private sec<strong>to</strong>r, including work with KPMG, MolsonBreweries, Coca Cola Bottling Company and Blast Radius Inc.Charles McKeeVice-President, InternationalMr. McKee joined the CTC in 2009 as Vice-President, International, after having served with Air Canada for sevenyears, most recently as Vice-President, Marketing, based in Montreal. He has also worked with Virgin Atlantic Airwaysin London, the US and Asia, and served as Executive Vice-President of LastMinute.com, Europe’s largest online travelcompany. He holds an honours degree in East Asian Studies from Harvard University.Paul NurseyVice-President, Strategy and Corporate CommunicationsMr. Nursey joined the CTC in 2006 with over 10 years of <strong>to</strong>urism management experience, having worked withRocky Mountaineer Rail Tours, Mount Seymour Resorts and <strong>Tourism</strong> Vancouver. He was appointed Vice-President ofStrategy and Corporate Communications in 2010. He holds degrees in Economics and Regional Planning from SimonFraser University and a certificate in Executive Development in <strong>Tourism</strong> from the University of Hawaii at Manoa. He iscurrently conducting MBA studies at the University of Massachusetts Amherst.<strong>Canadian</strong> <strong>Tourism</strong> Commission 2012 Annual Report 37
Management Discussion and AnalysisThe following Management Discussion and Analysisshould be read in conjunction with the financial statementsand notes included in this annual report.Important Accounting EstimatesThe CTC’s significant accounting policies are describedin Note 2 of the financial statements. The preparation offinancial statements in conformity with <strong>Canadian</strong> publicsec<strong>to</strong>r accounting standards (“PSAS”) requires management<strong>to</strong> make estimates and assumptions. The most significantestimates involve the determination of employee futurebenefits, the useful lives for amortization of tangible capitalassets and fair values of asset retirement obligation.Corporate planningThe 2012-2016 Corporate Plan Summary established ourgoal, objectives and priorities for 2012. By focusing ourefforts on the strategy below, we worked <strong>to</strong> achieve ourmandate for the benefit of Canada’s <strong>to</strong>urism industry.Goal:• Grow <strong>to</strong>urism export revenues for Canada.Objectives:• Increase demand for Canada’s visi<strong>to</strong>r economy.• Focus on markets where Canada’s <strong>to</strong>urism brand leadsand which yield the highest return on investment.Priorities:• Ensure cus<strong>to</strong>mer relevancy and differentiate Canada.• Advance a culture of innovation and entrepreneurialdevelopment among <strong>to</strong>urism businesses.• Lead industry in international brand alignment andconsistency.• Foster organizational excellence.Panmure Island Provincial Park, Prince Edward Island38
Management discussion and analysisAnalysis of Financial Resultsa) Government fundingAs a federal Crown corporation, we receive an annual appropriation from ourshareholder, the Government of Canada. The CTC relies on this appropriation <strong>to</strong>fund the majority of our operating and capital costs.Appropriations provided <strong>to</strong> the CTC do not parallel financial reporting according<strong>to</strong> <strong>Canadian</strong> public sec<strong>to</strong>r accounting standards (“PSAS”) since appropriationsare primarily based on cash flow requirements. Consequently, items recognizedin the Statement of operations and the Statement of cash flows are notnecessarily the same as those provided through appropriations from Parliament.The Commission will have a deferred parliamentary appropriations balance atyear‐end when the appropriations received exceed expenses incurred. On theother hand, the Commission will have a parliamentary appropriations receivablebalance when expenses incurred exceed parliamentary appropriations received.Deferred or receivable appropriation balances reflect timing differences betweenrealized expenditures and cash appropriation receipts. The Commission doesnot have the authority <strong>to</strong> exceed approved appropriations. Under PSAS,parliamentary appropriations used <strong>to</strong> fund core operations and the acquisitionof tangible capital assets are recognized as income on a straight-line basis fromJanuary 1 <strong>to</strong> December 31. Parliamentary appropriations used <strong>to</strong> fund onetimefunded activities, such as the Calgary Stampede, are considered restrictedunder PSAS and are therefore recognized as income in the same period as therelated expenditures.110.0100.090.080.070.060.050.071.572.0 74.857.82013/14 2012/13 2011/12 2010/11BaseOne-time StimulusOne-time Comp adjustmentOne-time OlympicsOne-time Calgary StampedeOne-time Pension Transfer1.05.04.00.828.05.0Also, as the CTC has a different fiscal year end from the Government ofCanada, appropriations used by the CTC in a fiscal year are drawn from twofiscal periods of the government. For the year ended December 31, 2012, theCTC drew down $75.8M of appropriations approved from government fiscalperiods 2011–12 ($20.6M) and 2012–13 ($55.2M) (Note 9 of the financialstatements). Of these appropriations, $71.6M is related <strong>to</strong> base funding for coreoperations, $1.0M is one-time funding for the 2010 Olympics program, $2.2Mis one-time funding for the Calgary Stampede program and $1.0M is a onetimetransfer from Treasury Board Secretariat related <strong>to</strong> the transfer of pensionobligations for certain foreign staff.While the CTC has benefited from one-time special funding for specific activities,CTC’s base appropriations were once as high as $98.7M and have beenin steady decline over the years from efficiency reductions, strategic reviewreallocations and most recently the government’s efforts <strong>to</strong> return <strong>to</strong> balancedbudgets. Base funding (excluding the impact of any one-time funding), bygovernment fiscal year, was $74.8M in 2010/11, $72.0M in 2011/12, $71.5M in2012/13 and is $57.8M for 2013/14.<strong>Canadian</strong> <strong>Tourism</strong> Commission 2012 Annual Report 39
Management discussion and analysisb) Partnership revenuesAs the CTC is an organization that is committed <strong>to</strong> partnering with the industry,many programs are funded by both the CTC and industry partners. In somecases, the programs are led and managed by the partners. In these situations,funds would be paid <strong>to</strong> the partner for the CTC’s share of program costs. In otherinstances, the CTC manages the programs and the partners pay their share ofthe costs <strong>to</strong> the CTC; these “cash” contributions are recorded as revenue andreported as partnership contributions in our statement of operations. In 2012,the CTC recognized $9.9M of these types of partnership contributions, up from$8.0M in 2011 mainly <strong>due</strong> <strong>to</strong> higher participation in the UK, France and JapanSpring campaigns by provincial partners and new campaigns in 2012 “Canadafor the fun of it” and the Agri Food program.c) Other revenuesOther revenues consist mainly of commodity tax recoveries and interest revenue.Prime rates have dropped significantly since 2009, and as a result, interestrevenues have declined <strong>to</strong> less than half of the amount earned in 2008. In 2012,interest rates remained flat with the prior year and generated $214K in revenues,down $30K from the prior year. The reduction in revenues is <strong>due</strong> <strong>to</strong> carryinglower average bank balances.Partnership Revenues18.016.014.012.010.08.06.04.02.00.00.29.6CoreStimulus0.10.27.82012 2011 2010OlympicsStampede2.10.713.5The CTC engages various commodity tax recovery service providers whosuccessfully recovered $224K in commodity taxes mainly for Germany andJapan. These recoveries have been recognized as Other Revenues.d) Expenditures (excluding Amortization)Total expenditures (excluding amortization) have declined significantly yearover year, by $10.6M from 2011, most notably <strong>due</strong> <strong>to</strong> the impact of one-timefunded programs: Stimulus program, Olympics and Calgary Stampede. Overallexpenditures (excluding amortization) are $86.5M in 2012 ($97.1M in 2011), madeup of $81.7M Core, $2.1M Olympics and $2.7M Calgary Stampede spending.Marketing and sales spending is lower by $7.2M, mainly attributable <strong>to</strong> thereduction of one-time funded programs: there was no Stimulus spend in 2012 asthe program concluded in March 2011 ($5.8M in 2011), $2.9M lower spend forthe Olympics as this program concluded in March 2012. This was partially offsetby a modest increase in core activities of $1.2M and Calgary Stampede (onetimefunded activity which concluded in March 2012) of $300K.Overall costs are down significantly for Corporate Services and modestly forStrategy and Planning versus prior year, $3.5M and $34K respectively. Thisis a result of continued efforts <strong>to</strong> find efficiencies and cost savings in order <strong>to</strong>minimize the erosion of investment levels in Marketing and Sales. This alsoreflects the government’s efforts <strong>to</strong> return <strong>to</strong> balanced budgets. Significantcost reductions have been realized in the current year in compensation andoperational expenditures, such as rent, office expenses and travel.In millions of CADTotal Expenditures140.0120.0100.080.060.040.020.00.02.7 2.1CoreStimulus5.8 2.44.981.7 84.025.37.989.42012 2011 2010OlympicsCalgary Stampede40 <strong>Canadian</strong> <strong>Tourism</strong> Commission 2012 Annual Report
Management discussion and analysisEmployee future benefitsThe CTC offers a number of pension and benefit plans <strong>to</strong> its employees. These plans are bothcomplex in nature and expensive. Additional details of these pension plans are provided in Note8 of the financial statements.Transfer of pension obligations from Treasury BoardPrior <strong>to</strong> 2012, certain employees in our foreign locations accrued benefits under the PensionScheme for Employees of the Government of Canada Locally-Engaged Outside Canada (the“Prior Plan”), managed by the Treasury Board, for service prior <strong>to</strong> January 2, 2001. In 2011,the Treasury Board notified the CTC that effective January 1, 2012 they would no longer havefunding <strong>to</strong> reimburse the CTC for benefits accrued under the Prior Plan and that they intended<strong>to</strong> transfer the obligation <strong>to</strong> pay those benefits <strong>to</strong> the World Wide Plan (“WWP”), and thatthey would transfer an amount of assets <strong>to</strong> the CTC <strong>to</strong> fund this obligation. The transfer ofassets ($1.0M) was completed on April 5, 2012. As a result of the asset transfer, the CTC’saccrued benefit obligations and related expenses increased by $887K in 2012. The CTC is nowresponsible for managing the liquidity, currency and interest rate risks associated with thesefunds (which are held in bonds and money market funds) and ensuring that adequate funds areavailable as the obligations come <strong>due</strong>.Solvency reliefSince 2005, the CTC has contributed $5.9M in special payments <strong>to</strong> the <strong>Canadian</strong> definedbenefit pension plan <strong>to</strong> fund the going concern unfunded liabilities and solvency deficiencies.The most recent actuarial valuation as at December 31, 2011 reports a funding excess of$558K on a going concern basis and a shortfall of $9.2M on a wind up basis. The CTC doesnot receive any additional funding for these solvency special payments. The CTC has takenseveral steps <strong>to</strong> mitigate the financial burden:• The CTC established a defined contribution pension plan for <strong>Canadian</strong> excluded employeeshired on or after August 1, 2005 and for <strong>Canadian</strong> unionized employees hired on or afterAugust 1, 2005, effective March 8, 2007.• Since 2010, the CTC has taken advantage of relief measures offered through the SolvencyFunding Relief Regulations, 2009 (the “2009 Relief Regulations”), which <strong>allow</strong> the amount ofthe minimum special payments determined over a 10-year period (versus a 5-year period),thereby reducing the annual amount payable.• In 2011, the CTC began taking advantage of the amendments <strong>to</strong> the Pension BenefitsStandards Regulations, 1985 (the “Regulations”), released by the federal government inMarch 2011, which <strong>allow</strong> a Crown corporation <strong>to</strong> further reduce its annual solvency specialpayments up <strong>to</strong> an aggregate reduction of 15% of assets (under Section 9.16 of the PensionBenefits Standards Act, 1985, and in accordance with Section 9.2 and Subsections 9(13.3),9(13.4) and 9(13.5) of the Regulations.• In June 2012, the CTC submitted a request <strong>to</strong> the Department of Finance <strong>to</strong> withdraw fromthe 2009 Relief Regulations but continue under the 2011 amendments <strong>to</strong> the Regulations.As a result of the withdrawal, as required under subparagraph 19(1)(a)(ii) of the 2009 ReliefRegulations, the CTC contributed special payments of $438K in 2012.• The CTC intends <strong>to</strong> seek the maximum solvency relief under the 2011 amendments <strong>to</strong> theRegulations. The aggregate reduction in solvency special payments up <strong>to</strong> and including 2012is $1,353,000. The aggregate reduction does not exceed 15% of assets ($3,020,900) as atDecember 31, 2011.<strong>Canadian</strong> <strong>Tourism</strong> Commission 2012 Annual Report 41
Management discussion and analysis• During 2012, the CTC, along with its actuary, had numerous discussionswith representatives from the Office of Superintendent of Financial Institutions(“OSFI”) and the Department of Finance <strong>to</strong> ascertain the impact of thewithdrawal from the 2009 Relief Regulations on the funded position of theplan. As these discussions concluded only recently, the actuarial valuation forfunding purposes was finalized and <strong>file</strong>d with OSFI in February 2013.• Without the benefit of the solvency relief, the CTC would have been required <strong>to</strong>make special payments of $1.1M in 2012.Post-retirement benefit accounting errorWhile preparing the valuation of the post-retirement benefits for 2012, it wasidentified that the post-retirement benefit for certain US-based staff had not beenpreviously reported and that post-retirement benefits for certain <strong>Canadian</strong>-basedstaff should not have been previously reported. Both of these accounting errorshave been corrected retrospectively by restating prior period results. Refer <strong>to</strong>Note 3 of the financial statements for further details.Foreign exchangeThe CTC’s functional currency is the <strong>Canadian</strong> dollar, but it regularly transactsin multiple foreign currencies as it operates internationally. As a result, the CTCis exposed <strong>to</strong> fluctuations in foreign exchange rates. Transactions involvingforeign currencies are translated in<strong>to</strong> <strong>Canadian</strong> dollar equivalents using rates ofexchange in effect at the time of those transactions. Gains and losses resultingfrom foreign currency transactions are reported on the Statement of operationsas “Corporate services” and are considered an Operating expense. Monetaryassets and liabilities denominated in foreign currencies are translated in<strong>to</strong><strong>Canadian</strong> dollars at the rate of exchange in effect at year end with any resultingtranslation gain or loss being included in Statement of operations as “CorporateServices” and are considered an Operating expense.Over the past year, the foreign exchange rates of most currencies experiencedonly moderate variability. The CTC realized a foreign exchange gain ontransactions of $100K, mainly from the Euro and US dollar, and a loss ontranslation of $145K.Systems ProjectIn 2012, CTC completed the implementation of a new cus<strong>to</strong>mer relationshipmanagement <strong>to</strong>ol, financial and procurement systems, mass email marketing<strong>to</strong>ol, digital asset management system, balanced scorecard reporting <strong>to</strong>ol andthe upgrade of the existing payroll and benefits administration system. Each ofthe new systems is cloud-based and <strong>allow</strong>s the organization <strong>to</strong> be scalable. Thissignificant implementation effort was completed on time and below budget andalso secures significant on-going cost savings of over $500K annually.The final phase of the systems project will be completed in 2013, which includesa financial reporting <strong>to</strong>ol and a Human Resource Information system.42 <strong>Canadian</strong> <strong>Tourism</strong> Commission 2012 Annual Report
Management discussion and analysisProgram spend %100.0%90.0% 18.0% 15.3%20.0%80.0%10.0% 10.1%70.0%11.1%60.0%50.0%40.0%30.0%20.0%10.0%0.0%72.0%201274.6%2011*68.9%2010Program Opex Comp* 2011 restated (refer <strong>to</strong> Financial Statement Note 3)Program % metricThis key metric is defined as the percentage of spend dedicated <strong>to</strong> programspend (non-compensation and non-operating costs), and is indicative of theCTC’s goal of dedicating the highest possible portion of its budget <strong>to</strong> Program.This metric has replaced the Overhead percentage on the enterprise balancedscorecard beginning in 2012. In 2012, the CTC targeted <strong>to</strong> maintain a minimumof 70.0% of its <strong>to</strong>tal spend <strong>to</strong> program costs, an increasing challenge given thedecline in <strong>to</strong>tal budget. The actual metric achieved in 2012 was 72.0%, down2.6% from prior year.e) Tangible capital asset additionsTangible capital asset additions <strong>to</strong>talled $81K in 2012 ($431K in 2011). Thesecosts are down significantly over prior years as the CTC continues its efforts <strong>to</strong>reduce costs where possible.f) OutlookThe CTC will return <strong>to</strong> its core programming activities in 2013, without the benefi<strong>to</strong>f any one-time funded activities. The CTC will continue its efforts <strong>to</strong> meet thesavings identified under the government’s efforts <strong>to</strong> return <strong>to</strong> balanced budgetsand will finalize its final phase of the systems implementation project.<strong>Canadian</strong> <strong>Tourism</strong> Commission 2012 Annual Report 43
Management discussion and analysisRisks and uncertaintiesEnterprise Risk AssessmentAs part of its strategic management process, the CTC conducts an enterprise risk assessmentand uses the results of that assessment in the development of its five-year strategic plan and riskmitigation strategy. Risk mitigation action plans are developed and implemented accordingly.Beginning in 2011, CTC management performs the assessment internally on an annual basis, andupdates it as needed throughout the year. The latest assessment was completed in April 2012along with a risk mitigation action plan which is presented below. For the purposes of the AnnualReport, only those risks that fall under the direct control of CTC management <strong>to</strong> mitigate havebeen included here.Since the risk assessment presented in the CTC’s 2012-2016 Corporate Plan Summary, anumber of risks have been removed or effectively mitigated. For a complete list of these risks,<strong>please</strong> see the CTC’s 2012-2016 Corporate Plan Summary.Risk2012Rating2010RatingChangeOngoing Mitigation ActivitiesMarketing effectivenessEffectiveness of marketing strategyMaintain strong brand and agency; use of advanced path <strong>to</strong> purchasemodel; use of key BSC metrics (campaign ROI, partner survey); HRstrategy with a focus <strong>to</strong> recruit, develop and retain the right talent;focus on opportunities for integrating innovation (core value) in<strong>to</strong> ourcore business and measure against it; perform evaluations on resultsof conversion studies; use insights <strong>to</strong> inform decisions and focusefforts and resources.Strategic talent managementdevelopment & retention (previouslycalled Management development)Enhancement of leadership andmanagement skills and retentionDevelop behavioral interviewing <strong>to</strong>ols and techniques; continue midlevelmanagement training, leadership development, and successiondevelopment programs; implementation of retention strategy.Technology effectivenessSuccess of systems acquisition/replacement projectImplementation plan will be based on effective project managementmethodology, led by a Project Management Professional; continuemulti-disciplinary Systems Governance Committee; include systemseffectiveness as a corporate BSC metric.Cloud-based software(added July 2012)Risk that supplier contract does notcontain a fair distribution of risk (onesidedin supplier’s favour) which couldincrease risks <strong>to</strong> business continuity.New N/A N/AReduced flexible term; ensure insurance provisions are adequate;data will be independently backed up on a regular basis; data is keptin the Germany data centre of SAP which has a very high level ofrequirements for confidentiality and security; privacy schedule draftedby expert; external legal counsel <strong>to</strong> ensure compliance with <strong>Canadian</strong>regula<strong>to</strong>ry requirements.Low riskMedium riskMediumhighriskHigh risk44 <strong>Canadian</strong> <strong>Tourism</strong> Commission 2012 Annual Report
Management discussion and analysisInternal AuditThe CTC engages an external firm <strong>to</strong> carry out its Internal Audit function. The Internal Audi<strong>to</strong>rsact independently and report directly <strong>to</strong> the Audit Committee. The development of CTC’s annualinternal audit program is risk-based and incorporates the results of the enterprise risk assessmentand input from the Board of Direc<strong>to</strong>rs and key management personnel. In 2012, the internalaudi<strong>to</strong>r began several projects: Review of Management Expense Policies, Human ResourcesFollow-up Internal Audit (from 2009), and Systems Implementation Review. These projects will befinalized in early 2013. Management will develop and implement action plans in response <strong>to</strong> theinternal audi<strong>to</strong>r’s recommendations.Special examinationBudget Implementation Act 2009 amended Part X of the Financial Administration Act, wherebyextending the frequency of Special Examinations from every five <strong>to</strong> 10 years. The next SpecialExamination for the CTC is <strong>due</strong> in 2016.<strong>Canadian</strong> <strong>Tourism</strong> Commission 2012 Annual Report 45
Financial StatementsManagement responsibility statementThe management of the Commission is responsible for the performance of the duties delegated <strong>to</strong> it bythe Board of Direc<strong>to</strong>rs. These include the preparation of an Annual Report <strong>to</strong>gether with audited financialstatements. These statements, approved by the Board of Direc<strong>to</strong>rs, were prepared in accordance with <strong>Canadian</strong>public sec<strong>to</strong>r accounting standards appropriate in the circumstances. Other financial and operational informationappearing elsewhere in the Annual Report is consistent with that contained in the financial statements.Management maintains internal accounting control systems designed <strong>to</strong> provide reasonable assurance thatrelevant and reliable financial information is produced and that transactions comply with the relevant authorities.Management also maintains financial and management control systems and practices designed <strong>to</strong> ensure thetransactions are in accordance with Part X of the Financial Administration Act and regulations, the <strong>Canadian</strong><strong>Tourism</strong> Commission Act, and by-laws of the Commission. These systems and practices are also designed <strong>to</strong>ensure that assets are safeguarded and controlled, and that the operations of the Commission are carried outeffectively. In addition, the Audit Committee, appointed by the Board of Direc<strong>to</strong>rs, oversees the internal auditactivities of the Commission and performs other such functions as are assigned <strong>to</strong> it.The Commission’s external audi<strong>to</strong>r, the Audi<strong>to</strong>r General of Canada, is responsible for auditing the financialstatements and for issuing his report thereon.Michele McKenziePresident and Chief Executive OfficerLena BullockVice President, Finance andChief Financial OfficerMarch 21, 201346 <strong>Canadian</strong> <strong>Tourism</strong> Commission 2012 Annual Report
FINANCIAL STATEMENTS48 <strong>Canadian</strong> <strong>Tourism</strong> Commission 2012 Annual Report
FINANCIAL STATEMENTSStatement of Financial PositionAs at December 31 (000s)2012 2011 Restated(Note 3)Financial assetsCash and cash equivalents (Note 4)Accounts receivableGovernment of CanadaPartnership contributionsOtherPortfolio investments (Note 5)Accrued benefit asset (Note 8)$ 11,6759181,5653156364,991$ 17,055811708410-4,71120,100 23,695LiabilitiesAccounts payable and accrued liabilitiesTradeEmployee compensationGovernment of CanadaAccrued benefit liability (Note 8)Deferred parliamentary appropriations (Note 9)Deferred revenueAsset retirement obligation$ 6,9021,683336,6441,609598521$ 10,2322,63615,4672,94867082217,990 22,776Net financial assets 2,110 919Non-financial assetsPrepaid expenses and other assetsTangible capital assets (Note 7)2,1221,1151,8821,7113,237 3,593Accumulated surplus $ 5,347 $ 4,512Commitments and Contingencies (Notes 16 and 17)The accompanying notes form an integral part of these financial statements.Approved on behalf of the Board of Direc<strong>to</strong>rsSteve AllanDirec<strong>to</strong>rMontie BrewerDirec<strong>to</strong>r<strong>Canadian</strong> <strong>Tourism</strong> Commission 2012 Annual Report 49
FINANCIAL STATEMENTSStatement of Operations and Accumulated SurplusFor the year ended December 31 (000s)Budget 2012 2012 2011 Restated(Note 3)RevenuesPartnership contributionsOther$ 7,169562$ 9,865885$ 8,0055807,731 10,750 8,585ExpensesMarketing and sales (Note 11)Corporate servicesStrategy and planningAmortization of tangible capital assets74,62110,77658565677,5828,26561764084,77511,7156511,04686,638 87,104 98,187Net cost of operations before funding from theGovernment of CanadaParliamentary appropriations (Note 9)(78,907)76,241(76,354)77,189(89,602)85,884Surplus / (deficit) for the period (2,666) 835 (3,718)Accumulated surplus, beginning of period 4,512 8,230Accumulated surplus, end of period $ 5,347 $ 4,512The accompanying notes form an integral part of these financial statements.50 <strong>Canadian</strong> <strong>Tourism</strong> Commission 2012 Annual Report
FINANCIAL STATEMENTSStatement of Change in Net Financial AssetsFor the year ended December 31 (000s)Budget 2012 2012 2011 Restated(Note 3)Annual surplus / (deficit) $ (2,666) $ 835 $ (3,718)Acquisition of tangible capital assetsAmortization of tangible capital assetsNet disposition of tangible capital assets(200)656-(81)64037(431)1,04627456 596 642Effect of change in other non-financial assets(Increase) in prepaid expenses - (240) (396)- (240) (396)Increase / (decrease) in net assets (2,210) 1,191 (3,472)Net financial assets, beginning of period 919 4,391Net financial assets, end of period $ 2,110 $ 919The accompanying notes form an integral part of these financial statements.<strong>Canadian</strong> <strong>Tourism</strong> Commission 2012 Annual Report 51
FINANCIAL STATEMENTSStatement of Cash FlowsFor the year ended December 31 (000s)2012 2011Operating transactionsCash received from:Parliamentary appropriations used <strong>to</strong> fund operating and capital transactionsPartnersOther income$75,8509,046885$100,0459,72958085,781 110,354Cash paid for:Cash payments <strong>to</strong> suppliersCash payments <strong>to</strong> and on behalf of employees(76,826)(13,763)(89,601)(15,918)Cash (used in) / applied <strong>to</strong> operating transactions (4,808) 4,835Capital transactionsCash paid <strong>to</strong> acquire tangible capital assetsCash receipt on disposal of tangible capital assets(81)-(431)61Cash used in capital transactions (81) (370)Investing transactionsIncrease in portfolio investments (636) -Cash used in investing transactions (636) -Foreign exchange loss on cash held in foreign currency 145 233Net (decrease) / increase in cash during the period (5,380) 4,698Cash and cash equivalents, beginning of period 17,055 12,357Cash and cash equivalents, end of period $11,675 $17,055The accompanying notes form an integral part of these financial statements.52 <strong>Canadian</strong> <strong>Tourism</strong> Commission 2012 Annual Report
Notes <strong>to</strong> the Audited Financial StatementsDecember 31, 20121. Authority and objectivesThe <strong>Canadian</strong> <strong>Tourism</strong> Commission (the “Commission”) was established on January 2, 2001 under the <strong>Canadian</strong><strong>Tourism</strong> Commission Act (the “Act”) and is a Crown corporation named in Part I of Schedule III <strong>to</strong> the FinancialAdministration Act. The Commission is for all purposes an agent of her Majesty in right of Canada. As a result, allobligations of the Commission are obligations of Canada. The Commission is not subject <strong>to</strong> income taxes.As stated in section 5 of the Act, the Commission’s mandate is <strong>to</strong>:• sustain a vibrant and profitable <strong>Canadian</strong> <strong>to</strong>urism industry;• market Canada as a desirable <strong>to</strong>urist destination;• support a cooperative relationship between the private sec<strong>to</strong>r and the governments of Canada, the provincesand the terri<strong>to</strong>ries with respect <strong>to</strong> <strong>Canadian</strong> <strong>to</strong>urism; and• provide information about <strong>Canadian</strong> <strong>to</strong>urism <strong>to</strong> the private sec<strong>to</strong>r and the governments of Canada, theprovinces and the terri<strong>to</strong>ries.2. Significant accounting policiesThese financial statements have been prepared in accordance with <strong>Canadian</strong> public sec<strong>to</strong>r accountingstandards. Significant accounting policies are as follows:a) Parliamentary appropriationsThe Commission is mainly financed by the Government of Canada through parliamentary appropriations.Parliamentary appropriations used <strong>to</strong> fund core operations and the acquisition of tangible capital assets arerecognized as income on a straight-line basis from January 1 <strong>to</strong> December 31. Parliamentary appropriationsused <strong>to</strong> fund the 2010 Winter Olympic and Paralympic Games, Stimulus and 100th Anniversary of the CalgaryStampede programs were recognized as income in the same period as the related expenditures.As a result of the Commission’s year-end date (December 31) being different than the Government ofCanada’s year end date (March 31), the Commission is funded by portions of appropriations from twoGovernment fiscal years. Refer <strong>to</strong> Note 9.The Commission will have a deferred parliamentary appropriations balance at year-end when the fundingreceived for the period exceeds the appropriations recognized for the related fiscal period. On the other hand,the Commission will have a parliamentary appropriations receivable balance when appropriations recognizedexceed the funding received.The Commission does not have the authority <strong>to</strong> exceed approved appropriations.b) Partnership contributionsThe Commission conducts marketing activities in partnership with a variety of <strong>Canadian</strong> and foreignorganizations. Where the Commission assumes the financial risks of conducting a marketing activity,contributions received from a partnering organization are recognized in income when the related marketingactivity takes place. Partnership contributions received for which the related marketing activity has not yettaken place are recognized as deferred revenue.c) Other revenuesOther revenues consist of interest and other miscellaneous revenues. These items are recognized as revenuein the period in which the transaction or event occurred that gives rise <strong>to</strong> the revenue.<strong>Canadian</strong> <strong>Tourism</strong> Commission 2012 Annual Report 53
notes <strong>to</strong> the audited FINANCIAL STATEMENTSDecember 31, 2012d) Foreign currency translationMonetary assets and monetary liabilities denominated in foreign currencies are translated in<strong>to</strong> <strong>Canadian</strong>dollars at the applicable year-end exchange rate. Non-monetary assets and non-monetary liabilitiesdenominated in foreign currencies are translated in<strong>to</strong> <strong>Canadian</strong> dollars at his<strong>to</strong>rical exchange rates. Revenueand expense items are translated during the year at the exchange rate in effect on the date of the transaction.Amortization expenses of tangible capital assets are translated at his<strong>to</strong>rical rates <strong>to</strong> which the assetsrelate. Translation gains and losses are reported in expenses for the year under “Corporate services”. TheCommission does not hedge against the risk of foreign currency fluctuations.e) Portfolio investmentsPortfolio investments are measured at cost. Interest income related <strong>to</strong> these investments is calculated basedon the effective interest rate method.f) Prepaid expensesPrepaid expenses consists of program and operating expenses recognized as an expense based on the termof usage for items such as subscriptions or based on the event date of tradeshows.g) Tangible capital assetsTangible capital assets are recorded at cost less accumulated amortization and the amount of any writedownsor disposals. Tangible capital assets are amortized on a straight-line basis over the estimated useful lifeof the assets as follows:Leasehold improvementsOffice furnitureComputer hardwareComputer softwareRemaining term of lease5 years3 years5 yearsIntangible assets are not recognized in these financial statements.h) Deferred revenueDeferred revenue consists of deferred revenues from partnering organizations and deferred leaseholdinducements. The deferred revenues relating <strong>to</strong> partnering organizations are recognized as revenues basedon the event’s date or over the license period. The deferred revenues relating <strong>to</strong> leasehold inducements arerecognized as revenue over the term of the lease.i) Asset retirement obligationAsset retirement obligation consists of decommissioning costs for various office leases. The Commissionrecognized asset retirement obligations as a result of legal obligations <strong>to</strong> res<strong>to</strong>re leased office spaces back<strong>to</strong> their original states at the end of the lease term. Asset retirement obligations are measured initially atfair value, based on management’s best estimates, with the resulting amount capitalized in<strong>to</strong> the carryingamount of the related asset. The capitalized asset retirement cost is included in leasehold improvements andamortized on the same basis as the related asset. The amortization expense is included in determining the netcost of operations. Refer <strong>to</strong> Note 7.54 <strong>Canadian</strong> <strong>Tourism</strong> Commission 2012 Annual Report
notes <strong>to</strong> the audited FINANCIAL STATEMENTSDecember 31, 2012j) Employee future benefitsThe Commission offers a number of funded and unfunded defined benefit pension plans, other unfundeddefined benefit plans (which include post-employment benefits, post-retirement benefits and non-vestedsick leave), as well as defined contribution pension plans. The pension plans include statu<strong>to</strong>ry plans and asupplemental plan. Other benefit plans include post-employment severance benefits and post-retirementhealth, dental and life insurance benefits and non-vested sick leave. The defined benefit pension plans providebenefits based on years of service and average pensionable earnings at retirement. The Commission fundscertain pension plans annually based on actuarially determined amounts needed <strong>to</strong> satisfy employee futurebenefit entitlements under current benefit regulations. Cost of living adjustments are au<strong>to</strong>matically provided forretirees in accordance with Consumer Price Index increases.The costs and obligations of the defined benefit plans are actuarially determined using the projected benefitmethod prorated on service that incorporates management’s best estimates of the rate of employee turnover,the average retirement age, the average cost of claims per person, future salary and benefit levels, expectedreturn on plan assets, future medical costs, and other actuarial fac<strong>to</strong>rs. For the purposes of calculating theexpected return on plan assets, those plan assets are based on the market value.Past service costs arising from plan amendments are recognized in the years of which the plan amendmen<strong>to</strong>ccurred.Actuarial gains and losses are amortized over expected average remaining service lifetime (EARSL) of activeemployees. For 2012, this EARSL has been determined <strong>to</strong> be 8.9 years (10.4 years - 2011) for the RegisteredPension Plan for Employees of the Commission (“RPP”), 9 years (10 years - 2011) for the SupplementaryRetirement Plan for certain employees of the Commission (“SRP”), 15.3 years (15.4 years - 2011) for thePension Plan for Employees of the <strong>Canadian</strong> <strong>Tourism</strong> Commission in Japan, South Korea and China (“WWP”),17 years (18 years - 2011) for non-pension post-retirement benefits, 13 years (13 years - 2011) for severancebenefits and 13 years (13 years - 2011) for sick leave benefits.Employees working in the United Kingdom and the United States participate in the Department of ForeignAffairs defined benefit pension plans administered by the Government of Canada. The assets of these planscannot be allocated among participating employers, and as such, these plans are deemed “multi-employer”plans and accounted for as defined contribution plans. The Commission’s contributions <strong>to</strong> these plansreflect the full benefit cost of the employer. These amounts vary depending upon the plan and are basedon a percentage of the employee’s gross earnings. Contributions may change over time depending on theexperience of the plans since the Commission is required under present legislation <strong>to</strong> make adjustments forthe rate of contributions <strong>to</strong> cover any actuarial deficiencies of these plans. Contributions represent the <strong>to</strong>talpension obligations of the Commission for these employees and are charged <strong>to</strong> operations during the year inwhich the services are rendered.k) Measurement uncertaintyThe preparation of financial statements in accordance with <strong>Canadian</strong> public sec<strong>to</strong>r accounting standardsrequires management <strong>to</strong> make estimates and assumptions that affect the reported amounts of assets andliabilities at the date of the financial statements and the amounts of income and expense during the reportingperiods. Actual results could differ significantly from those estimates. The most significant estimates involvethe determination of employee future benefits, the useful lives for amortization of tangible capital assets andthe fair value asset retirement obligation.<strong>Canadian</strong> <strong>Tourism</strong> Commission 2012 Annual Report 55
notes <strong>to</strong> the audited FINANCIAL STATEMENTSDecember 31, 2012l) Future accounting changesPS 3410 Government TransfersIn March 2011, PS 3410 Government Transfers was revised and applies <strong>to</strong> fiscal periods beginning on orafter April 1, 2012. The Commission will adopt the revisions <strong>to</strong> this section effective January 1, 2013. TheCommission is assessing the financial impact upon adoption.PS 1201 Financial Statement Presentation, PS 2601 Foreign Currency Translation, PS 3041 PortfolioInvestments and PS 3450 Financial InstrumentsThese sections are all <strong>to</strong> be adopted in entirety effective fiscal years beginning on or after April 1, 2012. TheCommission will adopt the applicable standards for the fiscal year beginning January 1, 2013.Based on the existing operations, the financial statement impact in 2013 would be limited <strong>to</strong> the disclosureof remeasurement gains/losses for any realized and unrealized foreign exchange gains and losses on a newfinancial statement called the Statement of Remeasurement Gains and Losses.3. Restatement of prior period comparative financial statementsWhile undergoing the actuarial valuation of the Non-Pension Post-Retirement benefits, the following items wereidentified:• Post-retirement health, dental and life insurance benefits provided <strong>to</strong> locally engaged staff working in the UShad not been recorded in the previously issued financial statements for the year ended December 31, 2011.The correction of this error has been applied retrospectively by restating the prior period results.• Some <strong>Canadian</strong> employees are ineligible for post-retirement health benefits and the benefits should not havebeen recorded in the previously issued financial statements for the year ended December 31, 2011. Thecorrection of this error has been applied retrospectively by restating the prior period results.As a result of these changes (000s):• The Accrued benefit liability increased by $1,681 at December 31, 2011.• Marketing and sales expense decreased by $28 at December 31, 2011.• Corporate services expense decreased by $106 at December 31, 2011.• The opening accumulated surplus recorded at January 1, 2011 decreased by $1,815.• The closing accumulated surplus recorded at December 31, 2011 decreased by $1,681.4. Cash and cash equivalentsCash equivalents consist of a money market term deposit purchased on April 17, 2012.5. Portfolio investmentsThe Commission holds portfolio investments consisting of Provincial Governmental bonds purchased on April17, 2012 with maturity dates staggered between 2013 and 2031.56 <strong>Canadian</strong> <strong>Tourism</strong> Commission 2012 Annual Report
notes <strong>to</strong> the audited FINANCIAL STATEMENTSDecember 31, 20126. Foreign currency translationThe Commission is exposed <strong>to</strong> currency risk as a significant portion of its revenue and expenses are earned orincurred, and subsequently received or paid in currencies other than <strong>Canadian</strong> dollars. Currency risk arises <strong>due</strong><strong>to</strong> fluctuations in foreign exchange rates, which could affect the Commission’s financial results. The Commissiondoes not hedge against fluctuations in foreign exchange rates and accepts the operational and financial risksassociated with any such fluctuations.The undernoted accounts comprise the following currencies as at December 31, 2012 (000s):Currency Cash Accounts receivable Accounts payable andaccrued liabilitiesCurrencyunits<strong>Canadian</strong>equivalentCurrencyunits<strong>Canadian</strong>equivalentCurrencyunits<strong>Canadian</strong>equivalentAustralian Dollars<strong>Canadian</strong> DollarsChinese YuanEurosGreat Britain PoundsHong Kong DollarsJapanese YenMexican PesosSouth Korean WonUnited States Dollars5178,858927870454-1814748,789210$ 5348,8581461,146730-2446209152,22660525167-3,05192-119$ 162,2269533268-357-1182814,6333,5463046814720,726911113,8311,222$ 2904,6335594011,0966240701051,218Total <strong>Canadian</strong> equivalent $ 11,675 $2,798 $8,618Comprising:Trade and partnershipOtherEmployee compensationRelated party$ ----$1,565315-918$6,902-1,68333Total $11,675 $2,798 $8,618At December 31, 2012, if the above foreign currencies had strengthened (or weakened) by 10 percent againstthe <strong>Canadian</strong> dollar, with all other variables held constant, the net cost of operations would have increased byapproximately $60,000 ($8,913 - 2011).The amount of realized foreign exchange gains recorded under “Corporate services” on the statement ofoperations is $100,230 ($134,062 - 2011).<strong>Canadian</strong> <strong>Tourism</strong> Commission 2012 Annual Report 57
notes <strong>to</strong> the audited FINANCIAL STATEMENTSDecember 31, 20127. Tangible capital assets(000s)Cost of tangible capital assets,openingComputerHardware$ 972ComputerSoftware$416LeaseholdImprovements$3,634OfficeFurniture$544Decom-Leaseholds$8332012Total$6,399AcquisitionsDisposals65(727)-(259)14(22)2(17)--81(1,025)Cost of tangible capital assets,closing 310 157 3,626 529 833 5,455Accumulated amortization, opening 738 3282,526 459 637 4,688Amortization expense150563413558 640Disposals(727) (233)(14)(15)- (989)Accumulated amortization, closing 161 151 2,853 479 695 4,339Net book value $ 149 $ 6 $ 773 $ 50 $ 138 $1,116(000s)ComputerHardwareComputerSoftwareLeaseholdImprovementsOfficeFurnitureDecom-Leaseholds2011TotalCost of tangible capital assets,openingAcquisitionsDisposals$ 2,164166(1,358)$ 3,197-(2,781)$ 4,038233(637)$ 1,64532(1,133)$ 864-(31)$11,908431(5,940)Cost of tangible capital assets,closing 972 416 3,634 544 833 6,399Accumulated amortization,openingAmortization expenseDisposals1,837231(1,330)3,03871(2,781)2,597566(637)1,52369(1,133)559109(31)9,5541,046(5,912)Accumulated amortization, closing 738 328 2,526 459 637 4,688Net book value $ 234 $ 88 $ 1,108 $ 85 $ 196 $ 1,711Substantially all of the Commission’s tangible capital assets are located in Canada. There are no assets legallyrestricted for the purpose of settling asset retirement obligations.58 <strong>Canadian</strong> <strong>Tourism</strong> Commission 2012 Annual Report
notes <strong>to</strong> the audited FINANCIAL STATEMENTSDecember 31, 20128. Accrued benefit asset / liabilityThe Commission offers a number of employee future benefit plans covering its employees in Canada andabroad. The following table summarizes these plans and the benefits they provide:EmployeesCoveredCanadaChina, Japan andSouth KoreaUnited StatesUnited KingdomCanada, China,Japan, South Korea,US, UKName of the Plan Nature of the Plan Contribu<strong>to</strong>rs AccountingTreatmentRegistered Pension Plan for theFunded, Defined CTC and plan Defined BenefitEmployees of the <strong>Canadian</strong> <strong>Tourism</strong> Benefit Planmembers PlanCommission – Defined BenefitcomponentRegistered Pension Plan for theCombination of CTC and plan DefinedEmployees of the <strong>Canadian</strong> <strong>Tourism</strong> Defined Contribution members Contribution PlanCommission – Defined Contribution Plan and Group RRSPcomponentSupplementary Retirement Plan for Partly funded, Defined CTC and plan Defined BenefitCertain Employees of the <strong>Canadian</strong> Benefit Planmembers Plan<strong>Tourism</strong> CommissionNon-Pension Post-Retirement Benefit Unfunded, Defined CTC and plan Defined BenefitPlan for <strong>Canadian</strong> EmployeesBenefit Planmembers PlanPension Plan for Employees of the CTC Unfunded, Defined CTCDefined Benefitin China, Japan and South Korea Benefit PlanPlanQualified Pension Plan for U.S. Citizen Funded MultiemployerCTCDefinedEmployees Working in the U.S.DefinedContribution PlanBenefit PlanRegistered Pension Plan for <strong>Canadian</strong> Funded MultiemployerCTCDefinedCitizen Employees Working in the U.S.DefinedContribution PlanBenefit PlanNon-Pension Post-Retirement Benefit Unfunded, Defined CTC and plan Defined BenefitPlan for Certain U.S. Employees Benefit Planmembers Plan<strong>Canadian</strong> High Commission Locally Funded MultiemployerCTCDefinedEngaged Staff Pension SchemeDefinedContribution PlanBenefit PlanSeverance Benefits for certain <strong>Canadian</strong>and Locally Engaged EmployeesUnfunded, DefinedBenefit PlanCTCDefined BenefitPlanDefined contribution plansThe Commission established a defined contribution pension plan for non-unionized employees in Canada,hired on or after August 1, 2005. On January 30, 2007, the <strong>Canadian</strong> unionized employees of the Commissionagreed <strong>to</strong> participate in the defined contribution plan effective March 8, 2007. This decision impacted unionizedemployees hired on or after August 1, 2005.The <strong>to</strong>tal cost for the Commission’s defined contribution pension plans was $429,187 in 2012 ($451,747 - 2011).The Commission also participates in multi-employer defined benefit plans providing pension benefits <strong>to</strong>employees working in the United States and in the United Kingdom. These plans, <strong>to</strong> which contributions <strong>to</strong>taled$325,872 in 2012 ($240,429 - 2011), are accounted for as defined contribution plans.<strong>Canadian</strong> <strong>Tourism</strong> Commission 2012 Annual Report 59
NOTES TO THE AUDITED FINANCIAL STATEMENTSDecember 31, 2012Defined benefit plansCanadaThe Commission has a number of defi ned benefi t plans in Canada, which provide post-retirement and postemploymentbenefi ts <strong>to</strong> its employees.Effective January 2, 2004, pension arrangements include a registered pension plan as well as a supplementalarrangement, which provides pension benefi ts in excess of statu<strong>to</strong>ry limits. The Commission provides pensionbenefi ts based on employees’ years of service and average earnings at the time of retirement. The registeredpension plan is funded by contributions from the Commission and from the members. In accordance withpension legislation, the Commission contributes amounts determined on an actuarial basis and has the ultimateresponsibility for ensuring that the liabilities of the plan are adequately funded over time. The supplementalretirement plan liabilities arising on and after January 2, 2004 are funded on a pay-as-you-go basis.Post-retirement benefi ts include health, dental and life insurance benefi ts. The cost of these benefi ts is paid forby the Commission and the retirees.AbroadThe Commission has a number of defi ned benefi t plans for its locally engaged staff outside of Canada, whichprovide pension and severance benefi ts. The Commission provides retirement benefi ts based on employees’years of service and average earnings at the time of retirement. In accordance with pension legislation, theCommission contributes amounts determined on an actuarial basis <strong>to</strong> the plan and has the ultimate responsibilityfor ensuring that the liabilities of the plan (as they pertain <strong>to</strong> its employees) are adequately funded over time.Transfer of pension benefit obligation from Treasury Board SecretariatIn March 2012, the Commission received $1.0 million from Treasury Board Secretariat (“TBS”) relating <strong>to</strong> locallyengaged staff pension benefi ts under the Pension Scheme for Employees of the Government of Canada Locally-Engaged Outside Canada, 1996 for service prior <strong>to</strong> January 2, 2001. Prior <strong>to</strong> this, TBS had been reimbursingthe Commission for amounts related <strong>to</strong> the past service period. The funds are held by the Commission in bondsand money market funds and are recorded as Portfolio investments and Cash and cash equivalents.In 2012, the year of the transfer, the Commission has recorded $886,500 in past service costs related <strong>to</strong> thepension obligation transferred from TBS. The liability related <strong>to</strong> the pension obligation is now refl ected in theCommission’s fi nancial statements. The Commission continues <strong>to</strong> be responsible for the service accruing on andafter January 2, 2001.Severance benefitsSeverance benefi ts are provided for certain current employees in Canada, China, Japan, South Korea, UnitedStates and United Kingdom. The cost of the benefi ts is fully paid by the Commission. These plans are unfunded.Measurement date and date of actuarial valuationThe most recent actuarial valuation of the <strong>Canadian</strong> registered defi ned benefi t pension plan for funding purposeswas as at December 31, 2011. This report was required <strong>to</strong> be fi led with OSFI no later than June 30, 2012;however, <strong>due</strong> <strong>to</strong> discussions with OSFI regarding the impact of the relief regulations (see below), this report wasfi led on February 19, 2013.The going concern fi nancial position based on the most recent actuarial valuation showed a funding surplusof $557,700 (surplus of $706,900 - 2011). The valuation also identifi ed an average solvency ratio of 80.7%(85.5% - 2011).Under normal circumstances, the Commission would be required <strong>to</strong> make special payments over the fi veyears following the effective date of the valuation <strong>to</strong> eliminate any unfunded liability and any solvency shortfall.60 <strong>Canadian</strong> <strong>Tourism</strong> Commission 2012 Annual Report
notes <strong>to</strong> the audited FINANCIAL STATEMENTSDecember 31, 2012However, on June 12, 2009, the Federal Minister of Finance announced the coming in<strong>to</strong> force of the newSolvency Funding Relief Regulations, 2009 (“the Regulations”). As a result the Commission can continue <strong>to</strong>amortize the solvency deficiency over 10 years in accordance with the Regulations.On March 25, 2011, the federal government released the Regulations amending certain Regulations inforce in 2009 and made under the Pension Benefits Standards Act, 1985. Under these new regulations, theCommission may reduce its solvency special payments determined under the most recent funding actuarialvaluation of the plan <strong>file</strong>d with regula<strong>to</strong>ry authorities, if it notifies the appropriate Ministers that it intends <strong>to</strong> so.In 2011, the Commission received acknowledgement from the appropriate Ministers regarding its decision <strong>to</strong>reduce its solvency special payments until it reaches the maximum permitted aggregate reduction in solvencyspecial payments.During 2012, the Commission was governed by both the Regulations of 2009 and the updated Regulations asamended in 2011. Both of these relief regulations have different solvency special payment requirements. TheCommission has submitted a request <strong>to</strong> withdraw from the Regulations that came in<strong>to</strong> force in 2009 in order<strong>to</strong> be solely governed by the amended Regulations of 2011 but was required <strong>to</strong> meet the special paymentrequirements for 2012 of the 2009 Regulations. The Commission made special payments of $437,708 in 2012($333,800 – 2011) related <strong>to</strong> the 2009 Regulations. The Commission elected <strong>to</strong> reduce the solvency specialpayments in 2012 related <strong>to</strong> the 2011 Regulations <strong>to</strong> $0.Future special payments cannot be reasonably estimated until a new funding valuation is completed.The Commission measures its accrued benefit obligations and the market value of plan assets of its pensionplans and post-retirement non-pension benefits for accounting purposes at September 30 th of each year.Change in accrued benefit obligation (000s):PensionOther Benefit Plans2012 2011 2012 2011 Restated(Note 3)Accrued benefit obligation, beginning of yearCurrent period benefit cost (employer portion)Interest cost on average accrued benefit obligationPlan amendmentsEmployees’ contributionsBenefits paidActuarial loss / (gain)Past service (gain) / lossIncrease / (decrease) in accrued benefit obligation <strong>due</strong> <strong>to</strong>settlement$ 19,8433811,149-120(1,030)381905-$ 18,2363881,115-120(1,565)1,564-(15)$ 5,627244132(35)-(310)(275)--$ 4,985285154(246)-(514)962--Accrued benefit obligation, end of year $ 21,749 $ 19,843 $ 5,383 $ 5,627<strong>Canadian</strong> <strong>Tourism</strong> Commission 2012 Annual Report 61
notes <strong>to</strong> the audited FINANCIAL STATEMENTSDecember 31, 2012Change in plan assets (000s):PensionOther Benefit Plans2012 2011 2012 2011 Restated(Note 3)Market value of plan assets, beginning of year $ 20,345 $ 20,648 $ - $ -Actual return on plan assets net of actual investmentexpensesEmployer contributionsEmployee contributionsBenefits paid516120(1,030)1,345120(1,565)310-(310)514-(514)Market value of plan assets, end of year $ 22,057 $ 20,345 $ - $ -2,106(203)--Reconciliation of funded status:Detailed Pension Plan information (000s) 2012 2011Defined benefit component of Pension Plan for Employees of the<strong>Canadian</strong> <strong>Tourism</strong> CommissionAccrued benefit obligationPlan assets$ (18,187)20,918$ (17,520)19,276Surplus $ 2,731 $ 1,756Defined benefit component of the Supplementary Retirement Plan forCertain Employees of the <strong>Canadian</strong> <strong>Tourism</strong> CommissionAccrued benefit obligationPlan assets$ (2,394)1,139$ (2,025)1,070Deficit $ (1,255) $ (955)Pension Plan for Employees of the <strong>Canadian</strong> <strong>Tourism</strong> Commission in China,Japan and South KoreaAccrued benefit obligationPlan assets(1,168)-(298)-Deficit $ (1,168) $ (298)The accrued benefit obligation and market value of assets at year-end are the following amounts in respect ofplans that are either unfunded or not fully funded:Funded Status (000s) Pension Other Benefit Plans2012 2011 2012 2011 Restated(Note 3)Accrued benefit obligationPlan assets$ (3,562)1,139$ (2,323)1,070$ (5,383)-$ (5,627)-Funded status – deficit, end of year $ (2,423) $ (1,253) $ (5,383) $ (5,627)The plan assets at the end of 2012 and 2011 related <strong>to</strong> the Registered Pension Plan exceeds the accruedbenefit obligation. The accrued benefit obligation for the Supplementary Retirement Plan and the Pension Planfor Employees of the CTC in China, Japan and South Korea exceeds the plan assets at the end of 2012 and2011.62 <strong>Canadian</strong> <strong>Tourism</strong> Commission 2012 Annual Report
notes <strong>to</strong> the audited FINANCIAL STATEMENTSDecember 31, 2012Reconciliation of funded status <strong>to</strong> accrued benefit asset / (liability) (000s):PensionOther Benefit Plans2012 2011 2012 2011 Restated(Note 3)Funded status – surplus / (deficit), end of yearEmployer contributions during period from measurementdate <strong>to</strong> fiscal year endUnamortized actuarial losses$ 3084092,459$ 5021673,308$ (5,383)-565$ (5,627)-902Accrued benefit asset / (liability) $ 3,176 $ 3,977 $ (4,818) $ (4,724)The cumulative excess of pension contributions on the Registered Pension Plan over pension benefit cost isreported as an accrued benefit asset. The Supplementary Retirement Plan, the Pension Plan for Employeesof CTC in China, Japan, and South Korea, the post-retirement, post-employment benefits and sick leave arereported as an accrued benefit liability.Accrued Benefit Asset / (Liability) (000s) 2012 2011 Restated(Note 3)Registered Pension Plan for the Employees of the <strong>Canadian</strong> <strong>Tourism</strong> Commission $ 4,991 $ 4,711Total accrued benefit asset 4,991 4,711Defined benefit component of the Supplementary Retirement Plan for CertainEmployees of the <strong>Canadian</strong> <strong>Tourism</strong> CommissionPension Plan for the Employees of the CTC in China, Japan and South KoreaNon-pension Post Retirement Benefit PlanPost Employment Severance PlanPost Employment Non-Vested Sick Leave Plan(613)(1,202)(3,627)(1,061)(130)(416)(317)(3,462)(1,143)(119)Total accrued benefit liability $ (6,632) $ (5,458)Total net accrued benefit liability $ (1,642) $ (747)The <strong>to</strong>tal accrued benefit liability excludes a notional supplementary retirement plan for certain employees of theCommission. The notional supplement retirement plan was $12,321 in 2012 ($8,694 in 2011).The weighted-average asset allocation by asset category of the Commission’s defined benefit pension plans is asfollows:Asset Allocation 2012 2011Equity securitiesDebt securitiesReceivable from Government of Canada60%37%3%59%38%3%Total 100% 100%<strong>Canadian</strong> <strong>Tourism</strong> Commission 2012 Annual Report 63
notes <strong>to</strong> the audited FINANCIAL STATEMENTSDecember 31, 2012Net benefit cost recognized in the period (000s):Current period benefit costInterest cost(Gains) / losses arising from settlementAmortization of net actuarial loss / (gain)Immediate recognition of past service costsImmediate recognition of net actuarial lossTotalLess: employee contributionsRetirement benefits expensePensionOther Benefit Plans2012 2011 2012 2011 Restated(Note 3)$ 501 $ 508 $ 244 $ 285--132154-(15)--37322628887-(35)(246)---1681,760515403368(120)(120)--1,640395403368Interest cost on average accrued benefit obligationExpected return on average pension plan assets1,149(1,230)1,115(1,352)----Retirement benefits interest expense $ (81) $ (237) $ - $ -Total pension expense $ 1,559 $ 158 $ 403 $ 36864 <strong>Canadian</strong> <strong>Tourism</strong> Commission 2012 Annual Report
notes <strong>to</strong> the audited FINANCIAL STATEMENTSDecember 31, 2012Significant actuarial assumptions used are as follows (weighted average):Significant actuarial assumptions used are as follows(weighted average):Accrued benefit obligationDiscount rateRegistered Pension Plan for the Employees of the <strong>Canadian</strong><strong>Tourism</strong> CommissionDefined benefit component of the Supplementary Retirement Planfor Certain Employees of the <strong>Canadian</strong> <strong>Tourism</strong> CommissionPension Plan for the Employees of the CTC in China, Japan andSouth KoreaNon-pension post retirementPost employment severancePost Employment Non-Vested Sick Leave PlanRate of compensation increase<strong>Canadian</strong>Locally engagedPensionOther Benefit Plans2012 2011 2012 20116.10% 6.20%2.22% 2.68%1.53% 1.87%2.22% 2.68%1.53% 1.87%1.53% 1.87%3.38% 3.50% 3.38% 4.00%3.00% 4.50% 3.00% 4.50%Pension expenseDiscount rateRegistered Pension Plan for the Employees of the <strong>Canadian</strong><strong>Tourism</strong> Commission6.20%6.75%Defined benefit component of the Supplementary Retirement Planfor Certain Employees of the <strong>Canadian</strong> <strong>Tourism</strong> Commission2.68%3.27%Pension Plan for the Employees of the CTC in China, Japan andSouth Korea1.87%2.42%Non-pension post retirement2.68%3.27%Post employment severance1.87%2.42%Post Employment Non-Vested Sick Leave Plan1.87%2.42%Expected long-term rate of return on plan assetsRegistered Pension Plan for the Employees of the <strong>Canadian</strong><strong>Tourism</strong> Commission6.20%6.75%Defined benefit component of the Supplementary Retirement Planfor Certain Employees of the <strong>Canadian</strong> <strong>Tourism</strong> Commission3.10%3.38%Rate of compensation increase<strong>Canadian</strong>3.38%3.50%3.38%4.00%Locally engaged3.00%4.50%3.00%4.50%<strong>Canadian</strong> <strong>Tourism</strong> Commission 2012 Annual Report 65
notes <strong>to</strong> the audited FINANCIAL STATEMENTSDecember 31, 2012Assumed health care cost trend rate for other benefit plans:Net benefit costInitial health care trend rateUltimate health care trend rateYear ultimate rate reachedOther Benefit Plans2012 2011CDN US CDN US6.87% 9.00% 6.91%*4.48% 4.50% 4.48%*2030 2033 2029*Accrued benefit obligationInitial health care trend rateUltimate health care trend rateYear ultimate rate reachedOther Benefit Plans2012 2011CDN US CDN US6.50% 9.00% 6.87%*4.50% 4.50% 4.48%*2030 2033 2029** US health care cost trend rates are not available for 2011 as no valuation of the other benefit plans provided <strong>to</strong> locally engagedemployees residing in the US was completed for the 2011 year (Note 3).The effect on the accrued benefit obligation at the end of the year of a one percentage point increase inthe assumed health care cost trend rate would be an increase of $832,900 ($638,600 - 2011), and a onepercentage point decrease would be a decrease of $658,600 ($470,800 - 2011). The effect on the servicecost plus interest costs at the end of the year of a one percentage point increase in assumed health care costtrend rate would be an increase of $47,500 ($89,200 - 2011), and a one percentage point decrease would be adecrease of $36,000 ($63,800 - 2011).Total cash amountsTotal cash amounts for employee future benefits, consisting of cash contributed in the normal course ofbusiness by the Commission <strong>to</strong> its funded and unfunded defined benefit pension plans, cash payments directly<strong>to</strong> beneficiaries for its unfunded other benefit plans, cash contributed <strong>to</strong> its defined contribution plans andcash contributed <strong>to</strong> its multi-employer defined benefit plan is $1,135,516 ($1,471,666 - 2011). In addition, theCommission was required <strong>to</strong> make special monthly payments <strong>to</strong>taling $437,708 ($333,800 - 2011) <strong>due</strong> <strong>to</strong> thesolvency shortfall identified in the most recent actuarial valuation of the <strong>Canadian</strong> registered defined benefitpension plan for funding purposes as of December 31, 2011. The <strong>to</strong>tal cash amount is $1,573,224 ($1,805,466- 2011).Letter of CreditThe Commission has a registered retirement compensation arrangement for certain employees of the <strong>Canadian</strong><strong>Tourism</strong> Commission. The actuarial valuation completed September 2011 for the year commencing January 1,2012 was used <strong>to</strong> determine the face amount of the letter of credit during 2012. The value of the plan’s letterof credit, in place during 2012, is measured based on the estimated assets and liabilities for the year endingDecember 31, 2012. The estimated market value of the plan’s assets was $1,119,000 ($1,093,000 – 2011)and the estimated present value of the unfunded benefit obligation was $2,056,000 ($1,555,600 - 2011). Asat December 31, 2012, the amount of $1,487,000 ($1,143,000 – 2011) of the unfunded benefit obligation hasbeen secured by a letter of credit.66 <strong>Canadian</strong> <strong>Tourism</strong> Commission 2012 Annual Report
notes <strong>to</strong> the audited FINANCIAL STATEMENTSDecember 31, 20129. Parliamentary appropriationsThe schedule below reconciles the amount of funding available <strong>to</strong> the Commission during the year with theamount actually used in operations:(000s) 2012 2011Amounts provided for operating and capital expendituresAmounts voted:Main estimates 2011/12 (2010/11)Permanent frozen allotmentTreasury Board Vote 15Supplementary estimates BSupplementary estimates BSupplementary estimates C$ 76,033---5,0001,001$100,643(900)8228,000--Less portion recognized in prior yearAdjustment for restricted funds82,034(58,466)-108,565(81,147)(6)Amounts recognized in current year 23,568 27,412Amounts voted:Main estimates 2012/13 (2011/12)Supplementary estimates BBudget 2012 Spending Review72,033-(537)76,0335,000-Less portion <strong>to</strong> be recognized in following year71,496(17,875)81,033(22,561)Amounts recognized in the current year 53,621 58,472Parliamentary appropriations used for operations and capital in the year 77,189 85,884Amounts voted:Less portion of cash received during year71,496(55,231)81,033(61,414)Cash <strong>to</strong> be received in following quarter / yearParliamentary appropriations adjustment for restricted fundsParliamentary appropriations <strong>to</strong> be recognized in following quarter / year from current year16,265-(17,874)19,619(6)(22,561)Parliamentary appropriations receivable / (deferred) (1,609) (2,948)Parliamentary appropriations receivable / (deferred)Opening BalanceCash Received from Government Fiscal 2011/12 (2010/11)Cash Received from Government Fiscal 2012/13 (2011/12)Appropriations used for operations and capital in the year(2,948)(20,619)(55,231)77,18911,213(38,631)(61,414)85,884Ending Balance $ (1,609) $ (2,948)<strong>Canadian</strong> <strong>Tourism</strong> Commission 2012 Annual Report 67
notes <strong>to</strong> the audited FINANCIAL STATEMENTSDecember 31, 201210. Accumulated surplusThe surplus represents the excess of appropriations received over actual spend.11. Marketing and sales expensesThe Commission carries out its activities in a variety of countries around the world. These countries aresupported by the Commission’s Corporate Marketing and Sales units located at headquarters, includingE-Marketing, Brand Experiences, Research and Global Communications. Geographical information is as follows:(000s) 2012 2011 Restated(Note 3)Core (UK, France, Germany and Australia)Corporate MarketingEmerging markets (India, Brazil, Mexico, Japan, South Korea and China)US$ 24,54321,62421,8719,544$ 30,22422,26121,30010,990$ 77,582 $ 84,77512. Expenditure by objectThe following is a summary of expenditures by object:(000s) 2012 2011 Restated(Note 3)ProgramAdvertisingPublic and media relationsConsumer developmentTrade developmentResearch$ 6,31510,57627,25417,7822,841$ 13,40810,96824,02717,8718,45264,768 74,726Salaries and benefitsOperating ExpenseOtherRentTravelProfessional services13,7073,7921,6141,3691,21413,6534,3561,8461,3461,2147,989 8,762Amortization 640 1,046$ 87,104 $ 98,18768 <strong>Canadian</strong> <strong>Tourism</strong> Commission 2012 Annual Report
notes <strong>to</strong> the audited FINANCIAL STATEMENTSDecember 31, 201213. 2010 Winter Olympic and Paralympic GamesOn Oc<strong>to</strong>ber 18, 2007, the Treasury Board of Canada approved $26 million of one-time funding <strong>to</strong> support theCommission in delivering programs related <strong>to</strong> the 2010 Winter Olympic and Paralympic Games. These fundswere utilized over a five year period ending March 31, 2012. As at December 31, 2012, the Commission has fullydrawn the $26 million ($1 million – 2012).For the year ended December 31, 2012, the Commission incurred costs related <strong>to</strong> the 2010 Winter Olympic andParalympic Games as follows:(000s) 2012 2011RevenuePartnership contributionsExpensesMarketing and Sales$ 752,069$ 2024,924Total $ 1,994 $ 4,72214. StimulusIn Budget 2009, the Treasury Board of Canada approved $40 million of one-time funding for the Commission($20 million for each of the 2009/10 and 2010/11 government fiscal years) as part of a greater stimulus packagewhich formed Canada’s Economic Action Plan. In 2010, the Commission received an additional $8 million for the2010/11 government fiscal year. The Commission’s stimulus strategy included approval for a domestic revenueadvertising program and activities in international priority markets. These programs concluded in March 2011.For the year ended December 31, 2012, the Commission received no revenue ($25,000 – 2011) and incurredno costs for marketing and sales ($5,185,000 – 2011) and no costs for corporate services ($644,000 – 2011),related <strong>to</strong> the stimulus program.15. 100 th Anniversary of the Calgary StampedeIn September 2011, the Treasury Board of Canada approved $5 million of one-time funding for the Commission<strong>to</strong> promote the 100 th anniversary of the Calgary Stampede in key international <strong>to</strong>urism markets. These fundswere fully utilized at March 31, 2012.For the year ended December 31, 2012 the Commission incurred net marketing and sales costs of $2.6 millionrelating <strong>to</strong> the Stampede ($2.4 million – 2011).16. CommitmentsThe Commission has entered in<strong>to</strong> various agreements for marketing and consulting services and leases for officepremises and equipment in Canada and abroad. The <strong>to</strong>tal commitments of the Commission as at December 31,2012 are $33.7 million ($30.2 million – 2011).(000s)2013 2014 2015 2016 2017 Sub<strong>to</strong>tal 2018-2019 Total18,626 9,396 4,645 714 270 33,651 4 $33,655<strong>Canadian</strong> <strong>Tourism</strong> Commission 2012 Annual Report 69
notes <strong>to</strong> the audited FINANCIAL STATEMENTSDecember 31, 201217. ContingenciesIn the normal course of business and as a result of the Commission’s restructuring activities in 2010, variousclaims and lawsuits have been brought against the Commission. Where in the opinion of management, losses,which may result from the settlement of the matters, are determinable within a reasonable range and suchlosses were considered by management as likely <strong>to</strong> be incurred, they would be charged <strong>to</strong> expenses. In theevent management concludes that potential losses are indeterminable, no provision has been recognized inthe accounts of the Commission. Due <strong>to</strong> the confidential and sensitive nature of the claims and lawsuits, theCommission cannot disclose any information regarding the potential losses.70 <strong>Canadian</strong> <strong>Tourism</strong> Commission 2012 Annual Report
© Government of Yukon/Fritz MuellerTombs<strong>to</strong>ne Terri<strong>to</strong>rial Park, Yukon
© <strong>Tourism</strong> PEI/John Sylvester© Government of YukonDerek Crowe© Newfoundland and Labrador <strong>Tourism</strong>© His<strong>to</strong>ric Reesor Ranch/Thomas Sbampa<strong>to</strong><strong>Canadian</strong> <strong>Tourism</strong> CommissionSuite 1400, Four Bentall Centre1055 Dunsmuir StreetVancouver, BC V7X 1L2Canadawww.canada.travel© 2013 <strong>Canadian</strong> <strong>Tourism</strong> CommissionLibrary and Archives Canada Cataloguing in Publication<strong>Canadian</strong> <strong>Tourism</strong> CommissionAnnual Report 2012 / <strong>Canadian</strong> <strong>Tourism</strong> CommissionIssued also in French under title: Rapport annuel 2012Catalogue numbers:Paper: Iu82-2012EPDF: Iu82-2012E-PDF1481-35561493-5767