Management's Discussion and Analysis of Financial ... - Wal-Mart
Management's Discussion and Analysis of Financial ... - Wal-Mart
Management's Discussion and Analysis of Financial ... - Wal-Mart
- No tags were found...

Create successful ePaper yourself
Turn your PDF publications into a flip-book with our unique Google optimized e-Paper software.
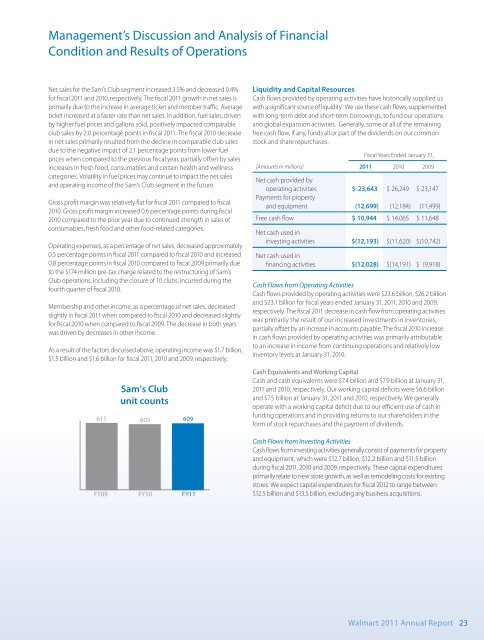
Management’s <strong>Discussion</strong> <strong>and</strong> <strong>Analysis</strong> <strong>of</strong> <strong>Financial</strong>Condition <strong>and</strong> Results <strong>of</strong> OperationsNet sales for the Sam’s Club segment increased 3.5% <strong>and</strong> decreased 0.4%for fiscal 2011 <strong>and</strong> 2010, respectively. The fiscal 2011 growth in net sales isprimarily due to the increase in average ticket <strong>and</strong> member traffic. Averageticket increased at a faster rate than net sales. In addition, fuel sales, drivenby higher fuel prices <strong>and</strong> gallons sold, positively impacted comparableclub sales by 2.0 percentage points in fiscal 2011. The fiscal 2010 decreasein net sales primarily resulted from the decline in comparable club salesdue to the negative impact <strong>of</strong> 2.1 percentage points from lower fuelprices when compared to the previous fiscal year, partially <strong>of</strong>fset by salesincreases in fresh food, consumables <strong>and</strong> certain health <strong>and</strong> wellnesscategories. Volatility in fuel prices may continue to impact the net sales<strong>and</strong> operating income <strong>of</strong> the Sam’s Club segment in the future.Gross pr<strong>of</strong>it margin was relatively flat for fiscal 2011 compared to fiscal2010. Gross pr<strong>of</strong>it margin increased 0.6 percentage points during fiscal2010 compared to the prior year due to continued strength in sales <strong>of</strong>consumables, fresh food <strong>and</strong> other food-related categories.Operating expenses, as a percentage <strong>of</strong> net sales, decreased approximately0.5 percentage points in fiscal 2011 compared to fiscal 2010 <strong>and</strong> increased0.8 percentage points in fiscal 2010 compared to fiscal 2009 primarily dueto the $174 million pre-tax charge related to the restructuring <strong>of</strong> Sam’sClub operations, including the closure <strong>of</strong> 10 clubs, incurred during thefourth quarter <strong>of</strong> fiscal 2010.Membership <strong>and</strong> other income, as a percentage <strong>of</strong> net sales, decreasedslightly in fiscal 2011 when compared to fiscal 2010 <strong>and</strong> decreased slightlyfor fiscal 2010 when compared to fiscal 2009. The decrease in both yearswas driven by decreases in other income.As a result <strong>of</strong> the factors discussed above, operating income was $1.7 billion,$1.5 billion <strong>and</strong> $1.6 billion for fiscal 2011, 2010 <strong>and</strong> 2009, respectively.611Sam’s Clubunit counts605609FY09 FY10 FY11Liquidity <strong>and</strong> Capital ResourcesCash flows provided by operating activities have historically supplied uswith a significant source <strong>of</strong> liquidity. We use these cash flows, supplementedwith long-term debt <strong>and</strong> short-term borrowings, to fund our operations<strong>and</strong> global expansion activities. Generally, some or all <strong>of</strong> the remainingfree cash flow, if any, funds all or part <strong>of</strong> the dividends on our commonstock <strong>and</strong> share repurchases.Fiscal Years Ended January 31,(Amounts in millions) 2011 2010 2009Net cash provided byoperating activities $ 23,643 $ 26,249 $ 23,147Payments for property<strong>and</strong> equipment (12,699) (12,184) (11,499)Free cash flow $ 10,944 $ 14,065 $ 11,648Net cash used ininvesting activities $(12,193) $(11,620) $(10,742)Net cash used infinancing activities $(12,028) $(14,191) $ (9,918)Cash Flows from Operating ActivitiesCash flows provided by operating activities were $23.6 billion, $26.2 billion<strong>and</strong> $23.1 billion for fiscal years ended January 31, 2011, 2010 <strong>and</strong> 2009,respectively. The fiscal 2011 decrease in cash flow from operating activitieswas primarily the result <strong>of</strong> our increased investments in inventories,partially <strong>of</strong>fset by an increase in accounts payable. The fiscal 2010 increasein cash flows provided by operating activities was primarily attributableto an increase in income from continuing operations <strong>and</strong> relatively lowinventory levels at January 31, 2010.Cash Equivalents <strong>and</strong> Working CapitalCash <strong>and</strong> cash equivalents were $7.4 billion <strong>and</strong> $7.9 billion at January 31,2011 <strong>and</strong> 2010, respectively. Our working capital deficits were $6.6 billion<strong>and</strong> $7.5 billion at January 31, 2011 <strong>and</strong> 2010, respectively. We generallyoperate with a working capital deficit due to our efficient use <strong>of</strong> cash infunding operations <strong>and</strong> in providing returns to our shareholders in theform <strong>of</strong> stock repurchases <strong>and</strong> the payment <strong>of</strong> dividends.Cash Flows from Investing ActivitiesCash flows from investing activities generally consist <strong>of</strong> payments for property<strong>and</strong> equipment, which were $12.7 billion, $12.2 billion <strong>and</strong> $11.5 billionduring fiscal 2011, 2010 <strong>and</strong> 2009, respectively. These capital expendituresprimarily relate to new store growth, as well as remodeling costs for existingstores. We expect capital expenditures for fiscal 2012 to range between$12.5 billion <strong>and</strong> $13.5 billion, excluding any business acquisitions.<strong>Wal</strong>mart 2011 Annual Report 23