Functional Safety
Functional Safety
Functional Safety

You also want an ePaper? Increase the reach of your titles
YUMPU automatically turns print PDFs into web optimized ePapers that Google loves.
White Paper<br />
Tino Vande Capelle, Dr. M.J.M. Houtermans<br />
<strong>Functional</strong> <strong>Safety</strong>: A Practical Approach<br />
for End-Users and System Integrators<br />
In order to carry out a probability or frequency calculation the following information is<br />
required:<br />
� A reliability model per loop<br />
� The reliability data for all equipment in the loop<br />
5.1 Reliability modeling<br />
A reliability model needs to be created for each loop of the safety system. There are<br />
different techniques available in the world to create reliability models. Well known<br />
techniques include:<br />
� Reliability block diagrams<br />
� Fault tree analysis<br />
� Markov analysis<br />
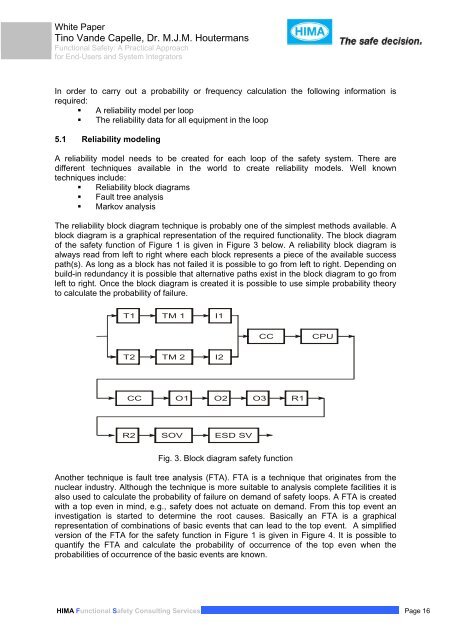
The reliability block diagram technique is probably one of the simplest methods available. A<br />
block diagram is a graphical representation of the required functionality. The block diagram<br />
of the safety function of Figure 1 is given in Figure 3 below. A reliability block diagram is<br />
always read from left to right where each block represents a piece of the available success<br />
path(s). As long as a block has not failed it is possible to go from left to right. Depending on<br />
build-in redundancy it is possible that alternative paths exist in the block diagram to go from<br />
left to right. Once the block diagram is created it is possible to use simple probability theory<br />
to calculate the probability of failure.<br />
T1<br />
T2<br />
TM 1<br />
TM 2<br />
I1<br />
I2<br />
CC CPU<br />
CC O1 O2 O3 R1<br />
R2 SOV ESD SV<br />
Fig. 3. Block diagram safety function<br />
Another technique is fault tree analysis (FTA). FTA is a technique that originates from the<br />
nuclear industry. Although the technique is more suitable to analysis complete facilities it is<br />
also used to calculate the probability of failure on demand of safety loops. A FTA is created<br />
with a top even in mind, e.g., safety does not actuate on demand. From this top event an<br />
investigation is started to determine the root causes. Basically an FTA is a graphical<br />
representation of combinations of basic events that can lead to the top event. A simplified<br />
version of the FTA for the safety function in Figure 1 is given in Figure 4. It is possible to<br />
quantify the FTA and calculate the probability of occurrence of the top even when the<br />
probabilities of occurrence of the basic events are known.<br />
HIMA <strong>Functional</strong> <strong>Safety</strong> Consulting Services Page 16