THE MERLIN MEASURING - Transport for Development
THE MERLIN MEASURING - Transport for Development
THE MERLIN MEASURING - Transport for Development
- No tags were found...

You also want an ePaper? Increase the reach of your titles
YUMPU automatically turns print PDFs into web optimized ePapers that Google loves.
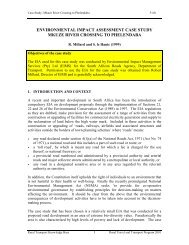
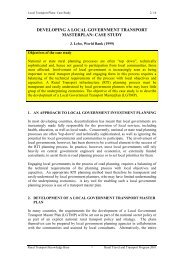
Digest of Research Report 301 1991<strong>THE</strong> <strong>MERLIN</strong> LOW-COST ROAD ROUGHNESS <strong>MEASURING</strong> MACHINEbyM A CundillINTRODUCTIONThe longitudinal unevenness of a road’s surface (normally termed its roughness) is an important measure of road condition and a keyfactor in determining vehicle operating costs on poor quality surfaces. A number of instruments have there<strong>for</strong>e been developed <strong>for</strong>measuring roughness but many of them are expensive, slow in use or require regular calibration.The report describes a simple machine which has been designed especially <strong>for</strong> use in developing countries. It is called <strong>MERLIN</strong>- A Machine <strong>for</strong> Evaluating Roughness using Low-cost Instrumentation. It was designed using a computer simulation of its operationon road profiles measured in the International Road Roughness Experiment in Brazil. The device can be used either <strong>for</strong> directmeasurement or <strong>for</strong> calibrating other instruments such as the vehicle-mounted Bump Integrator. Merlins are in use in a number ofdeveloping countries and can usually be made locally at a current cost of typically 250$ US.PRINCIPLEOF OPERATIONThe device has two feet and a probe which rest on the road surface along the wheel-track whose roughness is to be measured. The feetare 1.8 metres apart and the probe lies mid-way between them. The Merlin measures the vertical displacement between the road surfaceunder the probe and the centre point of an imaginary line joining the two points where the road surface is in contact with the two feet.If measurements are taken at successive intervals along a road, then the rougher the surface, the greater the variability of thedisplacements. By plotting the displacements as a histogram on a chart mounted on the instrument, it is possible to measure their spreadand the simulations have shown that this correlates well with road roughness, as measured on standard roughness scales.Figure 2 shows a sketch of the Merlin. For ease of operation, a wheel is used as the front leg, while the rear leg is a rigid metalrod. On one side of the rear leg is a shorter stabilizing leg which prevents the device from falling over when taking a reading. Projectingbehind the main rear leg are two handles, so that the device looks in some ways like a very long and slender wheelbarrow. The probeis attached to a moving arm which is weighted so that the probe moves downwards, either until it reaches the road surface or the armreaches the limit of its traverse. At the other end of the arm is attached a pointer which moves over the prepared data chart. The arm hasa mechanical amplification of ten, so that a movement of the probe of one millimetre will produce a movement of the pointer of onecentimetre. The chart consists of a series of columns, each 5 mm wide, and divided into boxes.The recommended procedure to determine the roughness of a stretch of road is to take 200 measurements at regular intervals, sayonce every wheel revolution. At each measuring point, the machine is rested on the road with the wheel, rear foot, probe, and stabiliserall in contact with the road surface. The operator then records the position of the pointer on the chart with a cross in the appropriate columnand, to keep a record of the total number of observations, makes a cross in the ‘tally box’ on the chart. The handles of the Merlin are thenraised so that only the wheel remains in contact with the road and the machine is moved <strong>for</strong>ward to the next measuring point where theprocess is repeated. Figure 3 shows a typical completed chart.When the 200 observations have been made, the chart is removed from the Merlin. The positions mid-way between the tenth andthe eleventh crosses, counting in from each end of the distribution, are marked on the chart below the columns. It may be necessary tointerpolate between column boundaries, as shown by the lower mark of the example. The spacing between the two marks, D, is thenmeasured in millimetres and this is the.roughness on the Merlin scale. Road roughness, in terms of the International Roughness Indexor as measured by a towed fifth wheel bump integrator, can then be determined using one of the equations given in the report.4< JA Departmentof Transpoti
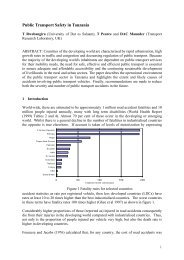
PohtarTUVWXI23A667891O—Figure 2 Sketch of the MerlinFigure 3 Typical completed chartThe work described in this Digest <strong>for</strong>ms part of the prograrnme carried out by the Overseas Unit (Unit Head: MJSYerrell)of TN <strong>for</strong> the Overseas <strong>Development</strong> Administration, but the views expressed are not necessarily those of the Administration.If this in<strong>for</strong>mation is insufficient <strong>for</strong> your needs a copy of thefull research Report RR301 may be obtained,fiee of charge, (prepaid bythe Overseas <strong>Development</strong> Administration) on written request to the Technical In<strong>for</strong>mation and Library Services, <strong>Transport</strong> and RoadResearch bboratory, Old Wokingham Road, Crowthorne, Berkshire.Crown Copyright. The views expressed in this digest are not necessarily those of the Department of <strong>Transport</strong>. Extracts from the textmay be reproduced, except <strong>for</strong> commercial purposes, provided the source is acknowledged.
TRANSPORTAND ROAD RESEARCH LABORATORYDepatiment of TranspotiRESEARCH REPORT 301<strong>THE</strong> <strong>MERLIN</strong> LOW-COST ROAD ROUGHNESS<strong>MEASURING</strong>MACHINEby M A CUNDILLCrown Copyright 1991. The work described in this report <strong>for</strong>ms part of the programme carried out <strong>for</strong> theOverseas “De~elopment Administration, but the views expressed are not necessarily those of theAdministration. Extracts from the text may be reproduced, except <strong>for</strong> commercial purposes, provided thesource is acknowledged.Overseas UnitTranspoti and Road Research LaboratoryCrowthorne, Berkshire, RG11 6AU1991ISSN 0266-5247
CONTENTSAbstractPage11.Introduction12.Roughness measuring instruments13.The <strong>MERLIN</strong>23.1 Principle of operation23.2 General description33.3 Method of use33.4 Practical details44.Calibrationequations65.Accuracyof measurement96.Discussion107.8.AcknowledgementsReferences1010Appendix A: Simulation of per<strong>for</strong>mance12A. 1The InternationalRoad Roughness12ExperimentA.2Simulationresults12A.3Alternative procedures and designs15A.3.1 Choice of machine length17A.3.2 Measurement of data spread17
<strong>THE</strong> <strong>MERLIN</strong><strong>MEASURING</strong>LOW-COST ROAD ROUGHNESSMACHINEABSTRACTThe roughness of a road’s surface is an importantmeasure of road condition and a key factor in determiningvehicle operating costs on poor quality surfaces. Thisreport describes a simple roughness measuring machinewhich has been designed especially <strong>for</strong> use in developingcountries. It is called <strong>MERLIN</strong> - a Machine <strong>for</strong> EvaluatingRoughness using Low-cost instrumentation. The devicecan be used either <strong>for</strong> direct measurement or <strong>for</strong> calibratingresponse type instruments such as the vehiclemountedbump integrator. It consists of a metal frame 1.8metres long with a wheel at the front, a foot at the rearand a probe mid-way between them which rests on theroad surface. The probe is attached to a moving arm, atthe other end of which is a pointer which moves over achart. The machine is wheeled along the road and atregular intewals the position of the pointer is recorded onthe chart to build up a histogram. The width of thishistogram can be used to give a good estimate ofroughness in terms of the International Roughness Index.Calibration of the device was carried out using computersimulations of its operation on road profiles measured inthe 1982 International Road Roughness Experiment.Merlins are in use in a number of developing countries.They can usually be made locally at a current cost oftypically 250$ US.1. INTRODUCTIONThe longitudinal unevenness of a road’s surface (normallytermed its roughness) is both a good measure ofthe road’s condition and an important determinant ofvehicle operating costs and ride quality. Within developingcountries, there is particular interest in the effect onvehicle operating costs. A number of studies (Hide et al1975, Hide 1982, CRRI 1982, Chesher & Harrison 1987)have shown how roughness can influence the cost ofvehicle maintenance, the extent of tyre damage andvehicle running speeds (and hence vehicle productivity).Reliable measurement of road roughness is there<strong>for</strong>eseen as an important activity in road network management.Several different road roughness scales have beenestablished and a variety of roughness measuringmachines have been developed. However, it was felt thatthere was a need, particularly within developing countries,<strong>for</strong> a new simple type of measuring instrumentwhich could be used either directly to measure roughnessover a limited part of the road network or <strong>for</strong> calibratingother roughness measuring equipment, particularly thevery widely used vehicle-mounted bump integrator.2. ROUGHNESS <strong>MEASURING</strong>INSTRUMENTSRoughness measuring instruments can be grouped intothree different classes. The simplest in concept are thestatic road profile measuring devices such as the rod andlevel, which measure surface undulations at regularintervals. Un<strong>for</strong>tunately, these devices are very slow inuse and there can be a considerable amount of calculationinvolved in deriving roughness levels from themeasurements taken.Two recent devices which work on a similar principle butare semi-automated are the TRRL Abay beam (Abaynay -aka 1984) and the modified ‘Dipstick profiler’ (FaceCompany). With both of these instruments, the surfaceundulations are measured from a static reference anddata is fed directly into a microprocessor to do thenecessary calculations. They produce high qualityresults, but they are relatively slow in operation andexpensive.The second class of instrument is the dynamic profilemeasuring device, such as the TRRL high-speed profilometer(Still and Jordan 1980). In these instruments,surface undulations are measured with respect to amoving plat<strong>for</strong>m equipped with some means of compensating<strong>for</strong> plat<strong>for</strong>m movement, so that the true road profilecan be derived. This is then converted to roughnessindices by automatic data processing. These devices canoperate at high speeds and give good quality results, butthey are very expensive, they are not usually suitable <strong>for</strong>very rough roads and they have to be carefully maintained.Finally, there are the response-type road roughnessmeasuring systems (RTRRMS). These measure thecumulative vertical movements of a wheel or axle withrespect to the chassis of a vehicle as it travels along theroad. In the case of a standard device such as the towedfifth wheel bump integrator (Bl) (Jordan and Young1980), the response is used directly as a roughnessindex. In other non-standard devices, such as thevehicle-mounted Bl, the response is converted to astandard roughness measure by calibration. The towedfifth wheel BI is expensive and needs careful operation.The vehicle-mounted Bl, however, is much cheaper andcan per<strong>for</strong>m well as long as it is correctly used and iscalibrated regularly.The standard roughness scale which has been used <strong>for</strong>many years by the Overseas Unit of TRRL in its studieson vehicle operating costs and pavement deterioration isthe output of the fifth wheel BI towed at 32 km/h. How-
ever, another scale which is now being widely used is theInternational Roughness Index (Sayers et al 1986a). Thisscale, which is derived from road profile data by a fairlycomplex mathematical procedure, represents the verticalmovement of a wheel with respect to a chassis in anidealised suspension system, when traveling along theroad at 80 km/h. As with the BI scale, it is measured interms of units of vertical movement of the wheel per unitlength of road, and is normally quoted in metres perkilometre. Traditionally, the BI scale is normally quoted inmillimetres per kilometre.3. <strong>THE</strong> <strong>MERLIN</strong>The new instrument which has been developed is avariation of the static profile measuring device. It is amanually operated instrument which is wheeled along theroad and measures surface undulations at regularintervals. Readings are easily taken and there is agraphical procedure <strong>for</strong> data analysis so that roadroughness can be measured on a standard roughnessscale without the need <strong>for</strong> complex calculation. Itsparticular attractions <strong>for</strong> use in the developing world arethat it is robust, inexpensive, simple to operate, and easyto make and maintain.The device is called <strong>MERLIN</strong>, which is an acronym <strong>for</strong> aMachine <strong>for</strong> Evaluating Roughness using Low-costinstrumentation. It was designed on the basis of acomputer simulation of its operation on road profilesmeasured in the International Road Roughness Experiment(Sayers et al 1986a). Details of this simulation aregiven in Appendix A.3.1 PRINCIPLE OF OPERATIONThe principle of operation is as follows. The device hastwo feet and a probe which rest on the road surface alongthe wheel-track whose roughness is to be measured. Thefeet are 1.8 metres apafl and the probe lies mid-waybetween them (see Figure 1). The device measures thevertical displacement between the road surface under theprobe and the centre point of an imaginary line joining thetwo points where the road surface is in contact with thetwo feet. This displacement is known as the ‘mid-chorddeviation’.If measurements are taken at successive intervals alonga road, then the rougher the road surface, the greater thevariability of the displacements. By plotting the displacementsas a histogram on a chart mounted on the instrument,it is possible to measure their spread and this hasbeen found to correlate well with road roughness, asmeasured on standard roughness scales.The concept of using the spread of mid-chord deviationsas a means of assessing road roughness is not new. Forexample, two roughness indices, Ql, and MO, have beenproposed by other researchers and are described bySayers et al (1986a). They are each based on the root0.9m* .0.9mFoot 2wM&chord deviation RoadsurfaceFigure 1. Measurement of mi~chorddeviatiin
mean square values of two mid-chord deviations withdifferent base lengths and have been suggested asstandards which can be calculated relatively easily fromroad profiles measured by rod and level.However, the Merlin operates by using just one baselength, the machine measures mid-chord deviationswithout the need <strong>for</strong> rod and level, the variability of themid-chord deviations is determined graphically and verylittle calculation is involved to determine roughness.3.2 GENERAL DESCRIPTIONFigure 2 shows a sketch of the Merlin. For ease ofoperation, a wheel is used as the front leg, while the rearleg is a rigid metal rod. On one side of the rear leg is ashorter stabiiising leg which prevents the device fromfalling over when taking a reading. Projecting behind themain rear leg are two handles, so that the device looks insome ways like a very long and slender wheelbarrow.The probe is attached to a moving arm which is weightedso that the probe moves downwards, either until itreaches the road surface or the arm reaches the limit ofits traverse. At the other end of the arm is attached apointer which moves over the prepared data chart. Thearm has a mechanical amplification of ten, so that amovement of the probe of one millimetre will produce amovement of the pointer of one centimetre. The chaficonsists of a series of columns, each 5 mm wide, anddivided into boxes.If the radius of the wheel is not uni<strong>for</strong>m, there will be avariation in the length of the front leg from one measurementto the next and this will give rise to inaccuracy in theMerlin’s results. To overcome this, a mark is painted onthe rim of the wheel and all measurements are taken withthe mark at its closest proximity to the road. The wheel isthen said to be in its ‘normal position’.3.3 METHOD OF USEThe recommended procedure to determine the roughnessof a stretch of road is to take 200 measurements atregular intervals, say once every wheel revolution. Ateach measuring point, the machine is rested on the roadwith the wheel in its normal position and the rear foot,probe, and stabiliser in contact with the road surface. Theoperator then records the position of the pointer on thechart with a cross in the appropriate column and, to keepa record of the total number of observations, makes across in the ‘tally box’ on the chart.Pointer\ HandesIWeighttProbetRearfootFrontfootMoving(with maker in contact arm StaMiserwith the roadIFigure 2. Sketchof the Merlin3
—The handles of the Merlin are then raised so that only thewheel remains in contact with the road and the machineis moved <strong>for</strong>ward to the next measuring point where theprocess is repeated. The spacing between the measuringpoints does not matter, as long as the readings arealways taken with the wheel in the normal position.Taking measurements at regular intervals should bothproduce a good average sample over the whole length ofthe section and reduce the risk of bias due to the operatortending to avoid paflicularly bad sections of road.Figure 3 shows a typical completed chart.When the 200 observations have been made, the chart isremoved from the Merlin. The positions mid-way betweenthe tenth and the eleventh crosses, counting in from eachend of the distribution, are marked on the chart below thecolumns. It may be necessary to interpolate betweencolumn boundaries, as shown by the lower mark of theexample. The spacing between the two marks, D, is thenmeasured in millimetres and this is the roughness on theMerlin scale. Road roughness, in terms of the internationalRoughness Index or as measured by a towed fifthwheel bump integrator, can then be determined using oneof the equations given in Section 4.3.4 PRACTICAL DETAILSPlates 1 and 2 show the Merlin. For ease of manufacture,the main beam, the central and rear legs, the movingarm, the stabiliser and the handles are all made fromsteel tubing of square cross-section, 25 x 25 mm withwall thickness of 1.5 mm. Joints are welded wherepossible, though the stabiliser and handles are fixed bybolts so that they can be removed <strong>for</strong> easier transportation.To strengthen the joints between the main beam andthe legs, additional struts are used. The wheel can beTUYMXJ 234567891012345678910111213141516171819mFigure 3. Ty@d completed chad
). .,. . . -.
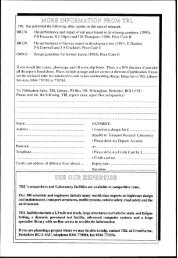
any type of common bicycle wheel mounted in a pair offront <strong>for</strong>ks and with a tyre which has a fairly smooth treadpattern.To reduce sensitivity to road surface micro-texture, theprobe and the rear foot are both 12 mm wide androunded in the plane of the wheel track to a radius of100 mm. The rounding also tends to keep the point ofcontact of the probe with the road in the same verticalline. The pivot is made from a bicycle wheel hub and thearm between the pivot and the weight is stepped to avoidgrounding on very rough roads.The chart holder is made from metal sheet and is curvedso that the chart is close to the pointer over its range ofmovement. To protect the arm from unwanted sidewaysmovement, a guide is fixed to the side of the main beam,retaining the arm close to the beam. One end of thisguide acts as a stop when the machine is raised by itshandles.The probe is attached to the moving arm by a threadedrod passing through an elongated hole: a system whichallows both vertical and lateral adjustment. The verticalposition of the probe must be set so that the pointer isclose to the middle of the chart when the probe displacementis zero, or the histogram will not be central. Thelateral position of the probe has to be adjusted so that itstraverse passes centrally through the line joining thebottom of the tyre and the rear foot. If not, it will be foundthat when the machine is tilted from side to side, thepointer moves. When correctly adjusted, leaning themachine over to one side so that the stabiliser rests onthe road has little effect on the position of the pointer.Be<strong>for</strong>e use, the mechanical amplification of the armshould be checked using a small calibration block,typically 6 mm thick. Insertion of the block under theprobe should move the pointer by 60 mm and anydiscrepancy has to be allowed <strong>for</strong>. For example, if thepointer moved by only 57 mm, then the value of Dmeasured on the chart should be increased by a factor of60/57.It is also recommended that a check is carried out be<strong>for</strong>eand after each set of measurements to ensure that therehas been no unwanted movement of critical parts such asthe rear foot or the probe mounting. The check is carriedout by returning the machine to a precisely definedposition along the road and making sure that the samepointer reading is obtained.If, when making measurements on a very rough road,more than 10 readings are at either limit of the histogram,the probe should be removed and attached to thealternative fixing point which is provided. This is twice asfar from the pivot and reduces the mechanical amplificationof the arm to 5, halving the width of the distribution.Values of D read from the chart are scaled using thecalibration procedure described earlier. Although thespacing between the probe and the two feet is no longer0.9 metres in this case, the errors introduced are smalland can be ignored.4. CALIBRATION EQUATIONSThe relationships between the Merlin scale and the BIand IRI scales are given below.For all road surfaces:IRI = 0.593+ .0471 D (1)42> D>312(2.4> IRI> 15.9)where IRI is the roughness in terms of the InternationalRoughness Index and is measured in metres per kilometreand D is the roughness in terms of the Merlin scaleand is measured in millimetres.BI = -983 + 47.5 D (2)42> D >312 (1,270> BI > 16,750)where BI is the roughness as measured by a fifth wheelbump integrator towed at 32 km/h and is measured inmillimetres per kilometre.When measuring on the BI scale, greater accuracy canbe achieved by using the following relationships <strong>for</strong>different surface types.Asphaltic concreteBI = 574+ 29.9 D (3)42< D
International Roughness IndexIRI=O.593+.0471D//o 100Merlin200 3D (mm)1 4 1020000Bump Integrator (32km/h)BI = -983+ 47.5D15000I500000100 200MerlinD (mm)300 400Hgure 4.Calihation7
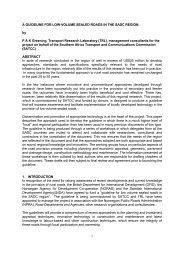
IIH=-2230+59.4D1A/SWaca treatee~-132+3iK-FwI 1/ /I b“IUvda .-1134 +44. OD/ ,//Lo 100 2m 300 400Merfin D (mm)figure 5. CatiMation relationships <strong>for</strong> ~- dfferent surface types8
5. ACCURACY OFWhen using the Merlin to measure roughness, twoconsiderations about accuracy have to be borne in mind.The first is that the Merlin measurement <strong>for</strong> a roadsection is derived from a sample of observations and sois subject to a random sampling error. This can bereduced by repeat observations on the same section. Thesecond is that there are systematic differences betweenthe roughness scales which can only be reduced byrepeat observations on different road sections.Undulations in a road’s surface can be considered assurface waves with a spectrum of spatial frequencies(spectral signature). The IRI, BI and Merlin scales andany RTRRMS device being calibrated, all have differentsensitivities to different spatial frequencies and so theycorrespond uniquely with each other only <strong>for</strong> surfaceswith the same spectral signature. In practice, individualroad sections have different spectral signatures, thoughthere are broad similarities, especially between sectionswith the same surface type. Hence the relationshipbetween the scales is not unique and this gives tise tothe systematic differences mentioned above.The relationships between the Merlin and the IRI scalesare very similar <strong>for</strong> all the surface types examinedwhereas the relationships between the Merlin and the BIscales (and the IRI and BI scales) are clearly different <strong>for</strong>each surface type. This implies that the effective spectralsensitivity of the Merlin is closer to that of the IRI scalethan the BI scale. It is interesting to note that the coefficientsand constants in equations (3) to (6) follow asteady progression as the surfaces vary from asphalticconcrete to earth, presumably reflecting a progressivechange in spectral signature.When the random error isgreater than the systematic error, significant improvementscan be made by repeat measurements on thesame road section. If the systematic error increases, thebenefit of repeat measurements on the same sectiondecreases. Table 1, which was derived from the computersimulation, shows the mean residual error inroughness level <strong>for</strong> estimates based on one and four runsof the Merlin.If roughness is being measured directly on the Merlinscale, then there are no systematic errors to contend withand the error falls with the reciprocal of the square root ofthe number of observations. As Table 1 shows, a singlemeasurement gave a root mean square (RMS) residualerror of 8 per cent while taking the mean of four observationshalved the error to 4 per cent.If measuring roughness on the IRI scale, taking fourmeasurements gave an RMS residual error of 7 per cent,compared with 10 per cent when using single measure-TABLE 1ResidualerrorsRoughness Surface RMS residual error (“A)scale type (*) One obsewation Four obsewationsMerlin All 8 4(mm)IRI All 10 7(m/km)(m;;km)(m#jkm)(m;;km)(m#;km)(m;;km)All 21 19AC 15 13ST 9 4GR 14 11EA 12 11*AC= Asphaltic concreteST = Surface treatedGR = GravelEA = Earth9
ments. If working to the BI scale and using a singlerelationship <strong>for</strong> all surface types, systematic errors aremuch larger. The RMS residual error <strong>for</strong> single measurementswas 21 per cent and this reduced only slightly to19 per cent <strong>for</strong> four measurements.The benefits of multiple measurements are greater whenusing separate BI relationships <strong>for</strong> each surface type: theRMS residual errors ranged from 9 to 15 per cent <strong>for</strong>single measurements compared with 4 to 13 per cent <strong>for</strong>multiple measurements. The relatively large error <strong>for</strong>asphaltic concrete compared to surface treated roadscould well reflect the more limited roughness range <strong>for</strong>the latter and that the true relationships are non-linear.When estimating roughness <strong>for</strong> a vehicle, the normalprocedure is to assume that the combined roughness <strong>for</strong>the two wheel tracks can be equated to the mean of theindividual tracks, although this does give rise to a smallerror. Hence, in practice, a minimum of two sets of Merlinobservations are required. The roughness of the individualwheel tracks can differ considerably.Bearing in mind the above limitations, it is normally betterto calibrate an RTRRMS device at a larger number ofsites than make many repeat measurements at the samesite. Moreover, particularly if working on the BI scale,these sites should have similar sutiaces to those onwhich the RTRRMS is to be used. A number of otherpractical points should be considered when measuringroughness or calibrating an RTRRMS and a useful guideis provided by Sayers et al (1986b).As a simple cross-check on petiormance, roughnessvalues on the Merlin scale were measured <strong>for</strong> a series ofasphaltic concrete test sections on the TRRL experimentaltrack. Four measurements were taken on each sectionand the mean values are shown plotted in Figure 6against the roughness of each section on the BI scale asmeasured with the Abay beam (Abaynayaka 1984). TheFigure also shows the Merlin-Bl calibration line <strong>for</strong>asphaltic concrete roads as given in equation 3. As canbe seen, the points lie very close to the calibration lineand while the check is by no means comprehensive, itdoes lend strong support to the results derived from thesimulation.6. DISCUSSIONThe reason <strong>for</strong> designing the Merlin was to provide adevice which is easy to use and reasonably accurate andyet can be manufactured and maintained with the limitedresources available within developing countries. Experienceindicates that it has been successful in meetingthese objectives. A number of the machines have beenmade at TRRL and shipped overseas, while other unitshave been made overseas from drawings provided by theLaboratory. To date, Merlins have been used in 11developing countries in South America, Africa and Asia;in six of these, the equipment was made locally at currentprices of typically 250 US dollars.One inconvenience of the Merlin is that, because of itslength, it is not easily transported within a vehicle. Ashotier machine could be used but, as is shown in theAppendix, this will lead to some reduction in correlationwith the IRI scale. Alternatively, a more portable designcould be considered using a structure which folds ordismantles. While this is a possibility, it has been avoidedbecause of the need to retain rigidity. Although its designis very simple, the Merlin is able to measure displacementsto less than a millimetre and this ability couldeasily be compromised by unwanted flexing of thestructure.In recent years, there has been a move towards reducingthe number of different roughness scales in use andstandardizing on the International Roughness Index.However, the Merlin scale does have the advantage ofbeing easy to visualise and although Merlin readings canbe converted easily to IRI values, in some cases thisconversion is unnecessary and direct use of the Merlinscale should be considered.7. ACKNOWLEDGEMENTSThis work <strong>for</strong>ms part of the programme of research of theOverseas Unit (Head: J S Yerrell) of the Transpoti andRoad Research Laboratory, UK.8. REFERENCESABAYNAYAKA, S W (1984). Calibrating and standardizingroad roughness measurements made with responsetype instruments. In: ENPC. International Conference onRoads and <strong>Development</strong>, Paris, May 1984, ppl 3-18.Presses de I’ecole nationale des ponts et chaussees,Paris.CHESHER, A and HARRISON, R (1987). Vehicleoperating costs: evidence from developing countries.John Hopkins University Press, Baltimore and London.CRRI (1982). Road user cost study in India: final reportCentral Road Research Institute, New Delhi.FACE COMPANY. The Edward W. Face Company Inc,Norfolk, Virginia.GILLESPIE, T D (1986). <strong>Development</strong>s in road roughnessmeasurement and calibration procedures. In:ARRB. Proc. 13th ARRB - 5th REAAA Conf. 13(1 ), pp 91-112. Australian Road Research Board, Vermont South.HIDE, H (1982). Vehicle operating costs in the Caribbean:results of a survey of vehicle operators. TRRLLaboratory Report 1031: <strong>Transport</strong> and Road ResearchLaboratory, Crowthorne.HIDE, H et al (1975). The Kenya road transport coststudy: research on vehicle operating costs. TRRLLaboratory Report 672: <strong>Transport</strong> and Road ResearchLaboratory, Crowthorne.10
4,0003,000●/●1,000H=574+29.9Do020 40 60 80 100Merlin D (mm)IIfi~re 6.Calibration ch~on aspha~ic concrete11
JORDAN, P G and YOUNG, J C (1980). <strong>Development</strong>sin the calibration and use of the Bump-Integrator <strong>for</strong> rideassessment. TRRL Supplementary Report 604: <strong>Transport</strong>and Road Research Laboratory, Crowthorne.SAYERS, W Set al (1986a). The International RoadRoughness Experiment: establishing correlation and acalibration standard <strong>for</strong> measurements. World BankTechnical Paper Number 45. The World Bank, WashingtonD.C.SAYERS, W S et al (1986 b). Guidelines <strong>for</strong> conductingand calibrating road roughness measurements. WorldBank Technical Paper Number 46. The World Bank,Washington D.C.STILL, P B and JORDAN, P G (1980). Evaluation of theTRRL high-speed profilometer. TRRL Laboratory Report922: <strong>Transport</strong> and Road Research Laboratory,Crowthorne.APPENDIX A: SIMULATION OFPERFORMANCEA.1 <strong>THE</strong> INTERNATIONAL ROADROUGHNESS EXPERIMENTIn 1982, a major study, the International Road RoughnessExperiment (l RRE), was carried out in Brasilia(Sayers et al 1986a) to compare the per<strong>for</strong>mance of anumber of different road roughness measuring machinesand to calibrate their measures to a common scale. Aspart of this study, the machines were run over a series oftest sections 320 metres long, <strong>for</strong> four types of roadsurface - asphaltic concrete, surface treated, gravel andearth. One of the instruments used in the study was anearly version of the TRRL Abay Beam. This employed analuminium beam, 3 metres in length, suppotied at eachend by adjustable tripods which were used <strong>for</strong> Ievelling.Running along the beam was a sliding carriage whichhad at its lower end a wheel of 250 mm diameter whichwas in contact with the road surface. A linear transducerinside the carriage measured the distance between thebottom of the wheel and the beam to the nearest millimetreand this was recorded at 100 mm intervals alongthe road. By successively relocating the beam along thelength of the road section and repeatedly Ievelling thebeam, the recordings provided a continuous sampling ofthe road profile.Data from the Abay beam were available <strong>for</strong> 27 of thetest wheel paths. These are listed in Table Al togetherwith roughness on the IRI scale as computed from thebeam road profile data and roughness on the BI scale asmeasured by a fifth wheel bump integrator towed at 32km/h. As can be seen, there are eight paths on asphalticconcrete roads, five on surface treated roads, seven ongravel surfaces and seven on earth surfaces. Roughnessesrange from 2.44 m/km on the IRI scale (1 ,270mm/km on the BI scale) <strong>for</strong> the best asphaltic concretesurface to 15.91 m/km (16,750 mm/km on the BI scale)<strong>for</strong> the worst earth surface.Figure Al shows, as an example, the road profile asmeasured by the Abay Beam along 50 metres of two ofthe test sections. The first is an asphaltic concrete road inrelatively good condition, while the second is a gravelsutiace in fair condition. As might be expected, comparedto the asphaltic concrete, the gravel surface shows amuch greater presence of short wavelength undulations.To help visualise the Merlin’s response, the Figure alsoshows the machine’s length, 1.8 metres, on the samescale.A.2 SIMULATION RESULTSGiven these road profiles, it was possible to carry out acomputer simulation of the petiormance of a Merlin.Neglecting the small effects due to the fact that the Merlinis not operated in a horizontal position, if it is assumedthat the rear foot is placed at a horizontal distance of Xmetres from the start of the section, then the probe wouldbeat a distance of (X + 0.9) metres from the start andthe front foot at a distance of (X+ 1.8) metres. If thecorresponding vertical distances at these points are YO,Y, and Y2, then the pointer on the Merlin will be displacedfrom the zero position by an amount d, given byd= Mx(Y1-0.5x(Yz+YO)) (1)where M is the mechanical amplification provided by themoving arm, usually close to 10.Placing the Merlin at successive positions along the roadis simulated by using successively increasing values of X.Tabulating the values of d into different 5 mm rangescorresponds to making crosses in the columns of thechart, and once 200 observations have been made, Dcan be deduced from the tabulation, using the process ofcounting in ten observations from each end of thedistribution and interpolating where necessary.For each of the test sections, four simulation runs werecarried out. In each run, a Merlin reading was taken every1.5 metres, so that the observations covered almost theentire test section. In the first run, the starting point wasat the beginning of the test section. Subsequent runsstarted at 0.4, 0.8 and 1.2 metres from the beginning.Table A2 shows the results of these simulations. Valuesof D <strong>for</strong> each of the four runs per section are denoted asD,, D2, D~ and D,. The Merlin’s operation is essentially astatistical sampling of the road profile and the values of Dshow a statistical scatter with an average coefficient ofvariation of eight per cent. To reduce the effects of thisscatter, mean values of the four simulation runs are usedin the analyses.A plot of roughness on the IRI scale against D <strong>for</strong> each ofthe test sections is shown in Figure A2. As can be seen,the points are a good fit to a linear regression passingclose to, but not through, the origin. Table A3 gives the12
TABLEAlTest SectionsSectn Sutiace Section Wheel IRIno. type(l) code (2) track (3) (m/km) (m~;km)123456789101112131415161718192021222324252627ACACACACACACACACSTSTSTSTSTGRGRGRGRGRGRGREAEAEAEAEAEAEA040405050606101201040506060105050707121201010303061111NS0sNS0sNS0sNS0s0s0s0sNS0sNSNS0sNS0sNS0sNS0sNS0sNSNS0s4.765.805.686.536.968.293.292.444.515.277.003.113.413.838.509.924.117.0411.6514.314.394.726.038.0315.917.7810.783095346540504390468553701850127032803705492022502725201058758095291050258545122252935386543158385167506855100551. AC = Asphaltic concreteST = Sutiace treatedGR = GravelEA = Eafih2. As used in the IRRE3. NS = Nearside = Right0s = Offside = Lefi13
,.—I
TABLESimulationA2ResultsSectn Surface IRIno type (1) (m/km) (m~jkm)D (mm)D, D, D, DA Mean1 AC 4.762 AC 5.803 AC 5.684 AC 6.535 AC 6.966 AC 8.297 AC 3.298 AC 2.449 ST 4.5110 ST 5.2711 ST 7.0012 ST 3.1113 ST 3.4114 GR 3.8315 GR 8.5016 GR 9.9217 GR 4.1118 GR 7.0419 GR 11.6520 GR 14.3121 EA 4.3922 EA 4.7223 EA 6.0324 EA 8.0325 EA 15.9126 EA 7.7827 EA 10.78309534654050439046.85537018501270328037054920225027252010587580952910502585451222529353865431583851675068551005570.591.397.5116.7117.1185.045.040.875.0100.6115.050.465.074.2141.3205.085.7137.5215.0295.080.085.8122.0157.0287.5178.8215.078.397.585.0128.8118.0190.057.052.384.8107.5137.063.664.778.3169.2180.081.3140.8232.5277.588.3100.0134.2165.8330.0175.0222.580.0104.491.0112.5181.3162.553.442.792.594.4132.559.273.177.9152.5204.2102.5150.0285.0272.585.496.7123.3150.0320.0163.8217.576.095.094.6128.0123.0168.340.630.379.395.1111.953.661.575.5162.5184.275.0155.0255.0315.081.787.5105.0170.8310.0171.7203.376.297.092.0121.5134.8176.549.041.582.999.4124.156.766.176.5156.4193.386.1145.8246.9290.083.892.5121.1160.9311.9172.3214.61. AC = Asphaltic concreteST = Surface treatedGR = GravelEA = Earthregression coefficients together with their standard errors.The coefficient of determination (Rz) is over 0.98. Henceit appears that the Merlin can be used as a fairly accuratemeans of measuring roughness on the IRI scale.Figure A3 shows a similar plot <strong>for</strong> roughness on the BIscale. Once again, the points can be fitted to a linearregression passing close to the origin. However, the fit tothe line is not as good as <strong>for</strong> the IRI scale and thecoefficient of determination is lower at just under 0.92. Inpart, this was to be expected since the BI value wasdetermined independently using a dynamic measuringdevice whereas the IRI and Merlin values were bothcomputed from the same static profile data. However, thisis not the full explanation and better correlation can beachieved with a Merlin of different length as described inSection A.3. I.Upon closer examination of Figure A3, it can be seen thatthere are consistent differences between the results <strong>for</strong>the different surface types. The analysis can there<strong>for</strong>e beimproved by considering the different surface typesseparately and the result of doing so is shown in FigureA4. Table A3 lists the regression coefficients. Thecoefficient of determination ranges from 0.914 on asphalticconcrete surfaces to 0.987 on surface treated sections.A.3 ALTERNATIVE PROCEDURESAND DESIGNSThe simulations described so far have used one samplingprocedure, a Merlin of one particular size and onemethod of data analysis. In fact, the choice of these wasbased on other considerations and the results of othersimulations.The Merlin samples the road surface at a number ofpoints, and the accuracy with which roughness can bededuced clearly depends upon the quality and size of thesample. It was felt that the best way of ensuring anunbiased result was to have a systematic sample withrecordings taken at regular intervals. The sample size15
,/o 100 m m mMertin D (mm)Fig.A2 Relationship between I R I and D16
TABLEA3Results of the Regression Analyses. (Roughness= A. + A, .D)Roughness Sutiace Number ofR2scale type (1) A. (2) Al (2)sectionsIRI All 0.593 0.0471 0.983 27(m/km) (0.185) (0.0012)All -983 47.5 0.918 27(m~;km) (423) (2.8)AC 574(401)ST 132(220)GR -1134(676)EA -2230(797)29.9 0.914 8(3.7)37.8 0.987 5(2.5)44.0 0.967 7(3.6)59.4 0.973 7(4.4)1. AC = Asphaltic concreteST = Surface treatedGR = GravelEA = Earth2. Bracketed values are one standard error(200 observations) was chosen as a practical upper limitfrom the point of view of managing the data handling andlimiting the length of time taken to measure D.A.3.1 Choice of machine lengthThe choice of machine length was examined by simulatingMerlins of lengths ranging from 0.6 to 3 metres. Usingthe same procedure as that described above, and notdistinguishing between the different types of surface,linear regressions were derived relating the value ofroughness on the two measuring scales to D <strong>for</strong> eachMerlin length.Figure A5 shows the R2 values <strong>for</strong> these regressions. Onthe IRI scale, the best correlations are between 1.4 and2.6 metres. The highest value occurs at around 1.8metres and so this was chosen as the standard Merlinlength. Reducing the length below 1.4 metres causes asharp decrease in correlation.Turning to the results <strong>for</strong> the BI scale, the answer is quitedifferent. Here the best correlation is more sharplydefined and occurs at a Merlin length of one metre. Thedegree of correlation is not as good as the best IRI value,but this is to some extent explained by the fact that the BIvalue was determined by independent measurement.The use of a one-metre Merlin is an attractive concept,since it would be considerably more portable than the 1.8metre version. However, it would be a much poorerpredictor of IRI and in practice it would be necessary todistinguish between the different sutiace types to reducesome of the uncertainty.The underlying reason <strong>for</strong> the results of this analysis canbe explained by considering the frequency sensitivities ofthe Merlin and the IRI and BI scales. The Merlin has afundamental frequency response to sudace waves ofwavelength equal to its own base length, while the IRIand BI scales are particularly sensitive to sutiace waveswhich would stimulate the natural vibrations of a vehiclewheel (at about 10 Hz) and a chassis (at about 1 Hz).At 80 km/h, the speed used <strong>for</strong> the IRI scale, the naturalvibration of the wheel would be stimulated by surfacewaves of around 2.2 metres and the chassis by waves ofaround 22 metres. At 32 km/h, the speed used <strong>for</strong> the BIscale, the equivalent surface wavelengths are 0.9 metresand 9 metres respectively. Hence it appears that thecorrelation analysis has selected Merlin lengths such thatthe wavelength of the fundamental frequency is close tothe wavelength of the suflace waves which wouldstimulate the natural vibration of the wheel.A.3.2 Measurementof data spreadFinally, the choice of method <strong>for</strong> determining the dataspread should be described. Measuring the limits <strong>for</strong> acertain central percentage of the data points is an17
A15,000//’o-/”-----------4,000o 100 m 300 aMertin D (mm)figure A3. Relationship btween H and D
As@~c concreteSurface treatedH (w)H (m)20,000H=574+29.9D20,000R❑ =132+ 37.8D115,m15,00010,OOOI I I5,000/ Yo u—-0 100 200 3kln D (mm)Wlm D (mm)Grav4H (m*)m,m20,000H-- I134+44. ODH--223O+59,4D15.000’15,000/4 1lo,m’10,OOO [* 4A5.m-15.000LAvx0 0 100 200 300 ao 0 100 m 300 400KfinD (mm)figure A4. Relation&@h~eenH and D <strong>for</strong> different surfaces19
\d.6 1 1.6 2 2.5 3Mark Length (m)figure A5.Roughness measuring accuracy <strong>for</strong> Mertineof different lengthattractively simple procedure in the field and requires aminimum of calculation. To decide what percentagewould give the best answers, the per<strong>for</strong>mance of a Merlinover the test sections was again simulated. This time, themachine length was fixed at 1.8 metres and the roughnesswas measured on the IRI scale.Linear regressions were carried out between D values,derived using different data percentages, and roughness.Table A4 shows the resulting values of R2, from which itcan be seen that, of the values tested, 90 per cent, whichcorresponds to counting in 10 crosses from each end ofthe distribution, appeared to be the best choice.TABLEA4Effect of Data Limits on CorrelationPercentageof dataCount from edgeof distributionR295 5 0.93290 10 0.98385 15 0.96680 20 0.923Printed in the United Kingdom <strong>for</strong> HMSO20 0dK50120 8/91 C1O G2516 10170