Metal Stocks in Society â Scientific Synthesis - UNEP
Metal Stocks in Society â Scientific Synthesis - UNEP
Metal Stocks in Society â Scientific Synthesis - UNEP
- No tags were found...

Create successful ePaper yourself
Turn your PDF publications into a flip-book with our unique Google optimized e-Paper software.
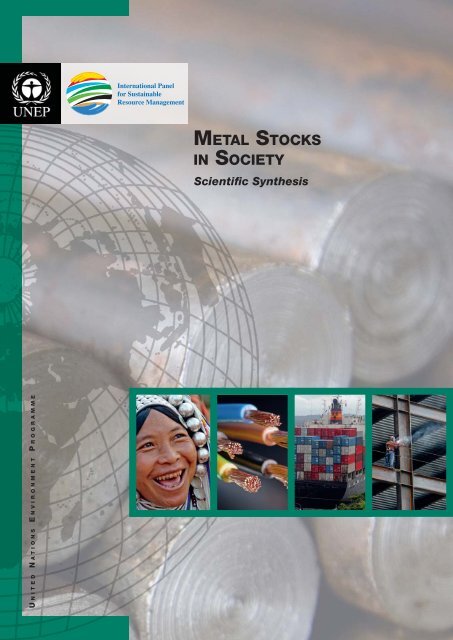
METAL STOCKSIN SOCIETY<strong>Scientific</strong> <strong>Synthesis</strong>U NITED NATIONS ENVIRONMENT PROGRAMME
AcknowledgementsEditor: International Panel for Susta<strong>in</strong>able Resource Management,Work<strong>in</strong>g Group on the Global <strong>Metal</strong> FlowsLead author: T. E. GraedelThis report is a rewritten and enhanced version based on M. D. Gerst andT. E. Graedel, Environmental Science & Technology, 42, 7038 – 7045, 2008. Partsof it were developed at a workshop held August 15 – 16, 2008, with the follow<strong>in</strong>gparticipants: Thomas Graedel, Yale University, USA, coord<strong>in</strong>ator; A. Dubreuil, NaturalResources Canada; Michael Gerst, Dartmouth College; Seiji Hashimoto, NationalInstitute for Environmental Studies, Japan; Yuichi Moriguchi, National Institute forEnvironmental Studies, Japan; Daniel Müller, Norwegian University of Scienceand Technology; Claudia Pena, CIMM, Chile; Jason Rauch, Yale University, USA;Thompson S<strong>in</strong>kala, School of M<strong>in</strong>es, Zambia; and Guido Sonnemann, <strong>UNEP</strong>,France.Guido Sonnemann, <strong>UNEP</strong>, provided valuable <strong>in</strong>put and comments; the ResourcePanel’s secretariat coord<strong>in</strong>ated the preparation of this report.Thanks go to Ernst Ulrich von Weizsäcker and Ashok Khosla as co-chairs of theResource Panel, the members of the Resource Panel and the Steer<strong>in</strong>g Committeefor fruitful discussions. Additional comments of a technical nature were received fromsome governments participat<strong>in</strong>g <strong>in</strong> the Steer<strong>in</strong>g Committee.Helpful comments were received from several anonymous reviewers <strong>in</strong> a peer-reviewprocess coord<strong>in</strong>ated <strong>in</strong> an effi cient and constructive way by Lea Kauppi togetherwith the Resource Panel secretariat. The preparation of this report also benefi ttedfrom discussions with many colleagues at various meet<strong>in</strong>gs, although the ma<strong>in</strong>responsibility for mistakes will rema<strong>in</strong> with the authors.Copyright © United Nations Environment Programme, 2010Design: 3f design; cover concept <strong>UNEP</strong>;Photos: iStockphoto.com: background title/page 8 © Huchen Lu, title 1 © oneclearvision,title 2 © Marco Hegner, title 3/page 37 © Milos Peric, title 4/page 29 © DNY 59,page 11 © Rob Belknap, page 13 © Youra Pechk<strong>in</strong>, page 26 © Erm<strong>in</strong> Gutenberge, page27 © gitches, page 30 © Mike Clarke; page 21 © Umicore Precious <strong>Metal</strong>s Refi n<strong>in</strong>gThis publication may be reproduced <strong>in</strong> whole or <strong>in</strong> part and <strong>in</strong> any form foreducational or non-profi t purposes without special permission from the copyrightholder, provided acknowledgement of the source is made. <strong>UNEP</strong> would appreciatereceiv<strong>in</strong>g a copy of any publication that uses this publication as a source.No use of this publication may be made for resale or for any other commercialpurpose whatsoever without prior permission <strong>in</strong> writ<strong>in</strong>g from the United NationsEnvironment Programme.DisclaimerThe designations employed and the presentation of the material <strong>in</strong> thispublication do not imply the expression of any op<strong>in</strong>ion whatsoeveron the part of the United Nations Environment Programmeconcern<strong>in</strong>g the legal status of any country, territory, city orarea or of its authorities, or concern<strong>in</strong>g delimitation of itsfrontiers or boundaries. Moreover, the views expresseddo not necessarily represent the decision or thestated policy of the United Nations EnvironmentProgramme, nor does cit<strong>in</strong>g of trade names orcommercial processes constitute endorsement.ISBN: 978-92-807-3082-1<strong>UNEP</strong>promotes environmentallysound practicesglobally and <strong>in</strong> its own activities.This publication is pr<strong>in</strong>ted on FSCcertifiedpaper with 60 % recycled fibre,us<strong>in</strong>g eco-friendly practices. Our distributionpolicy aims to reduce <strong>UNEP</strong>’scarbon footpr<strong>in</strong>t.
METAL STOCKSIN SOCIETY<strong>Scientific</strong> <strong>Synthesis</strong>
<strong>Metal</strong> <strong>Stocks</strong> <strong>in</strong> <strong>Society</strong> – <strong>Scientific</strong> <strong>Synthesis</strong>PrefaceEconomic development is deeply coupledwith the use of metals. Dur<strong>in</strong>g the 20th centurythe variety of metal applications <strong>in</strong> societygrew rapidly. In addition to mass applicationssuch as steel <strong>in</strong> build<strong>in</strong>gs and alum<strong>in</strong>ium<strong>in</strong> planes, more and more differentmetals are <strong>in</strong> use for <strong>in</strong>novative technologiessuch as the use of the specialty metal <strong>in</strong>dium<strong>in</strong> LCD screens.<strong>Metal</strong>s are present everywhere around usand are one of the major materials uponwhich our economies are built. In particular<strong>in</strong> emerg<strong>in</strong>g economies, but also <strong>in</strong> <strong>in</strong>dustrializedcountries, the demand for metals is<strong>in</strong>creas<strong>in</strong>g.Therefore, m<strong>in</strong><strong>in</strong>g activities expand, potentiallylead<strong>in</strong>g to grow<strong>in</strong>g environmentalimpacts. Recycl<strong>in</strong>g is a way to mitigate theseimpacts. We can call this “m<strong>in</strong><strong>in</strong>g aboveground” or “urban m<strong>in</strong><strong>in</strong>g”, and these activitiesare of <strong>in</strong>creas<strong>in</strong>g importance <strong>in</strong> generat<strong>in</strong>graw materials.The cont<strong>in</strong>ued <strong>in</strong>crease <strong>in</strong> the use of metalsover the 20th century has led to a substantialshift <strong>in</strong> metal stocks from below ground toabove ground <strong>in</strong> applications <strong>in</strong> society. Sucha shift raises social, economic, and environmentalissues that have to be addressed byquantify<strong>in</strong>g the amount of metal stocks <strong>in</strong>society and their lifetimes. For <strong>in</strong>stance, theaverage lifetime of copper <strong>in</strong> a build<strong>in</strong>g is 25to 40 years; afterwards, the metal is ready form<strong>in</strong><strong>in</strong>g.Comparison of the per capita stocks <strong>in</strong> <strong>in</strong>dustrializedcountries with those <strong>in</strong> develop<strong>in</strong>gcountries suggests that if the total world populationwere to enjoy the same levels of useas the <strong>in</strong>dustrialized countries, the amount ofglobal <strong>in</strong>-use metal stocks required would be3−9 times those exist<strong>in</strong>g at present.This report, the first <strong>in</strong> a series of six, hasbeen compiled by the Global <strong>Metal</strong>s FlowsGroup of <strong>UNEP</strong>’s Resource Panel. It providesreasonably detailed <strong>in</strong>formation on the <strong>in</strong>-usestocks for five metals, and sparse but potentiallyuseful <strong>in</strong>formation for n<strong>in</strong>eteen othermetals.Clos<strong>in</strong>g the <strong>in</strong>formation gaps about stocks <strong>in</strong>human society provides important <strong>in</strong>formationabout the potential of metal recycl<strong>in</strong>g tosupply future demand. The utilization of thesegrow<strong>in</strong>g metal stocks through recycl<strong>in</strong>g isexpected to be an important source for metalsupply <strong>in</strong> the future.Prof. Thomas E. GraedelLeader of theGlobal <strong>Metal</strong> Flows Work<strong>in</strong>g Group2
<strong>Metal</strong> <strong>Stocks</strong> <strong>in</strong> <strong>Society</strong> – <strong>Scientific</strong> <strong>Synthesis</strong>Preface<strong>Metal</strong>s are a core, centre-piece of the global,economy: Whether it be <strong>in</strong> the manufactureof build<strong>in</strong>gs or cars to the boom<strong>in</strong>gproduction of mobile phone, computers andother electronic goods, metals have become<strong>in</strong>creas<strong>in</strong>gly important to commerce.But metals are also part of the challengesociety is fac<strong>in</strong>g <strong>in</strong> its transition to a low carbon,resource efficient 21st Green Economy.<strong>Metal</strong>s are a f<strong>in</strong>ite resource, whose management,consumption and production echo tothe need to adopt a recycl<strong>in</strong>g economy. <strong>Metal</strong>salso have impacts as a result of theirm<strong>in</strong><strong>in</strong>g, extraction and ref<strong>in</strong><strong>in</strong>g. Meanwhilesome metals have, as a result of their useand disposal <strong>in</strong> products and processes,health implications and ones that impact onthe wider environment.Understand<strong>in</strong>g, quantify<strong>in</strong>g and estimat<strong>in</strong>gthe ways metals flow through economies ispart of the solution to better manag<strong>in</strong>g theirimpacts and their benefits. Indeed the InternationalPanel for Susta<strong>in</strong>able ResourceManagement, hosted by <strong>UNEP</strong> and established<strong>in</strong> 2007, identified metals as a key area<strong>in</strong> terms of the 21st century susta<strong>in</strong>abilitychallenge.The Panel’s Global <strong>Metal</strong> Flows Group hasidentified six, central assessment reportsas needed to br<strong>in</strong>g clarity and to promoteaction towards a susta<strong>in</strong>able metals economy:stocks <strong>in</strong> society, recycl<strong>in</strong>g rates, environmentalimpacts, geological stocks, futuredemand, and critical metals.This, the first report <strong>in</strong> this area, focuses onthe stocks of metals <strong>in</strong> society. It provides,from a global perspective, the best scientific<strong>in</strong>formation available on the quantity of metalstocks <strong>in</strong> the world.In particular it provides authoritative estimatesof metals currently <strong>in</strong> use and theirlifetimes. This <strong>in</strong> turn allows evaluations onthe amounts of metals that may re-enter theglobal and national economies allow<strong>in</strong>g governmentsto make more <strong>in</strong>telligent and targeteddecisions on metals management.This is no easy task and here I would liketo congratulate the Resource Panel and itsexperts and partners for br<strong>in</strong>g<strong>in</strong>g to governments,bus<strong>in</strong>ess and civil society a furtherand important piece <strong>in</strong> the susta<strong>in</strong>ability jigsawpuzzle.<strong>Metal</strong>s encapsulate the 21st century challengeof realiz<strong>in</strong>g susta<strong>in</strong>able development:development that requires and requests a farmore <strong>in</strong>telligent understand<strong>in</strong>g and trajectorythat reflects the needs of a planet of six billionpeople, mov<strong>in</strong>g to more than n<strong>in</strong>e billionby 2050.Achim Ste<strong>in</strong>erUN Under-Secretary General andExecutive Director <strong>UNEP</strong>3
<strong>Metal</strong> <strong>Stocks</strong> <strong>in</strong> <strong>Society</strong> – <strong>Scientific</strong> <strong>Synthesis</strong>Table of ContentsPrefaces ___________________________________________________________________________ 2Table of Contents ___________________________________________________________________ 4List of Figures ______________________________________________________________________ 5List of Tables _______________________________________________________________________ 5Abbreviations and Acronyms _________________________________________________________ 6Executive Summary _________________________________________________________________ 91 Nature’s Non-Renewable, Non-Fuel-Resources ________________________________________ 102 The Concept of <strong>Stocks</strong> ________________________________________________________________ 123 Methodology for <strong>Metal</strong> <strong>Stocks</strong> <strong>in</strong> <strong>Society</strong> _______________________________________________ 144 A Review of <strong>Metal</strong> Stock Determ<strong>in</strong>ations _______________________________________________ 174.1 In-use <strong>Stocks</strong> _____________________________________________________________________________ 174.2 <strong>Stocks</strong> <strong>in</strong> Unm<strong>in</strong>ed Ores (“Resources of <strong>Metal</strong>s”) _________________________________________ 204.3 <strong>Stocks</strong> <strong>in</strong> Tail<strong>in</strong>gs _________________________________________________________________________ 204.4 <strong>Stocks</strong> <strong>in</strong> Process<strong>in</strong>g Facilities ____________________________________________________________ 204.5 Government <strong>Stocks</strong> _______________________________________________________________________ 204.6 <strong>Stocks</strong> <strong>in</strong> Manufactur<strong>in</strong>g Facilities ________________________________________________________ 204.7 <strong>Stocks</strong> <strong>in</strong> Recycl<strong>in</strong>g Facilities _____________________________________________________________ 204.8 Landfill Stockpiles ________________________________________________________________________ 205 Outflows from In-Use <strong>Stocks</strong> _____________________________________________________ 226 Potential Users of In-Use-Stock Information _______________________________________ 237 Discussion and Challenges _______________________________________________________ 248 Conclusions ____________________________________________________________________ 27References ________________________________________________________________________ 28Appendices _______________________________________________________________________ 304
<strong>Metal</strong> <strong>Stocks</strong> <strong>in</strong> <strong>Society</strong> – <strong>Scientific</strong> <strong>Synthesis</strong>List of FiguresFigure 1. The Generic Life Cycle of a <strong>Metal</strong>, with Stock Locations Indicated ______________ 12Figure 2. The Nickel Recycl<strong>in</strong>g Map ________________________________________________ 15Figure 3.A Schematic Diagram of the Methodology for Calculat<strong>in</strong>g Outflowsfrom In-Use <strong>Stocks</strong> ______________________________________________________ 22Figure 4. Information Availability on In-Use <strong>Stocks</strong> of <strong>Metal</strong>s __________________________ 24List of TablesTable 1. Extant In-Use <strong>Metal</strong> Stock Estimations for the Major Eng<strong>in</strong>eer<strong>in</strong>g <strong>Metal</strong> _______ 17Table 2. Extant In-Use <strong>Metal</strong> Stock Estimations for Precious <strong>Metal</strong>s __________________ 18Table 3. Extant In-Use <strong>Metal</strong> Stock Estimations for Specialty <strong>Metal</strong>s __________________ 195
<strong>Metal</strong> <strong>Stocks</strong> <strong>in</strong> <strong>Society</strong> – <strong>Scientific</strong> <strong>Synthesis</strong>Abbreviations and AcronymsECEU-15GISMDCLDCUSGSEuropean CommissionEuropean Union with 15 memberstatesGeographic Information SystemThe more-developed countries(MDC): are Australia, Canada, theEuropean Union EU15, Norway,Switzerland, Japan, New Zealand,and the United StatesThe less-developed countries(LDC) consist of all countries exceptthose <strong>in</strong> the “more-developed”categoryUnited States Geological SurveyUnitsgkgMgTgGramKilogram (10 3 grams)Megagram (10 6 grams)Teragram (10 12 grams)metric ton Megagram (10 6 grams)6
<strong>Metal</strong> <strong>Stocks</strong> <strong>in</strong> <strong>Society</strong> – <strong>Scientific</strong> <strong>Synthesis</strong>Chemical AbbreviationsFerrous <strong>Metal</strong>sFe – IronMn – ManganeseV – VanadiumNb – NiobiumCr – ChromiumNi – NickelMo – MolybdenumSi – SiliconBi – BismuthNon-Ferrous <strong>Metal</strong>sAl – Alum<strong>in</strong>iumCo – CobaltCu – CopperPb – LeadMg – MagnesiumSn – T<strong>in</strong>Ti – TitaniumZn – Z<strong>in</strong>cSpecialty <strong>Metal</strong>sSb – AntimonyAs – ArsenicBa – BariumBe – BerylliumB – BoronCd – CadmiumCs – CesiumGa – GalliumGe – GermaniumHf – HafniumIn – IndiumLi – LithiumHg – MercuryRe – RheniumSc – ScandiumSe – SeleniumSr – StrontiumTa – TantalumTe – TelluriumEu – EuropiumGd – Gadol<strong>in</strong>iumTb – TerbiumDy – DysprosiumHo – HolmiumEr – ErbiumTm – ThuliumYb – YtterbiumLu – LutetiumSteel Alloy FamilySS – Sta<strong>in</strong>less SteelST – Steel7Precious <strong>Metal</strong>sAg – SilverAu – GoldPt – Plat<strong>in</strong>umPd – PalladiumRh – RhodiumOs – OsmiumIr – IridiumRu – RutheniumTl – ThalliumW – TungstenY – YttriumZr – ZirconiumLa – LanthanumCe – CeriumPr – PraseodymiumNd – NeodymiumSm – Samarium
<strong>Metal</strong> <strong>Stocks</strong> <strong>in</strong> <strong>Society</strong> – <strong>Scientific</strong> <strong>Synthesis</strong>8
Executive SummaryThe cont<strong>in</strong>ued <strong>in</strong>crease <strong>in</strong> the use of metalsover the twentieth century has led to a substantialshift from geological resource baseto metal stocks <strong>in</strong> society. Such a shift raisessocial, economic, and environmental issuesthat require quantify<strong>in</strong>g the amount of stockof “metal capital” utilized by society. Thisreport reviews the relevant literature on thistopic. From a compilation of 54 studies, it isclear that a reasonably detailed picture of <strong>in</strong>usestocks and <strong>in</strong>-use lifetimes exists for onlyfive metals: alum<strong>in</strong>ium, copper, iron, lead,and z<strong>in</strong>c, and <strong>in</strong> only two cases have spatialstock allocations been performed. Limiteddata suggest that per capita <strong>in</strong>-use stocks <strong>in</strong>more-developed countries typically exceedthose <strong>in</strong> less-developed countries by factorsof five to ten. Sparse but potentially useful<strong>in</strong>-use stock <strong>in</strong>formation exists for n<strong>in</strong>eteenother metals. There is a little <strong>in</strong>formationon stocks <strong>in</strong> government repositories, andessentially none on stocks <strong>in</strong> “hibernation”,<strong>in</strong> tail<strong>in</strong>gs repositories, <strong>in</strong> <strong>in</strong>dustrial stockpiles,or <strong>in</strong> landfills, nor on typical <strong>in</strong>-use lifetimesfor almost the entire periodic table ofthe elements. Outflows from <strong>in</strong>-use stocks,potentially useful for determ<strong>in</strong><strong>in</strong>g future ratesof reuse, can currently be reliably estimatedonly for alum<strong>in</strong>ium, copper, iron, and lead.This is the first of six reports on the stocksand flows of metals, the last of which willdraw upon the first five to address criticalityand policy options related to the susta<strong>in</strong>abilityof metals.
<strong>Metal</strong> <strong>Stocks</strong> <strong>in</strong> <strong>Society</strong> – <strong>Scientific</strong> <strong>Synthesis</strong>1. Nature’s Non-Renewable, Non-FuelResourcesNature provides human society with a richspectrum of start<strong>in</strong>g materials. In practice,the metal m<strong>in</strong>erals constitute the largest setof these resources – more than sixty differentelements <strong>in</strong> all. Modern technology is totallydependent on perhaps four of them – the ironand manganese that (with m<strong>in</strong>or amountsof other metals) form structural steels, thealum<strong>in</strong>ium widely used <strong>in</strong> transportation, thelead used for storage batteries, and the copperthat transmits power from the generatorto the user. Cases nearly as strong could bemade for perhaps four others – the chromiumand nickel that (together with iron) formthe sta<strong>in</strong>less steels, the z<strong>in</strong>c that <strong>in</strong>hibitsmetal corrosion, and the t<strong>in</strong> that is essentialto modern electronics.In actuality, however, hardly any element canbe elim<strong>in</strong>ated from a list of those importantto modern society and cutt<strong>in</strong>g-edge technology.Manufacturers of everyth<strong>in</strong>g from computerchips to health care equipment rout<strong>in</strong>elyemploy dozens of different elements, eachcarefully chosen because of a specific physicalor chemical property. Some have just theright conductivity for a specific purpose, orthe right melt<strong>in</strong>g po<strong>in</strong>t, or the right photonwavelength, or the right catalytic efficiency athigh temperature. It is not generally realized,but modern technology makes use of virtuallyevery gift of nature, and if it doesn’t doso <strong>in</strong> some <strong>in</strong>stances today, it probably willtomorrow.A key question that relates to this very broadand <strong>in</strong>tensive use of metals is whether societyneeds to be concerned about long-termsupplies of any or many of them. This is amany-faceted question that cannot be answeredquickly or unequivocally. To addressit, the Global <strong>Metal</strong> Flows Group envisions aseries of six reports, of which this is the first:Report 1 – <strong>Metal</strong> <strong>Stocks</strong> <strong>in</strong> <strong>Society</strong>Report 2 – Recycl<strong>in</strong>g Rates of <strong>Metal</strong>sReport 3 – Environmental Impact of <strong>Metal</strong>sReport 4 – Geological <strong>Metal</strong> <strong>Stocks</strong>Report 5 – Future Demand Scenarios for <strong>Metal</strong>sReport 6 – Critical <strong>Metal</strong>s and <strong>Metal</strong> Policy OptionsThe first five reports form the necessary basis for Report 6.A number of policy-relevant issues will beaddressed <strong>in</strong> these reports, <strong>in</strong>clud<strong>in</strong>g thefollow<strong>in</strong>g:■ To what extent is <strong>in</strong>formation available onthe metal stocks <strong>in</strong> society? (Report 1)■ How well can scientists quantify the spatialdistributions of metal stocks <strong>in</strong> society?(Report 1)■ What is the efficiency with regard to metalrecovery? (Report 2)10
<strong>Metal</strong> <strong>Stocks</strong> <strong>in</strong> <strong>Society</strong> – <strong>Scientific</strong> <strong>Synthesis</strong>■ What are the recycl<strong>in</strong>g rates of metals <strong>in</strong>various countries, various regions, and theplanet as a whole? (Report 2)■ What are the related environmental impactsof different metal m<strong>in</strong><strong>in</strong>g ref<strong>in</strong><strong>in</strong>gand recycl<strong>in</strong>g techniques? (Report 3)■ To what extent is <strong>in</strong>formation available onthe virg<strong>in</strong> reserves and resources of metals?(Report 4)■ To what extent can end of life discardstreams from electronics, automobiles,and other products be used as a secondarysource of metals? (Report 5)■ For which metals may supplies becomecritical, and over what time frames?(Report 6)■ Is today’s use of metals susta<strong>in</strong>able? If not,what policy options are suggested by the<strong>in</strong>formation developed <strong>in</strong> Reports 1 – 4?(Report 6)The first three of the six reports are <strong>in</strong> thecurrent Terms of Reference and Work Planfor the Group, and are expected to be completedby 2010. The second three are expectedto constitute the Work Plan for the Groupfor the 2010 – 2012 time period.■ What <strong>in</strong>formation is needed to develop realisticscenarios for potential metal stocksand rates of use <strong>in</strong> the future? (Report 5)■ How well can future rates of demand formetals be predicted? (Report 5)11
<strong>Metal</strong> <strong>Stocks</strong> <strong>in</strong> <strong>Society</strong> – <strong>Scientific</strong> <strong>Synthesis</strong>Figure 1.The genericlife cycle ofa metal, withstock locations<strong>in</strong>dicated:1,metal <strong>in</strong> virg<strong>in</strong>ore bodies;2,metal <strong>in</strong> tail<strong>in</strong>gs;3,metal <strong>in</strong>processorstockpiles;2. The Concept of<strong>Stocks</strong>One aspect of the availability of metals concernsthe natural (or virg<strong>in</strong>) stocks of metals:those deposited by geological processes <strong>in</strong>concentrations suitable for be<strong>in</strong>g extractedand processed, now and <strong>in</strong> the future. Thetotal amounts of metals <strong>in</strong> such depositsare difficult to quantify accurately, but globalestimates are publicly reported (e. g., USGS,2008). This <strong>in</strong>formation is important to evaluationsof resource susta<strong>in</strong>ability, but is notthe subject of this report and so is not treatedfurther here<strong>in</strong>.Import / Exportitself, fabricated <strong>in</strong>to products, and thenput <strong>in</strong>to use. Dur<strong>in</strong>g process<strong>in</strong>g, waste rockand impurities conta<strong>in</strong><strong>in</strong>g small amounts ofthe target metals are deposited <strong>in</strong> “tail<strong>in</strong>gsponds”. Some metal is held <strong>in</strong> stockpilesby processors, fabricators, and sometimesby governments. Eventually, the product isdiscarded, perhaps to recycl<strong>in</strong>g, perhaps lostto the environment. The metal <strong>in</strong> one form oranother moves rapidly through most of thesestages, but may stay <strong>in</strong> use for long periods– years, decades, perhaps a century or more.In some cases, such as metal <strong>in</strong> obsoleteundersea cables, the metal is no longer <strong>in</strong>use, but not (yet?) recovered and recycled(Hashimoto et al., 2007). These “hibernat<strong>in</strong>g”stocks are potentially reusable, but their4,metal <strong>in</strong>governmentstockpiles;5,metal <strong>in</strong>manufacturerstockpiles;Process<strong>in</strong>g34Fabrication5Use6DiscardMgt.76,metal <strong>in</strong>-usestock;7,metal <strong>in</strong> recyclerstockpiles;Ore12Environment88,metal <strong>in</strong> landfillstockpiles.Emissions fromthe Use stage aresmall, and not<strong>in</strong>dicated here.12A group of less well studied stocks aretermed “anthropogenic”; these are themetal stocks <strong>in</strong> society, already extracted,processed, put <strong>in</strong>to use, currently provid<strong>in</strong>gservice, or discarded or dissipated over time.These types of metal stocks <strong>in</strong> society canbe appreciated with the help of the life-cyclediagram of Figure 1. <strong>Metal</strong> ores are m<strong>in</strong>edfrom the ground, processed <strong>in</strong>to the metalrecovery may well not be economicallyfeasible. All of these stocks are, <strong>in</strong> pr<strong>in</strong>ciple,the subject of the present report.Material flow analysis characterizes andquantifies flows of materials <strong>in</strong>to, out of, andthrough a system of <strong>in</strong>terest, equat<strong>in</strong>g flowsat each reservoir with<strong>in</strong> the system by conservationof mass. In this analysis, the choice
<strong>Metal</strong> <strong>Stocks</strong> <strong>in</strong> <strong>Society</strong> – <strong>Scientific</strong> <strong>Synthesis</strong>of scale and level is critical (scale is “a spatial,temporal, quantitative, or analytic dimensionused to measure or study a phenomenon”[Gibson et al., 2000], as with a ruler,level is a position along the scale.) The quantityof mass of a chosen material that existswith<strong>in</strong> the system boundary of choice at aspecific time is considered stock with<strong>in</strong> thesystem. In terms of units of measurement,stock is a level variable (i. e., kg), while flowis a rate variable (i. e., kg per unit of time). Ingeneral, the metal stock <strong>in</strong> society is highestby far when material is <strong>in</strong> use (rather than<strong>in</strong> process<strong>in</strong>g, fabrication, manufactur<strong>in</strong>g, orwaste management).The metal portion of <strong>in</strong>-use stock can be def<strong>in</strong>ed<strong>in</strong> two ways. If an <strong>in</strong>dividual element isspecified, <strong>in</strong>-use stock of metal refers to thetotal mass of that element, regardless of itschemical form. If a metal alloy is specified,<strong>in</strong>-use stock of metal refers to the total massof that alloy (<strong>in</strong>clud<strong>in</strong>g all its constituent elements).13
<strong>Metal</strong> <strong>Stocks</strong> <strong>in</strong> <strong>Society</strong> – <strong>Scientific</strong> <strong>Synthesis</strong>3. Methodology for<strong>Metal</strong> <strong>Stocks</strong> <strong>in</strong><strong>Society</strong>The def<strong>in</strong>ition of <strong>in</strong>-use stock is, as discussedpreviously, sensitive to the scale and levelchosen. For reasons of relevance and dataavailability, most studies either explicitly orimplicitly choose a time-scale of one year.System boundaries are typically <strong>in</strong>terpretedto be spatial, and correspond to a pre-def<strong>in</strong>edgeopolitical or <strong>in</strong>dustrial sector boundary(e. g., <strong>in</strong>dustrial region, city, or country).Spatial boundaries are convenient from adata collection standpo<strong>in</strong>t. They also allow forstraightforward normalization of <strong>in</strong>-use stockestimates. Normalization by, for example,people or area with<strong>in</strong> a system boundary isoften desirable when compar<strong>in</strong>g the relativestates of different systems.Once the appropriate time <strong>in</strong>terval and spatiallevel have been chosen, the next step is todef<strong>in</strong>e an estimat<strong>in</strong>g procedure. This quantificationis a considerable challenge, becausethere are no convenient, regularly-collecteddata that can be drawn upon. Instead,one of two complementary methods of estimationmust be employed for the purpose(Brunner and Rechberger, 2004; Gerst andGraedel, 2008).The first method is termed “top-down” anthropogenicstock estimation. Top-down estimationstake <strong>in</strong>formation regard<strong>in</strong>g flows,and <strong>in</strong>fer metal stocks <strong>in</strong> society by comput<strong>in</strong>gthe cumulative difference between <strong>in</strong>flowand outflow. Mathematically, if S tis stock attime t, then <strong>in</strong> discrete time stepsS t =TT o(Inflow t - Outflow t )+ S owhere T ois the time of the <strong>in</strong>itial time step,T is the current time step, and S ois the extantstock at the <strong>in</strong>itial time step. Typically, therange from T oto T is 50 to 100 years, orlonger. This yields the result that S tis muchlarger than So, mak<strong>in</strong>g the contribution of S onegligible because of the general <strong>in</strong>crease <strong>in</strong>metal stocks <strong>in</strong> society over the past severaldecades, and therefore generally unnecessaryto <strong>in</strong>clude <strong>in</strong> practice.In contrast, more recent top-down methodsare utiliz<strong>in</strong>g <strong>in</strong>creas<strong>in</strong>gly complex methods.With the help of comput<strong>in</strong>g power and betteraccess to data, contemporary top-down studieshave been able to disaggregate metal production<strong>in</strong>to <strong>in</strong>flow of specific f<strong>in</strong>al goods categories,and then model discard by def<strong>in</strong><strong>in</strong>glifetime functions for f<strong>in</strong>al product groups.While an improvement, this method is stillcompletely dependent on <strong>in</strong>flow data, becausehistorical outflow data is poor to nonexistent.Future efforts to collect historicaldata on outflows would allow for a well-neededempirical check on the results creat<strong>in</strong>g bydiscard models (see Ruhrberg (2006) for anexample).The types of available data have a significanteffect on the system boundary def<strong>in</strong>ed fortop-down analyses. Time steps are typicallyone year, because most applicable data areavailable as per year flows. The data used for<strong>in</strong>flow is gathered from government documents,technical literature, expert elicitation,and <strong>in</strong>dustry trade organizations. Usually, littlediscussion is spent on the relative reliabilityof these various sources. The appropriatespatial boundary is heavily dependent on theunderly<strong>in</strong>g data available, and as most <strong>in</strong>flowdata are only collected at the country-level,this limits the scope of application. This canbe problematic if higher spatial resolution isdesired.The “bottom-up” method takes an oppositestrategy to top-down methods because itgathers <strong>in</strong>formation on stock variables toestimate <strong>in</strong>-use stock, and (if desired) <strong>in</strong>ferthe behaviour of flows. In its simplest form,estimat<strong>in</strong>g <strong>in</strong>-use stock via the bottom-upmethod is represented bywhere N itis thequantity of f<strong>in</strong>al good i <strong>in</strong>-use at time t, m itis14
<strong>Metal</strong> <strong>Stocks</strong> <strong>in</strong> <strong>Society</strong> – <strong>Scientific</strong> <strong>Synthesis</strong>the metal content of <strong>in</strong>-use f<strong>in</strong>al productgroup I (see Appendix 1), and A is the numberof different types of f<strong>in</strong>al goods.S t =AiN it m itMore complicated versions of the bottom-upmethod keep the same formulation of Equation2, but allow for more precise def<strong>in</strong>itionsof the good categories and metal contents.The types of available data also have a significanteffect on the system boundaries ofbottom-up approaches. As with the top-downmethod, most data collected are <strong>in</strong>terpretedas be<strong>in</strong>g representative of a year time period.In this case though, the data are of stockexistent dur<strong>in</strong>g a year <strong>in</strong>stead of the rate offlow per year. Also <strong>in</strong> similarity with the datacollected for the top-down approach, datacollected for the bottom-up approach are oftenconstra<strong>in</strong>ed by geopolitical boundaries.However, this constra<strong>in</strong>t is often not as strictfor bottom-up methods, because stock-relevant(e. g., houses or cars) data are frequentlyavailable at the city/town or lower level of aggregation.M<strong>in</strong><strong>in</strong>glaterites /sulphitesConcentrationlaterites /sulphitesSmelt<strong>in</strong>gferro-Ni /mattesSimplified map of significant nickel andnickel-conta<strong>in</strong><strong>in</strong>g material flow aOther metalsCarbon steelRef<strong>in</strong><strong>in</strong>gmetalic NiNi chemicalsSta<strong>in</strong>less steelNi aloysLow aloy steelsFigure 2.SemimanufactureSemimanufactureSemimanufactureThe nickelrecycl<strong>in</strong>g map(adapted fromDubreuil et al.,2009).<strong>Metal</strong> f<strong>in</strong>ish<strong>in</strong>gUseBattery chemistries& catalystsUseManufacture andassemblyUseManufacture andassemblyUseManufacture andassemblyUseCollectionCollectionCollectionCollectionCollectionDisassemblyLoss (disposal and emissions)Exit to carbon steel15a This map focuses on product end of life recycl<strong>in</strong>g. Recycl<strong>in</strong>gflows from process<strong>in</strong>g and manufactur<strong>in</strong>g are not illustrated.Nickel (Ni) commodity and productNi conta<strong>in</strong><strong>in</strong>g disposals/lossesNi recycl<strong>in</strong>gconnections to other metal pools
<strong>Metal</strong> <strong>Stocks</strong> <strong>in</strong> <strong>Society</strong> – <strong>Scientific</strong> <strong>Synthesis</strong>In these cases, where high spatial resolutionand good count data for N itare acquired, precision<strong>in</strong> determ<strong>in</strong><strong>in</strong>g metal content becomesthe limitation. For many new f<strong>in</strong>al goods be<strong>in</strong>g<strong>in</strong>put <strong>in</strong>to use, such as mach<strong>in</strong>ery, electronics,and cars, metal content can bemeasured or obta<strong>in</strong>ed from manufacturers.Goods such as build<strong>in</strong>gs are more difficultbecause they are less of a mass-producedcommodity. However, us<strong>in</strong>g the metal contentof new goods to <strong>in</strong>fer the metal contentof <strong>in</strong>-use stock can be problematic, because<strong>in</strong>-use stock conta<strong>in</strong>s an amalgam of stockv<strong>in</strong>tages that have been accumulated overtime. For example, apply<strong>in</strong>g the copper contentof a newly built house to a house built<strong>in</strong> the 1950s would yield a mislead<strong>in</strong>g result.Alleviation of this data problem may prove tobe difficult as it would require either a statisticallysignificant regime of sampl<strong>in</strong>g of themetal content of <strong>in</strong>-use stock, or a significanthistorical <strong>in</strong>vestigation of eng<strong>in</strong>eer<strong>in</strong>g designplans for various goods.Although both methods seek to measure thesame quantity, they work <strong>in</strong> fundamentallydifferent ways, and current datasets andtechnology are more appropriate for somegoals than others. Inherent <strong>in</strong> the top-downmethod is evolution over time. As a result,that approach is often employed where <strong>in</strong>flow/outflowtime series data are available.Because the top-down method is, to someextent, a more derived estimate of stock thanthe bottom-up method, it could be viewed asless precise. However, the bottom-up methodis h<strong>in</strong>dered by the <strong>in</strong>ability to count everyth<strong>in</strong>g<strong>in</strong> use, and from uncerta<strong>in</strong>ties as to the metalcontent of many of the units be<strong>in</strong>g <strong>in</strong>cluded <strong>in</strong>the assessment. This trade-off must be considered<strong>in</strong> the context of the study goal. If amore detailed and spatially explicit analysis isdesired, then the bottom-up method is likelyto be more desirable. If less detail is acceptable,and larger temporal and spatial scale isthe focus, then the top-down method may bethe more appropriate method to employ.<strong>Metal</strong>s are rarely used <strong>in</strong> the pure form, butrather <strong>in</strong> alloys. From a thermodynamic po<strong>in</strong>tof view and from the economic perspective, itis not always feasible to “un-mix” the alloy totheir metallic constituent. For noble metals(gold, plat<strong>in</strong>um group metals, copper, leadfor example), the recycl<strong>in</strong>g can produce themetal at high purity level. In contrast, nickeland chromium <strong>in</strong> sta<strong>in</strong>less steel alloys willbe recycled as sta<strong>in</strong>less steel, but no nickelwill be produced (see Figure 2). In orderto report the stock of nickel, it is desirable toexpress stock as divided among the pr<strong>in</strong>cipaluses such as batteries & catalysts, low alloysteels, etc. Bottom-up studies are capableof do<strong>in</strong>g this, and some of these studies arequite detailed <strong>in</strong> this regard (e. g., Rostkowskiet al., 2007).The above procedures do not apply to stocksof metals below the ground, either <strong>in</strong> virg<strong>in</strong>ores or <strong>in</strong> landfills. For the former, it is necessaryto rely on <strong>in</strong>formation from test drill<strong>in</strong>gssupplemented and <strong>in</strong>terpreted by geologicaltheory. In the case of landfills, thedata are so sparse that rough estimates aremade based on calculations of discard ofend-of-life products comb<strong>in</strong>ed with <strong>in</strong>formationon the amount of recycled metal usedover time.16
<strong>Metal</strong> <strong>Stocks</strong> <strong>in</strong> <strong>Society</strong> – <strong>Scientific</strong> <strong>Synthesis</strong>4. A Review of<strong>Metal</strong> <strong>Stocks</strong>Determ<strong>in</strong>ations4.1 In-Use <strong>Stocks</strong>Given the def<strong>in</strong>ition of <strong>in</strong>-use stock andestimation methodologies, comparison ofmetal stock estimates from the literature canbe made. A review of the scholarly literature,as well as <strong>in</strong>dustry publications and presentations,yielded a total of 54 studies of metalstocks <strong>in</strong> society from the peer-reviewedliterature, published reports, and personalcommunications. The publication dates rangefrom 1932 to 2007, with 70 % of those publicationsoccurr<strong>in</strong>g after the year 2000. Twentyfourdifferent metals (22 elements and 2 alloygroups) have been addressed, with a total of124 metal stock <strong>in</strong>-use estimates, a few ofwhich provide dynamic temporal <strong>in</strong>formation.The <strong>in</strong>dividual data assembled <strong>in</strong> our revieware presented <strong>in</strong> two Appendices: a specificationof the pr<strong>in</strong>cipal f<strong>in</strong>al product categories(i. e., the sectors of pr<strong>in</strong>cipal use) <strong>in</strong> whicheach metal resides when <strong>in</strong> use (<strong>in</strong>formationnecessary for bottom-up studies), and a list<strong>in</strong>gof all the extant per-capita <strong>in</strong>-use stockdeterm<strong>in</strong>ations, by locale, applicable year,amount, and reference source. We contentourselves here with a presentation of a summaryon a per capita basis and a discussionof the overall picture shown by the data. Wealso note that few of the papers deal with uncerta<strong>in</strong>ty<strong>in</strong> the data, despite the general impressionthat those uncerta<strong>in</strong>ties are large(see, for example, Hebrant and Sörme, 2001).Table 1 lists the summarized <strong>in</strong>-use stock<strong>in</strong>formation for the major eng<strong>in</strong>eer<strong>in</strong>g metals.Copper, lead, z<strong>in</strong>c, and iron are the topfour metals <strong>in</strong> terms of number of estimates<strong>in</strong> the study pool. Alum<strong>in</strong>ium’s stock <strong>in</strong>society is also fairly well characterized. Thereare several determ<strong>in</strong>ations for sta<strong>in</strong>less steel,Table 1.Extant In-Use<strong>Metal</strong> StockEstimationsfor the MajorEng<strong>in</strong>eer<strong>in</strong>g<strong>Metal</strong>s a<strong>Metal</strong>Number ofestimatesPercent ofall estimatesGlobal percapita stockMDC percapita stock bLDC percapita stock cAlum<strong>in</strong>um 9 7.4 80 350 – 500 35Copper 34 27.0 35 – 55 140 – 300 30 – 40Iron 13 10.7 2200 7000 – 14000 2000Lead 20 16.4 8 20 – 150 1 – 4Steel 1 0.8 7085Sta<strong>in</strong>lesssteel5 4.1 80 – 180 15Z<strong>in</strong>c 14 11.5 80 – 200 20 – 40a The years of the determ<strong>in</strong>ations <strong>in</strong> Tables 1 – 3 vary, but most are for the period 2000 – 2006. The units of per capita stock arekg of metal <strong>in</strong> most cases, but g of metal for cadmium, gold, mercury, palladium, plat<strong>in</strong>um, rhodium, and silver. The totalnumber of estimates is 124.b The more-developed countries (MDC) used <strong>in</strong> this calculation are Australia, Canada, the European Union EU15, Norway,Switzerland, Japan, New Zealand, and the United States (altogether about 860 million people <strong>in</strong> 2005).c The less-developed countries (LDC) used <strong>in</strong> this calculation consist of all countries except those <strong>in</strong> the “more-developed”category (altogether about 5620 million people <strong>in</strong> 2005).17
<strong>Metal</strong> <strong>Stocks</strong> <strong>in</strong> <strong>Society</strong> – <strong>Scientific</strong> <strong>Synthesis</strong>and one for the aggregate of all types of steel(a mixture that is roughly 95 % iron). Geographically,an overwhelm<strong>in</strong>g majority of theestimates concern more-developed countries.Ona global basis, top-down estimatesfor <strong>in</strong>-use stocks exist for only four of theseelements: alum<strong>in</strong>ium, copper, iron, and lead.The per capita stock of iron is largest, asbefits its high rate of flow <strong>in</strong>to use; alum<strong>in</strong>ium’sstock is slightly larger than that ofcopper, and that for lead is significantlylower. (Global values are generated by divid<strong>in</strong>gtotal estimated <strong>in</strong>-use stock by globalpopulation. The results should not be <strong>in</strong>terpretedas suggest<strong>in</strong>g equivalent per capita<strong>in</strong>-use stocks around the world; most stocksclearly reside <strong>in</strong> more-developed countries.)a bottom-up basis. The locales are diverse:Stockholm, Vienna, New Haven, Cape Town,Beij<strong>in</strong>g, and Sydney. There are still too fewbottom-up studies to evaluate the accuracy ofthis approach, although where comparisonsof results can be made, they appear reasonable.At the city level, it is possible to allocatethe stock on a spatial basis, and this hasbeen done for Cape Town and Sydney.Anthropogenic stock estimates exist for fiveprecious metals, as shown <strong>in</strong> Table 2; mostare for more developed countries. The exceptionis silver, for which a rather poorly documentedglobal estimate exists.Table 2.Extant In-Use<strong>Metal</strong> StockEstimationsfor Precious<strong>Metal</strong>s. a<strong>Metal</strong>Number ofestimatesPercent ofall estimatesGlobal percapita stockMDC percapita stock bGold 2 1.6 35 – 90Palladium 2 1.6 1 – 4Plat<strong>in</strong>um 2 1.6 1 – 3Rhodium 1 0.8 0.2Silver 2 1.6 110 13LDC percapita stock ca The years of the determ<strong>in</strong>ations <strong>in</strong> Tables 1 – 3 vary, but most are for the period 2000 – 2006. The units of per capita stock arekg of metal <strong>in</strong> most cases, but g of metal for cadmium, gold, mercury, palladium, plat<strong>in</strong>um, rhodium, and silver. The totalnumber of estimates is 124.b The more-developed countries (MDC) used <strong>in</strong> this calculation are Australia, Canada, the European Union EU15, Norway,Switzerland, Japan, New Zealand, and the United States (altogether about 860 million people <strong>in</strong> 2005).c The less-developed countries (LDC) used <strong>in</strong> this calculation consist of all countries except those <strong>in</strong> the “more-developed”category (altogether about 5620 million people <strong>in</strong> 2005).18Few stock estimates are available on a regionalbasis - only alum<strong>in</strong>ium for Europe,copper for North America and Europe, andsta<strong>in</strong>less steel for several. The stock evaluationsare all quite recent, and appear reasonablyreliable. On a country basis, data existfor Japan, USA, Australia, and several Europeancountries.Urban-level evaluations have been performedfor several metals and several cities, all onFor the “specialty metals” (those used <strong>in</strong>more modest quantities than the major eng<strong>in</strong>eer<strong>in</strong>gmetals, particular for unique physicalor chemical properties), Table 3 gives the anthropogenicstock estimates. Twelve differentmetals are listed, none with more than threedeterm<strong>in</strong>ations. The only global estimate <strong>in</strong>this group is for cadmium; it is seriously outof date and cannot be regarded with confidence.In a recent unpublished presentation,Halada (2008) described a top-down esti-
<strong>Metal</strong> <strong>Stocks</strong> <strong>in</strong> <strong>Society</strong> – <strong>Scientific</strong> <strong>Synthesis</strong>mate of <strong>in</strong>-use stocks for some 20 elements<strong>in</strong> Japan; he found that the Japanese <strong>in</strong>-usestocks of gold, <strong>in</strong>dium, silver, t<strong>in</strong>, and tantalumwere 10 – 20 % of estimated virg<strong>in</strong> reservesof those metals, <strong>in</strong>dicat<strong>in</strong>g the importanceof enhanced reserach efforts for theseless-abundant metals.For the more-developed countries, there issufficient <strong>in</strong>formation <strong>in</strong> Table 1 to computean average person’s allocation of <strong>in</strong>-usemetal stock. Do<strong>in</strong>g so demonstrates thedependence of modern lifestyles on a substantialstock of metal, a perspective especiallyuseful because few <strong>in</strong>dividuals areaware of their share of metals <strong>in</strong> <strong>in</strong>frastructuressuch as communications, rail networks,and power generation and distributionsystems, as well as <strong>in</strong> their personal homesand vehicles. The average more-developedcountry citizen’s <strong>in</strong>-use metal stock is betweenten and fifteen metric tons. Of thisamount, five metals – iron, alum<strong>in</strong>ium,copper, z<strong>in</strong>c, and manganese, make up morethan 98 %.One feature of the limited data is that thereappear to be significant differences atpresent <strong>in</strong> the per capita <strong>in</strong>-use stock of themore-developed and less-developed countries.Additionally, when measured at differentspatial levels suburban residents appearto have larger per capita <strong>in</strong>-use stock thando urban or especially rural residents, althoughthis is an observation that needs <strong>in</strong>putfrom future research on <strong>in</strong>-use stock variations.Given the obvious wealth discrepancies,these results seem qualitatively reasonable,but much work rema<strong>in</strong>s to be done tobetter understand stocks from a spatial (orspatial analytical level) perspective. An additionalfactor is that tak<strong>in</strong>g <strong>in</strong>to account an entirenation may <strong>in</strong>crease the per capita <strong>in</strong>-usestock due to <strong>in</strong>frastructure and other <strong>in</strong>-usef<strong>in</strong>al goods that occur only <strong>in</strong> sparsely populatedareas. Such f<strong>in</strong>al goods may <strong>in</strong>cludeships, large trucks, heavy <strong>in</strong>dustrial equipment,offshore drill<strong>in</strong>g equipment, railways,military hardware, and aircraft.Table 3.. Extant In-Use<strong>Metal</strong> StockEstimationsfor Specialty<strong>Metal</strong>s. a<strong>Metal</strong>Number ofestimatesPercent ofall estimatesGlobal percapita stockMDC percapita stock bAntimony 1 0.8 1Cadmium 3 2.5 40 80Chromium 3 2.5 7 – 50Cobalt 1 0.8 1Magnesium 1 0.8 5Manganese 1 0.8 100Mercury 1 0.8 10LDC percapita stock cMolybdenum1 0.8 3Nickel 3 2.5 2 – 4T<strong>in</strong> 2 1.6 3Titanium 1 0.8 13Tungsten 1 0.8 119a/b/c see table 2
<strong>Metal</strong> <strong>Stocks</strong> <strong>in</strong> <strong>Society</strong> – <strong>Scientific</strong> <strong>Synthesis</strong>For perhaps only copper, iron, alum<strong>in</strong>ium,and lead, and only for the more-developedcountries, can we feel we have enough <strong>in</strong>formationto give us a reliable estimate of thestocks of metal <strong>in</strong> use. Nonetheless, the orderof magnitude of <strong>in</strong>-use stocks, for thosemetals, at least, can readily be appreciatedfrom the <strong>in</strong>formation assembled here<strong>in</strong>.4.6 <strong>Stocks</strong> <strong>in</strong> Manufactur<strong>in</strong>gFacilitiesNo general <strong>in</strong>formation is available on manufacturerstockpiles. Most material movesrapidly through process<strong>in</strong>g facilities, so thequantities <strong>in</strong> these stockpiles are probablyrelatively small.4.2 <strong>Stocks</strong> <strong>in</strong> Unm<strong>in</strong>ed Ores(“Resources” of <strong>Metal</strong>s)This subject will be addressed <strong>in</strong> Report 4 ofthe Global <strong>Metal</strong> Flows Group and is not discussedhere<strong>in</strong>.4.3 <strong>Stocks</strong> <strong>in</strong> Tail<strong>in</strong>gsThe metal contents of tail<strong>in</strong>gs are highly dependenton the efficiency of the separationprocess applied to the ore that was m<strong>in</strong>ed.Modern m<strong>in</strong>es measure the metals concentrations<strong>in</strong> tail<strong>in</strong>gs discards, but the <strong>in</strong>formationis generally proprietary. We know of nostock estimates at levels higher than <strong>in</strong>dividualprocess<strong>in</strong>g facilities.4.4 <strong>Stocks</strong> <strong>in</strong> Process<strong>in</strong>g FacilitiesNo general <strong>in</strong>formation is available on processorstockpiles. Most material moves rapidlythrough process<strong>in</strong>g facilities, so the quantities<strong>in</strong> these stockpiles are probably relativelysmall.4.7 <strong>Stocks</strong> <strong>in</strong> Recycl<strong>in</strong>g FacilitiesNo general <strong>in</strong>formation is available on recyclerstockpiles. Most material moves rapidlythrough process<strong>in</strong>g facilities, so the quantities<strong>in</strong> these stockpiles are probably relativelysmall.4.8 Landfill StockpilesLittle <strong>in</strong>formation is available on the amountand location of metals <strong>in</strong> landfills. We areaware of only two estimates: for iron <strong>in</strong> U.S.landfills (850 Tg Fe; Müller et al., 2006), andfor copper <strong>in</strong> global landfills (225 Tg Cu; Kapur,2004). These amounts are relativelylarge, but the material <strong>in</strong> landfills is widelydispersed and resides <strong>in</strong> discarded productsrather than ores. There are no <strong>in</strong>stancesof any significance where metal has beenrecovered from landfill stocks. In the case ofmaterials whose use is <strong>in</strong>creas<strong>in</strong>gly regulated(e. g., mercury and cadmium), the landfillstock may, over time, exceed the stock <strong>in</strong> use.4.5 Government StockpilesAt least three governments, Japan, Ch<strong>in</strong>a,and the United States, are known to ma<strong>in</strong>ta<strong>in</strong>stockpiles of selected metals. Thosefor Japan are reported to be completed byY. Moriguchi. There is no official <strong>in</strong>formationon Ch<strong>in</strong>a’s stockpiles, though some estimatesare made (Shanghai <strong>Metal</strong> Corporation,2008). Those for the United States arereported <strong>in</strong> USGS (2008 and preced<strong>in</strong>g years).20
<strong>Metal</strong> <strong>Stocks</strong> <strong>in</strong> <strong>Society</strong> – <strong>Scientific</strong> <strong>Synthesis</strong>21
<strong>Metal</strong> <strong>Stocks</strong> <strong>in</strong> <strong>Society</strong> – <strong>Scientific</strong> <strong>Synthesis</strong>5. Outflows from In-Use <strong>Stocks</strong>Figure 3.A schematicdiagram of themethodologyfor calculat<strong>in</strong>goutflows from<strong>in</strong>-use stocks.Outflows (if recycled) from <strong>in</strong>-use stock representa resource that decreases the requirementsfor m<strong>in</strong><strong>in</strong>g of virg<strong>in</strong> material (as wellas the associated environmental consequences).Although the amount of outflow (the “secondarymaterial”) that is supplied to smeltersand ref<strong>in</strong>ers is generally measured, the outflowitself is not, so must be computed.The outflow computation requires dynamic<strong>in</strong>formation on <strong>in</strong>flows over a number ofyears, plus estimates of the fractions of thatflow enter<strong>in</strong>g each of the major uses, plusestimates of the average lifetimes of thoseuses, as shown <strong>in</strong> Figure 3.It is important to mention that the potentialrecyclability of the several <strong>in</strong>dividual outflowscan be quite different. For example, the recoveryefficiency of copper from <strong>in</strong>frastructureis much more efficient than from electronics.In the recycl<strong>in</strong>g report of this work<strong>in</strong>ggroup (to be completed), these issues willbe addressed <strong>in</strong> some detail. In most uses,some metal is lost to the environment byprocesses such as dissipation or corrosion.The amounts are quite small relative to otherflows, however (e. g., Wang et al., 2007; Maoet al., 2008), and can be neglected for purposesof assess<strong>in</strong>g metal stocks <strong>in</strong> society.22
<strong>Metal</strong> <strong>Stocks</strong> <strong>in</strong> <strong>Society</strong> – <strong>Scientific</strong> <strong>Synthesis</strong>6. Potential Usersof In-Use StockInformationM<strong>in</strong><strong>in</strong>g Industries. The m<strong>in</strong><strong>in</strong>g <strong>in</strong>dustries extractand concentrate m<strong>in</strong>erals. Their operationsoften produce a number of by-productmetals as a result of m<strong>in</strong>eral associations <strong>in</strong>the ore. The <strong>in</strong>terest of this sector is primarily<strong>in</strong> the susta<strong>in</strong>ability of metal markets and<strong>in</strong> the future demand for virg<strong>in</strong> metals, a demandthat is enhanced by <strong>in</strong>creas<strong>in</strong>g per capitaresource <strong>in</strong>tensity throughout the worldand reduced by recycled scrap that can substitutefor virg<strong>in</strong> metal. Perspectives potentiallyuseful to these <strong>in</strong>dustries <strong>in</strong>clude metal<strong>in</strong>-use stock estimates to measure the stockof metal required to deliver any given serviceto a population, and the creation of scenariosof potential metal demand based on differentassumptions of technology choice, populationgrowth, and other relevant parameters suchas the substitution for certa<strong>in</strong> major uses ofthe metal by other metals or manmade materials(as <strong>in</strong> the substitution of copper electricalwire by alum<strong>in</strong>ium wire). The paucity of<strong>in</strong>-use stock estimates, a lack of metal demandscenarios, and the absence of stockdiscard scenarios have to date preventedthese <strong>in</strong>dustries from utiliz<strong>in</strong>g <strong>in</strong>-use stock<strong>in</strong>formation <strong>in</strong> these ways. All these considerationsapply as well to countries for whichm<strong>in</strong><strong>in</strong>g is an important part of the nationaleconomy, especially if the m<strong>in</strong>es are undergovernmental control.<strong>Metal</strong> Production Industries. These <strong>in</strong>dustriesproduce metal from either ore or recycledscrap <strong>in</strong>to metal of desired purity. Theycould benefit from scenarios of discards fromstock <strong>in</strong> use, especially if the form of themetal (alloy, coated metal, etc.) were part ofthe scenario. Current <strong>in</strong>-use stock studiesprovide the basis for scenario development,but the analyses rema<strong>in</strong> to be done.Waste Management and Scrap Industries.The primary function of the waste managementand scrap <strong>in</strong>dustries is to recover metalsand m<strong>in</strong>imize their loss to the environment.The factors determ<strong>in</strong><strong>in</strong>g which path ametal might take <strong>in</strong>clude the concentrationand speciation of metal <strong>in</strong> discarded goods,the ease of separation and concentration,and by what manner the metal is discarded(separated or mixed). Thus, waste managementand scrap <strong>in</strong>dustries have as their basic<strong>in</strong>puts materials which are spatially-heterogeneousand that embody a significantamount of uncerta<strong>in</strong>ty with regard to materialcontent and tim<strong>in</strong>g of discard. Here, <strong>in</strong>-usestock <strong>in</strong>formation <strong>in</strong> itself is not of value here,but discard scenarios l<strong>in</strong>ked to <strong>in</strong>-use stockwith relatively high temporal and spatial resolutioncould be.Public Health and Environmental Agencies.Unlike the potential users discussed above,who are concerned with the quantity andform of metals recovered at discard, theseagencies are concerned with the quantity andform of metals that are discarded or dissipatedand not recovered. As with the waste management<strong>in</strong>dustries, they would value discardscenarios with high spatial resolution, <strong>in</strong> orderto predict effects on public health and/orthe environment.Public Policy Organizations. These organizationsare diverse, with many different goals.Economic and national security policy-makersare often concerned with hav<strong>in</strong>g adequatescrap supply for certa<strong>in</strong> metals <strong>in</strong> the caseof disruption of trade <strong>in</strong> either metal commoditiesor f<strong>in</strong>al goods conta<strong>in</strong><strong>in</strong>g metals.Environmental policy-makers, at least <strong>in</strong> thecontext of resource efficiency, are concernedwith promot<strong>in</strong>g the environmental benefitsof metal recycl<strong>in</strong>g, a goal that would be betterenabled by discard data and/or scenarioswith high spatial resolution.23
<strong>Metal</strong> <strong>Stocks</strong> <strong>in</strong> <strong>Society</strong> – <strong>Scientific</strong> <strong>Synthesis</strong>7. Discussion and ChallengesFigure 4.Informationavailability on<strong>in</strong>-use stocks ofmetals.24Anthropogenic metal stock estimation hasthe potential to address several <strong>in</strong>terest<strong>in</strong>gand pert<strong>in</strong>ent questions concern<strong>in</strong>g the futureof metal use <strong>in</strong> society and associatedenvironmental impacts, such as:■ Patterns <strong>in</strong> the way different societies ornations use, accumulate, and discard metalthat is relevant to <strong>in</strong>vestigat<strong>in</strong>g futuredemand scenario■ The comparative quality and amount ofmetal <strong>in</strong> natural and anthropogenic stocks,and the potential of this <strong>in</strong>formation to <strong>in</strong>formdiscussions large-scale m<strong>in</strong><strong>in</strong>g ofcities?■ Ways <strong>in</strong> which the scale of environmentalimpacts from dissipative uses (corrosion,wear, etc.) change with <strong>in</strong>creas<strong>in</strong>g populationgrowth and affluence?■ Scrap generation rate predictions (national,regional, global), and the virg<strong>in</strong> materialdemand offset that this scrap wouldprovide■ Stimulat<strong>in</strong>g the development of effectivepublic policy to <strong>in</strong>crease collection andrecovery.Given the very wide spectrum of metal use <strong>in</strong>modern technology, it is noteworthy that foronly about a third of the metals do we haveany metal stock <strong>in</strong> society <strong>in</strong>formation at all,and for perhaps only five or six do we knowenough to feel relatively comfortable with thequantification (Figure 4). Additionally, it israre to nonexistent that any dynamic <strong>in</strong>formationis available; most stock estimates areno more than “snapshots <strong>in</strong> time”. Dynamicstock <strong>in</strong>formation has the potential to revealmuch useful <strong>in</strong>formation about the evolutionof resource use, and should be actively pursued(see, for example, Månsson et al., 2009).
<strong>Metal</strong> <strong>Stocks</strong> <strong>in</strong> <strong>Society</strong> – <strong>Scientific</strong> <strong>Synthesis</strong>25There are what seem to be obvious gaps <strong>in</strong>the <strong>in</strong>formation available for materials used<strong>in</strong> large quantities. For example, there appearsto exist no global estimate for z<strong>in</strong>cstocks <strong>in</strong> society. Neither are there globalstock estimates for the major alloy<strong>in</strong>g metalschromium, manganese, nickel, and t<strong>in</strong>, andonly a few at country level for these metals.The stocks of magnesium, a light metal see<strong>in</strong>g<strong>in</strong>creas<strong>in</strong>g use <strong>in</strong> reduced-weight vehicles,have been evaluated only <strong>in</strong> Japan. Foruranium and zirconium, necessary elementsfor nuclear power, there are no extant stockestimates at all.Anthropogenic stock estimates of the specialtymetals are almost nonexistent. Thissituation is partly due to lack of data, partly tolack of <strong>in</strong>terest <strong>in</strong> such studies <strong>in</strong> the past fewdecades. One might target for attention thelanthanides (separately or as a group), whichsee extensive use <strong>in</strong> electronics and medicalequipment, and <strong>in</strong>dium, an element essentialat present for flat-panel displays, and oneperceived to be under supply pressure as itis only available as a byproduct of z<strong>in</strong>c oreprocess<strong>in</strong>g (Fraunhofer Institute for Systemsand Innovation Research, 2009).Another obvious area of need is anthropogenicstock studies focused on less-developedcountries. The gaps between the stocksof those countries and those of more-developedcountries have much to tell us aboutpotential future demands for resources, butlittle effort is underway to fill those knowledgegaps.Quantification of metal stocks <strong>in</strong> society islimited by the availability of data <strong>in</strong> most cases.Information on flows <strong>in</strong>to use is generallybetter than on flows out of use. Were governmentsto rout<strong>in</strong>ely collect discard, recycl<strong>in</strong>g,and waste data, <strong>in</strong>-use stock estimates couldbe significantly improved.It is notable that very few studies of <strong>in</strong>-usestocks make any attempt to discuss or estimateuncerta<strong>in</strong>ty. Unlike laboratory systemswhere uncerta<strong>in</strong>ty can be rather preciselydeterm<strong>in</strong>ed, <strong>in</strong>-use stock uncerta<strong>in</strong>ty is relatedto such factors as the average lifetimesof different products groups and the elementalcompositions of build<strong>in</strong>gs and equipment,which have significant but poorly determ<strong>in</strong>edvariability. Some researchers (e. g., Rostkowskiet al., 2007) have discussed potentialsources of error <strong>in</strong> these studies. It is thoughtthat recent stock estimates are accurate toperhaps +/- 25 %, and such accuracies areperfectly adequate bases on which to basepublic policy.An avenue of research yet to be extensivelyexplored is that of spatially-explicit <strong>in</strong>-usestock estimation. van Beers and Graedel(2007) have shown <strong>in</strong> a bottom-up study thatrelatively f<strong>in</strong>e spatial resolution can be obta<strong>in</strong>edthrough the utilization of GIS and spatially-explicitstock and population data. A recentstudy by Terakado et al. (2009) attemptedto estimate the spatial distribution of the<strong>in</strong>-use stock of copper <strong>in</strong> Japan by utilizationof nocturnal light images from satellite.This appears to be the first effort to exploitthe comb<strong>in</strong>ation of GIS and remote sens<strong>in</strong>gfor <strong>in</strong>ferr<strong>in</strong>g <strong>in</strong>-use metal stock. Such workcould be advantageous, as the results couldbe l<strong>in</strong>ked with other spatial attributes usefulto decision makers.It is worth not<strong>in</strong>g that a variety of spatialboundaries have been the subject of anthropogenicstock studies, and one could askwhat makes the choice of a city or any othergeopolitical border appropriate for a stockstudy? The answer depends on the problemfor which the <strong>in</strong>-use stock estimate is to beused. If one seeks to create a map of <strong>in</strong>-usestock for the purpose of provid<strong>in</strong>g <strong>in</strong>sight <strong>in</strong>tofuture scrap flows, then a geopolitical or anyother sort of spatial boundary seems appropriate.Similarly, city boundaries are useful<strong>in</strong> employ<strong>in</strong>g <strong>in</strong>-use stock studies to estimatedissipative outflows (e. g., Sörme and Lagerkvist,2002; McKenzie et al., 2009) However,if one seeks to <strong>in</strong>fer conclusions aboutpopulation affluence via <strong>in</strong>-use stock, a systemthat (such as city borders) is too smallmight be <strong>in</strong>appropriate for some metals. Forexample, a small spatial boundary might beappropriate for a metal which is mostly con-
<strong>Metal</strong> <strong>Stocks</strong> <strong>in</strong> <strong>Society</strong> – <strong>Scientific</strong> <strong>Synthesis</strong>ta<strong>in</strong>ed <strong>in</strong> residential build<strong>in</strong>gs, but not formetals which have significant stocks <strong>in</strong> <strong>in</strong>frastructureor manufactur<strong>in</strong>g equipmentthat could be outside of the city border. Evenif a spatial boundary as large as a country ischosen, stocks <strong>in</strong> a different country or cont<strong>in</strong>ent,such as manufactur<strong>in</strong>g equipment,could still be thought of as be<strong>in</strong>g used by thepopulation <strong>in</strong> the system boundary. The sameis true of metal <strong>in</strong> potentially m<strong>in</strong>eable tail<strong>in</strong>gs.The answer could be to consider theseas “hidden” stocks, much as the concept ofhidden flows has been developed <strong>in</strong> the materialflow analysis literature (Adriaanse etal., 1997).All of the gaps discussed above are unlikelyto be filled very soon unless more researchersbecome <strong>in</strong>volved and unless more f<strong>in</strong>ancialsupport for their efforts is forthcom<strong>in</strong>g.At present, nearly all the anthropogenicstocks research is occurr<strong>in</strong>g <strong>in</strong> one smallgroup each <strong>in</strong> Japan and the USA, and occasionalefforts by groups <strong>in</strong> Europe. The scaleof the need clearly outweighs the resourcesand staff currently striv<strong>in</strong>g to fill that need.All potential applications of <strong>in</strong>-use stock <strong>in</strong>formationcan benefit from significant improvements<strong>in</strong> the science of produc<strong>in</strong>g <strong>in</strong>usestock estimates. First, the overall methodologywould benefit from a blend<strong>in</strong>g of thetop-down and bottom-up methods, <strong>in</strong>corporat<strong>in</strong>gthe detail of bottom-up methods withthe temporal aspect of top-down methods.(Only one study that compares results of bothmethods <strong>in</strong> a specific location (Ch<strong>in</strong>a <strong>in</strong> 2005;Wang et al., 2009) is known to us. It is encourag<strong>in</strong>gthat the methods give very similarresults.) Second, the regional specificity must<strong>in</strong>crease. A large majority of the studies reviewedare from developed countries, whosevalues are not representative of develop<strong>in</strong>gcountries. Third, spatial resolution and greaterdisaggregation of f<strong>in</strong>al goods categorieswill become <strong>in</strong>creas<strong>in</strong>gly important for someend-users. And fourth, a common focus forfuture research is a more directed approachto quantify<strong>in</strong>g and communicat<strong>in</strong>g uncerta<strong>in</strong>tyand validation of results. These four researchfoci have the potential to concentrateresearch time and resources where they willmake the highest impact.26
<strong>Metal</strong> <strong>Stocks</strong> <strong>in</strong> <strong>Society</strong> – <strong>Scientific</strong> <strong>Synthesis</strong>8. ConclusionsThis report br<strong>in</strong>gs together the extant <strong>in</strong>formationon stocks of metals <strong>in</strong> society. Insome cases, a good deal of consistency isshown to exist. In other cases, it is clear thatthe stocks have yet to be well characterized.A review of potential users makes it clear that<strong>in</strong>-use stock <strong>in</strong>formation by itself has limitedutility. It is when this <strong>in</strong>formation is usedto generate scenarios of future use <strong>in</strong>tensity,discard, and reuse, with good spatial andtemporal resolution and f<strong>in</strong>al good disaggregation,that its value is manifest. Such dataand scenarios are now beg<strong>in</strong>n<strong>in</strong>g to appear.In provid<strong>in</strong>g perspective and relative magnitudes,the results here thus are of <strong>in</strong>herentuse as they stand, but they po<strong>in</strong>t as well to alarge challenge ahead – to do a better job ofevaluat<strong>in</strong>g stocks and their rates of growthand decay, and to use that <strong>in</strong>formation tomake <strong>in</strong>formed <strong>in</strong>ferences about the future.Only by so do<strong>in</strong>g can a fully adequate picturebe created of the rich “anthropogenic m<strong>in</strong>es”that have the potential to be tapped as sourcesof metal for the uses of modern society.27
<strong>Metal</strong> <strong>Stocks</strong> <strong>in</strong> <strong>Society</strong> – <strong>Scientific</strong> <strong>Synthesis</strong>ReferencesAdriaanse, A.; Br<strong>in</strong>gezu, S.; Hammond, A.;Moriguchi, Y.; Rodenburg, E.; Rogich, D.;Schütz, H., Resource Flows: The Material Basisof Industrial Economies, Wash<strong>in</strong>gton, DC:World Resources Institute, 1997.Brunner, P.H.; Rechberger, H., PracticalHandbook of Material Flow Analysis, BocaRaton, FL: Lewis Publishers, 2004.Dubreuil, S. Young, J. Atherton, and T.P. Gloria,<strong>Metal</strong>s recycl<strong>in</strong>g maps and allocationprocedures <strong>in</strong> life cycle assessment, In preparation,2009.Fraunhofer Institute for Systems and InnovationResearch, Raw Materials for Emerg<strong>in</strong>gTechnologies, Karlsruhe, 2009.Gerst, M.D.; Graedel, T.E., In-use stocksof metals: Status and implicaitions, EnvironmentalScience & Technology, 42,7038 – 7045, 2008.Gibson, C.C.; Ostrom, E., Ahn, T.K., The conceptof scale and the human dimensions ofglobal change: A survey, Ecological Economics,2000, 32, 217 – 239.Halada, K., M. Shimada, and K. Ijima: Forecast<strong>in</strong>gof the consumption of metals up to2050, Materials Transactions, 50, 453 – 460,2009.Hashimoto, S., H. Tanikawa, and Y. Moriguchi,Where will the large amounts of materialsaccumulated with<strong>in</strong> the economy go? A materialflow analysis of construction materials,Waste Management, 27, 1725 – 1738, 2007.Hedbrant, J., and L. Sörme, Data vaguenessand uncerta<strong>in</strong>ties <strong>in</strong> urban heavy metal datacollection, Water, Air, and Soil Pollution Focus,1, 43 – 53, 2001.Kapur, A., The Future of the Red <strong>Metal</strong>: ScenarioAnalysis and Implications for Policy,PhD Dissertation, Yale University, 2004.Mao, J.S., J. Dong, and T.E. Graedel, Themultilevel cycle of anthropogenic lead. II. Resultsand discussion, Resources, Conservation,and Recyl<strong>in</strong>g, 52, 1050 – 1057, 2008.Månsson, N., B. Bergbäck, and L. Sörme,Phas<strong>in</strong>g out cadmium, lead, and mercury: Effectson urban stocks and flows, Journal ofIndustrial Ecology, 13, 94 – 111, 2009.McKenzie, E., J. Money, P. Green, and T.Young, <strong>Metal</strong>s associated with stormwaterrelevantbrake and tire samples, Science ofthe Total Environment, 407, 5855 – 5860, 2009.Müller, D.B.; Wang, T.; Duval, B.; Graedel,T.E., Explor<strong>in</strong>g the eng<strong>in</strong>e of anthropogeniciron cycles, Proceed<strong>in</strong>gs of the NationalAcademy of Sciences, 2006, 103,16111 – 16116.Rostkowski, K., J. Rauch, K. Drakonakis, B.Reck, R.B. Gordon, and T.E. Graedel, “Bottom-up”study of <strong>in</strong>-use nickel stocks <strong>in</strong> NewHaven, CT, Resources, Conservation, and Recycl<strong>in</strong>g,50, 58 – 70, 2007.Ruhrberg, M., Assess<strong>in</strong>g the recycl<strong>in</strong>g efficiencyof copper from end-of-life products <strong>in</strong>Western Europe, Resources, Conservation,and Recycl<strong>in</strong>g, 2006, 48, 141 – 165.Shanghai <strong>Metal</strong> Corporation, Ch<strong>in</strong>a state reservemay boost copper stockpile by 74 %,http://www.shanghaimetal.com/news-detail/Ch<strong>in</strong>a_State_Reserve_May_Boost_Copper.htm, accessed Jan. 11, 2008.Sörme, L., and R. Lagerkvist, Soruces ofheavy metals <strong>in</strong> urban wastewater <strong>in</strong> Stockholm,Science of the Total Environment, 298,131 – 145, 2002.28
<strong>Metal</strong> <strong>Stocks</strong> <strong>in</strong> <strong>Society</strong> – <strong>Scientific</strong> <strong>Synthesis</strong>Terakado, R.; Takahashi, K.I.; Nakamura, J.;Daigo, I.; Matsuno, T.; Adachi, T., Calculationof <strong>in</strong>-use stock of copper with nocturnal lightimage by DMSP/OLS, Abstract 23, Conaccount,2008.United States Geological Survey, M<strong>in</strong>eralCommodity Summaries; Department of theInterior: Wash<strong>in</strong>gton, D.C., 2008.van Beers, D.; Graedel, T.E., Spatial characterizationof multi-level <strong>in</strong>-use copper andz<strong>in</strong>c stocks <strong>in</strong> Australia, Journal of CleanerProduction, 2007, 15, 849 – 861.Wang, T., Forg<strong>in</strong>g the Anthropogenic Iron Cycle,Ph.D. Dissertation, Yale University, 2009.Wang, T., D.B. Müller, and T.E. Graedel,Forg<strong>in</strong>g the anthropogenic iron cycle, EnvironmentalScience & Technology, 41,5120 – 5129, 2007.29
<strong>Metal</strong> <strong>Stocks</strong> <strong>in</strong> <strong>Society</strong> – <strong>Scientific</strong> <strong>Synthesis</strong>AppendicesThe Appendices for this paper consists of twotables. The first provides background <strong>in</strong>formationfor each metal <strong>in</strong> the study. The head<strong>in</strong>gsof these tables are def<strong>in</strong>ed as follows:<strong>Metal</strong>: <strong>Scientific</strong> abbreviation of element (exceptfor steel and sta<strong>in</strong>less steel, which aredenoted by ST and SS, respectively)Reservoir: A category which groups a collectionof related f<strong>in</strong>al goods <strong>in</strong> which a metalresides <strong>in</strong>-use.construction means that 25% of alum<strong>in</strong>um<strong>in</strong>flow will go <strong>in</strong>to build<strong>in</strong>g and construction.Estimated residence time: Amount of time (<strong>in</strong>years) that a metal will rema<strong>in</strong> <strong>in</strong> stock beforebe<strong>in</strong>g discarded. Values are taken fromthe literature. In the case where a value couldnot be obta<strong>in</strong>ed, a dash is used.The second table provides <strong>in</strong>formation oneach <strong>in</strong>-use stock estimate collected fromthe literature.Predom<strong>in</strong>ant f<strong>in</strong>al goods: Major f<strong>in</strong>al goodswith<strong>in</strong> a reservoir category.End-use fraction: As of 2006, the weight percentageof metal produced that is an <strong>in</strong>flowfor each reservoir. Percentages refer to specificmetal. For example, the 25% listed foralum<strong>in</strong>um that will be used for build<strong>in</strong>g and30
<strong>Metal</strong> <strong>Stocks</strong> <strong>in</strong> <strong>Society</strong> – <strong>Scientific</strong> <strong>Synthesis</strong>Appendix 1.<strong>Metal</strong> Reservoir Predom<strong>in</strong>ant<strong>Metal</strong>-conta<strong>in</strong><strong>in</strong>gF<strong>in</strong>al GoodsEnd-useFraction(percent)ReferenceEstimatedResidenceTime(years)ReferenceSpecification ofPr<strong>in</strong>icpal <strong>Metal</strong>Reservoirs.AlBuild<strong>in</strong>g &constructionSid<strong>in</strong>g, w<strong>in</strong>dowframesAl Infrastructure Cable used by powerutilities25 % (1) 30 – 50 (2, 3)18 % (1) 30 – 40 (2, 3)AlTransportationAutomotive equipment,railway equipment,aviation28 % (1) 15 – 40 (2, 3)Al Packag<strong>in</strong>g Beverage cans, foil 13 % (1) 0.3 – 0.8 (2, 3)Al Other 16 % (1) 10 – 15 (2, 3)SbBuild<strong>in</strong>g &constructionFlame retardants 55 % (4) —SbTransportationAutomotive equipment,railway equipment,ship build<strong>in</strong>g,aviation18 % (4) 10 – 30 (5)SbBuild<strong>in</strong>g &constructionFlame retardants 55 % (4) —SbTransportationAutomotive equipment,railway equipment,ship build<strong>in</strong>g,aviation18 % (4) 10 – 30 (5)Sb Chemicals 10 % (4) —SbBus<strong>in</strong>ess durablesCeramics and glass 7 % (4) —Sb Other 10 % (4) —CdConsumerand bus<strong>in</strong>essdurablesBatteries 81 % (4) 3 (6)Cd Pigments Bus<strong>in</strong>ess and consumerapplications10 % (4) —CdIndustrial durablesCoat<strong>in</strong>gs and plat<strong>in</strong>gs7 % (4) —Cd Other 2 % (4) —31
<strong>Metal</strong> <strong>Stocks</strong> <strong>in</strong> <strong>Society</strong> – <strong>Scientific</strong> <strong>Synthesis</strong><strong>Metal</strong> Reservoir Predom<strong>in</strong>ant<strong>Metal</strong>-conta<strong>in</strong><strong>in</strong>gF<strong>in</strong>al GoodsEnd-useFraction(percent)ReferenceEstimatedResidenceTime(years)ReferenceCrBuild<strong>in</strong>g & <strong>in</strong>frastructureElevators, railways 25 % (7) 30 – 50 (8)CrTransportationAutomotive exhaustsystems, railwayequipment, shipbuild<strong>in</strong>g, aviation15 % (7) 30 forplanes,tra<strong>in</strong>s,and ships5-15for automobilesandpartsCrHouseholdappliances &electronicsAppliances, householdproducts5 % (7) 15 (10)Cr<strong>Metal</strong> goods& other usesCutlery, fasteners 30 % (7) 5 – 15 (10)CrIndustrialmach<strong>in</strong>eryHeat exchangers,tanks25 % (7) 20 (8)CoTransportationAutomotive equipment,railway equipment,ship build<strong>in</strong>g,aviation43 % (4) 20 – 40 (8)Co Chemicals 26 % (4) —Co Cutt<strong>in</strong>g tools Blades, disks 22 % (4) 1 (11)CoIndustrial durablesIndustrial (<strong>in</strong>-plant)mach<strong>in</strong>ery andequipment22 % (4) 20 (8)CuBuild<strong>in</strong>g &constructionBuild<strong>in</strong>g wire andcopper tube50 % (12) 25 – 40 (5)Cu Infrastructure Copper cable used bytelecom utilities andpower utilities22 % (12) 50 (5)CuTransportationAutomotive equipment,railway equipment,ship build<strong>in</strong>g,aviation5 % (12) 10 – 30 (5)32
<strong>Metal</strong> <strong>Stocks</strong> <strong>in</strong> <strong>Society</strong> – <strong>Scientific</strong> <strong>Synthesis</strong><strong>Metal</strong> Reservoir Predom<strong>in</strong>ant<strong>Metal</strong>-conta<strong>in</strong><strong>in</strong>gF<strong>in</strong>al GoodsEnd-useFraction(percent)ReferenceEstimatedResidenceTime(years)ReferenceCuConsumerdurablesAppliances and extensioncords, consumerelectronics,fasteners and closures,householdproducts5 % (12) 10 (5)CuBus<strong>in</strong>ess durablesBus<strong>in</strong>ess electronics,light<strong>in</strong>g and wir<strong>in</strong>g10 % (12) 20 (5)CuIndustrial durablesIndustrial (<strong>in</strong>-plant)mach<strong>in</strong>ery andequipment8 % (12) 20 (5)Au Jewelry 85 % (4) 30 – 50Au Dental Inlays 9 % (4) —AuElectrical andelectronicsBus<strong>in</strong>ess electronics,consumer electronics6 % (4) —FeBuild<strong>in</strong>g &constructionBuild<strong>in</strong>g beams, re<strong>in</strong>forc<strong>in</strong>gbars50 % (8) 30 – 50 (8)FeTransportationAutomotive equipment,railway equipment,ship build<strong>in</strong>g,aviation20 % (8) 20 – 40 (8)FeMach<strong>in</strong>eryand appliancesAppliances, <strong>in</strong>dustrial(<strong>in</strong>-plant) mach<strong>in</strong>eryand equipment23 % (8) 20 (8)Fe Other 7 % (8) 25 (8)PbPbPbBuild<strong>in</strong>g &constructionMach<strong>in</strong>eryand appliancesMach<strong>in</strong>eryand appliancesLead sheet 54 % (6) 40 – 100 (6)SLI batteries 21 % (6) 1 – 4 (6)Stationary batteries 14 % (6) 8 – 12 (6)Pb Infrastructure Lead pipe 11 % (6) 20 – 50 (6)33
<strong>Metal</strong> <strong>Stocks</strong> <strong>in</strong> <strong>Society</strong> – <strong>Scientific</strong> <strong>Synthesis</strong><strong>Metal</strong> Reservoir Predom<strong>in</strong>ant<strong>Metal</strong>-conta<strong>in</strong><strong>in</strong>gF<strong>in</strong>al GoodsEnd-useFraction(percent)ReferenceEstimatedResidenceTime(years)ReferenceMg Cast<strong>in</strong>gs Transport systems,components59 % (4) —Mg Alloys Packag<strong>in</strong>g, transport 28 % (4) —MnMnBuild<strong>in</strong>g &constructionTransportationStructural steel 29 % (4) 30 – 40 (8)High-strength steel 12 % (4) 20 – 40 (8)MnIndustrial durablesIndustrial (<strong>in</strong>-plant)mach<strong>in</strong>ery andequipment12 % (4) 25 (8)HgChlor-alkaliproduction40 % (13) —HgManufacturedproductsDental amalgams,<strong>in</strong>struments, light<strong>in</strong>g32 % (13) —Hg Artisanal gold 3 % (13) —Mo Steel alloys Sta<strong>in</strong>less steel, superalloys80 % (14) —Mo Catalysts 8 % (14) —NiBuild<strong>in</strong>g &constructionAlloys 9 % (4) 30 – 50 (10)Ni Infrastructure 11 % (4) 30 – 50 (8)NiTransportationAutomotive equipment,railway equipment,ship build<strong>in</strong>g,aviation33 % (4) 10 – 30 (10)NiConsumerdurablesAppliances, consumerelectronics,household products13 % (4) 10 – 15 (10)NiIndustrial durablesIndustrial (<strong>in</strong>-plant)mach<strong>in</strong>ery andequipment25 % (4) 20 (10)PdTransportationAutomotive equipment57 % (15) 20 – 4034
<strong>Metal</strong> <strong>Stocks</strong> <strong>in</strong> <strong>Society</strong> – <strong>Scientific</strong> <strong>Synthesis</strong><strong>Metal</strong> Reservoir Predom<strong>in</strong>ant<strong>Metal</strong>-conta<strong>in</strong><strong>in</strong>gF<strong>in</strong>al GoodsEnd-useFraction(percent)ReferenceEstimatedResidenceTime(years)ReferencePdConsumerdurablesConsumer electronics,bus<strong>in</strong>ess electronics18 % (15) 5 – 10Pd Dental 14 % (15) —PtTransportationAutomotive equipment39 % (15) 20 – 40Pt Jewelry 37 % (15) 20PtChemical catalystsFuel cells 5 % (15) 25Pt Electronics Consumer and bus<strong>in</strong>essequipment6 % (15) 25RhTransportationAutomotive equipment86 % (15) 20 – 40RhGlass manufacture6 % (15) —RhAgAgChemical catalystsIndustrial applicationsFuel cells 6 % (15) —Electronics Solders Other 44 2029 % (16) 20 – 40Ag Photography Film, plates 22 % (16) 20 – 40AgSSSSSSCo<strong>in</strong>s andmedalsJewelry, tablewareTransportationIndustrialmach<strong>in</strong>eryBuild<strong>in</strong>g &construction5 % (16) 10 – 40Automotive, rail, ship 29 % (17) 10 – 30 (10)20 % (17) 20 (10)18 % (17) 30 – 50 (10)SS Electronics 7 % (17) 10 (10)SS Other 26 % (17) 15 (10)35
<strong>Metal</strong> <strong>Stocks</strong> <strong>in</strong> <strong>Society</strong> – <strong>Scientific</strong> <strong>Synthesis</strong><strong>Metal</strong> Reservoir Predom<strong>in</strong>ant<strong>Metal</strong>-conta<strong>in</strong><strong>in</strong>gF<strong>in</strong>al GoodsEnd-useFraction(percent)ReferenceEstimatedResidenceTime(years)ReferenceSnSnCans andconta<strong>in</strong>ersElectrical andelectronics27 % (4) —23 % (4) —Sn Construction Corrosion prevention 10 % (4) 30 – 50 (8)Sn Transport Corrosion prevention,solder10 % (4) 20 – 40 (5)TiCarbides,chemicals,metal andmetal alloys3 % (4) —W Cutt<strong>in</strong>g tools 50 % (11) 1 (11)W Light<strong>in</strong>g 22 % (11) —ZnBuild<strong>in</strong>g &constructionGalvanised steel(e.g., frames, pip<strong>in</strong>g),z<strong>in</strong>c alloys (e.g.,brass appliances),and pure z<strong>in</strong>c (e.g.,roof<strong>in</strong>g)48 % (18) 10 – 50 (5, 8)ZnTransportationMotor vehicles, vehicletires, and railwaytransport, sea andair transport36 % (18) 2-20 (5, 8)ZnBus<strong>in</strong>ess durablesMach<strong>in</strong>ery 7 % (18) —Zn Chemicals 5 % (18) —36
<strong>Metal</strong> <strong>Stocks</strong> <strong>in</strong> <strong>Society</strong> – <strong>Scientific</strong> <strong>Synthesis</strong>37
<strong>Metal</strong> <strong>Stocks</strong> <strong>in</strong> <strong>Society</strong> – <strong>Scientific</strong> <strong>Synthesis</strong>Appendix 2.Per capita<strong>in</strong>-use stockestimates.<strong>Metal</strong> Locale Year In-useStockPerCapitaMassUnitReferenceAl World 1947 2.2 kg (19)Al World 2002 79 kg (20)Al World 2003 82 kg (2)Al Europe 2004 199 kg (1)Al UK 1968 52 kg (21)Al Japan 2000 343 kg (22)Al USA 2000 483 kg (23)Al Ch<strong>in</strong>a 2005 37 kg (24)Al Connecticut, USA 2006 361 kg (25)Sb Japan 2000 1.0 kg (22)Cd World 1985 41 g (26)Cd Steiermark, Austria 2003 320 g (27)Cd Stockholm, Sweden 1995 79 g (28)Cr Japan 2000 54 kg (22)Cr Stockholm, Sweden 1995 8 kg (28)Cr New Haven, USA 2005 7.1 kg (29)Co Japan 2000 0.8 kg (22)Cu World 1929 17 kg (30)Cu World 1947 19 kg (19)Cu World 1960 25 kg (31)Cu World 1994 55 kg (32)Cu World 1998 35 kg (33)Cu World 2000 50 kg (34)Cu North America 1999 170 kg (5)Cu Western Europe 1999 190 kg (35)Cu USA 1932 73 kg (36)Cu USA 1948 139 kg (37)Cu USA 1957 161 kg (38)38
<strong>Metal</strong> <strong>Stocks</strong> <strong>in</strong> <strong>Society</strong> – <strong>Scientific</strong> <strong>Synthesis</strong><strong>Metal</strong> Locale Year In-useStockPerCapitaMassUnitReferenceCu USA 1960 164 kg (31)Cu USA 1961 166 kg (39)Cu USA 1979 216 kg (40)Cu USA 1990 270 kg (33)Cu USA 1990 294 kg (41)Cu Sweden 1998 140 kg (42)Cu USA 1998 253 kg (43)Cu USA 1999 238 kg (44)Cu Japan 2000 298 kg (22)Cu Switzerland 2000 220 kg (45)Cu USA 2000 391 kg (23)Cu Australia 2002 275 kg (46)Cu USA 2003 175 kg (47)Cu Australian territories 2002 245 - 295 kg (46)Cu Steiermark, Austria 2003 156 kg (27)Cu Connecticut, USA 2006 157 kg (48)Cu Stockholm, Sweden 1995 170 kg (28)Cu Stockholm, Sweden 1995 140 kg (49)Cu Cape Town, South Africa 2000 36 kg (50)Cu Sydney Metropolitan Area, Australia 2002 255 kg (46)Cu Sydney city center, Australia 2002 605 kg (46)Cu Beij<strong>in</strong>g city center, Ch<strong>in</strong>a 2004 30 kg (51)Cu New Haven, USA 2005 144 kg (52)Au Japan 2000 35 g (22)Au USA 2000 92 g (23)Fe World 1985 2.1 Mg (26)Fe USA 1950 15 Mg (53)Fe Japan 2000 11.3 Mg (22)39
<strong>Metal</strong> <strong>Stocks</strong> <strong>in</strong> <strong>Society</strong> – <strong>Scientific</strong> <strong>Synthesis</strong><strong>Metal</strong> Locale Year In-useStockPerCapitaMassUnitReferenceFe USA 2000 14.2 Mg (23)Fe Ch<strong>in</strong>a 2004 1.5 Mg (54)Fe USA 2004 11 - 12 Mg (8)Fe Steiermark, Austria 2003 10 Mg (27)Fe Urban Ch<strong>in</strong>a 2004 2.7 Mg (54)Fe Rural Ch<strong>in</strong>a 2004 0.64 Mg (54)Fe Connecticut, USA 2006 9.3 Mg (55)Fe Kitikyushu, Japan 1995 7.3 Mg (56)Fe Beij<strong>in</strong>g, Ch<strong>in</strong>a 2000 2.3 Mg (57)Fe New Haven, USA 2005 8.8 Mg (52)Pb World 1947 19 kg (19)Pb World 2000 8 kg (6)Pb Africa 2000 3.9 kg (6)Pb Asia 2000 3.7 kg (6)Pb Commonwealth of Independent States 2000 4 kg (6)Pb European Union 2000 41 kg (6)Pb USA 1948 7 kg (37)Pb USA 1957 14 kg (38)Pb USA 1961 15 kg (39)Pb Netherlands 1998 115 kg (58)Pb France 2000 31 kg (6)Pb India 2000 0.8 kg (6)Pb Italy 2000 32 kg (6)Pb Japan 2000 15 kg (6)Pb Japan 2000 25 kg (22)Pb United K<strong>in</strong>gdom 2000 78 kg (6)Pb USA 2000 40 kg (6)Pb USA 2000 146 kg (23)40
<strong>Metal</strong> <strong>Stocks</strong> <strong>in</strong> <strong>Society</strong> – <strong>Scientific</strong> <strong>Synthesis</strong><strong>Metal</strong> Locale Year In-useStockPerCapitaMassUnitReferencePb Stockholm, Sweden 1995 73 kg (28)Pb Vienna, Austria 1991 120 - 210 kg (59)Mg Japan 2000 5.2 kg (22)Mn Japan 2000 99 kg (22)Hg Stockholm, Sweden 1995 10 g (28)Mo Japan 2000 3.1 kg (22)Ni World 1947 0.2 kg (19)Ni Stockholm, Sweden 1995 4 kg (28)Ni New Haven, USA 2005 2 kg (60)Pd Japan 2000 4 g (22)Pd Germany 2001 1.3 g (61)Pt Japan 2000 3.2 g (22)Pt Germany 2001 1.5 g (61)Rh Germany 2001 0.15 g (61)Ag World 1991 110 g (62)Ag Japan 2000 13 g (22)SS Europe Union 15 2000 95 kg (10)SS Ch<strong>in</strong>a 2000 15 kg (10)SS Japan 2000 178 kg (10)SS Russia 2000 138 kg (10)SS USA 2000 80 kg (10)ST Japan 2000 7.1 Mg (63)Sn World 1947 0.4 kg (19)Sn Japan 2000 3.2 kg (22)Ti Japan 2000 13 kg (22)W USA 2000 0.8 kg (11)Zn World 1947 6 kg (19)Zn USA 1947 6.3 kg (37)41
<strong>Metal</strong> <strong>Stocks</strong> <strong>in</strong> <strong>Society</strong> – <strong>Scientific</strong> <strong>Synthesis</strong><strong>Metal</strong> Locale Year In-useStockPerCapitaMassUnitReferenceZn USA 1957 15 kg (38)Zn USA 1961 16 kg (39)Zn USA 1990 92 kg (64)Zn Japan 2000 76 kg (22)Zn USA 2000 210 kg (23)Zn Australia 2002 205 kg (46)Zn Australian territories 2002 190 -220 kg (46)Zn Steiermark, Austria 2003 89 kg (27)Zn Stockholm, Sweden 1990 40 kg (28)Zn Cape Town, South Africa 2002 18 kg (65)Zn Sydney Metropolitan Area, Australia 2002 190 kg (46)Zn Sydney city center, Australia 2002 420 kg (46)42
<strong>Metal</strong> <strong>Stocks</strong> <strong>in</strong> <strong>Society</strong> – <strong>Scientific</strong> <strong>Synthesis</strong>References ofAppendices1. European Alum<strong>in</strong>um Association, GlobalAlum<strong>in</strong>um Recycl<strong>in</strong>g: A Cornerstoneof Susta<strong>in</strong>able Development; Brussels,2006.2. Martchek, K., Personal communication,Alcoa Alum<strong>in</strong>um Company, 2006.3. Melo, M. T., Statistical analysis of metalscrap generation: the case of alum<strong>in</strong>ium<strong>in</strong> Germany. Resources, Conservation andRecycl<strong>in</strong>g 1999, 26, 91 – 113.4. United States Geological Survey, M<strong>in</strong>eralCommodity Summaries; Department ofthe Interior: Wash<strong>in</strong>gton, D.C., 2006.5. Spatari, S.; Bertram, M.; Gordon, R. B.;Henderson, K.; Graedel, T. E., Twentiethcentury copper stocks and flows <strong>in</strong> NorthAmerica: A dynamic analysis. EcologicalEconomics 2005, 54, 37 – 51.6. Mao, J. S.; Graedel, T. E., Lead <strong>in</strong>-usestocks: A dynamic analysis. Journal of IndustrialEcology 2009, 13, 112 – 126, 2009.7. Johnson, J.; Schewel, L.; Graedel, T. E.,The Contemporary Anthropogenic ChromiumCycle. Environmental Science &Technology 2006, 40, 7060 – 7069.8. Müller, D. B.; Wang, T.; Duval, B.;Graedel, T. E., Explor<strong>in</strong>g the eng<strong>in</strong>e ofanthropogenic iron cycles. Proceed<strong>in</strong>gs ofthe National Academy of Sciences 2006,103, 16111.9. Papp, J., Personal communication, UnitedStates Geological Survey, 2006.10. Teroerde, F., Personal communication,ELG <strong>Metal</strong>s, Duisburg, Germany, 2006.11. Harper, E. M., Illum<strong>in</strong>at<strong>in</strong>g tungsten’s lifecycle <strong>in</strong> the United States, 1975 – 2000,Environmental Science & Technology, 42,3835 – 3842, 2008.12. Joseph, G.; Kundig, K. J. A.; InternationalCopper Association., Copper: its trade,manufacture, use, and environmentalstatus. ASM International: MaterialsPark, Ohio, 1999; p vii, 451 p.13. Sznopek, J. L.; Goonan, T. G., The MaterialsFlow of Mercury <strong>in</strong> the Economies ofthe United States and the World; InformationCircular 1197; United States GeologicalSurvey: Wash<strong>in</strong>gton, D.C., 2000.14. International Molybdenum Association,http://www.imoa.<strong>in</strong>fo. (December 27,2008)15. National Institute for Materials Science,Worldwide Supply and Demand of Plat<strong>in</strong>umGroup <strong>Metal</strong>s and Trends <strong>in</strong> Recycl<strong>in</strong>gof Autocatalyst <strong>in</strong> Japan; Tsukuba,Japan, 2004.16. Silver Institute, World Silver Survey; London,2005.17. Kaumanns, P., Personal communication,International Sta<strong>in</strong>less Steel Forum,Brussels, 2006.18. Gordon, R. B.; Graedel, T. E.; Bertram,M.; Fuse, K.; Lifset, R.; Rechberger, H.;Spatari, S., The characterization of technologicalz<strong>in</strong>c cycles. Resources, Conservationand Recycl<strong>in</strong>g 2003, 39, 107 – 135.19. Miller, H. J. In The supply and <strong>in</strong>dustrialapplications of scrap metals, Proceed<strong>in</strong>gsof the United Nations <strong>Scientific</strong> Conferenceon the Conservation and Utilizationof Resources, Lake Success, New York,1949; United Nations Department of EconomicAffairs: Lake Success, New York,1949.43
<strong>Metal</strong> <strong>Stocks</strong> <strong>in</strong> <strong>Society</strong> – <strong>Scientific</strong> <strong>Synthesis</strong>20. European Alum<strong>in</strong>ium Association, Alum<strong>in</strong>iumRecycl<strong>in</strong>g: The Road to HighQuality Products; Brussels, 2004.21. Chapman, P. F.; Roberts, F., <strong>Metal</strong> Resourcesand Energy. Butterworths: London,1983; p 238.22. Murakami, S. In Material flows andstocks of metals surround<strong>in</strong>g Japan,Symposium on Advanced Material FlowAnalysis for the Susta<strong>in</strong>able <strong>Society</strong>,Sendai, Japan, 2006; Sendai, Japan, 2006;pp 187 – 190.23. Sullivan, D. E., Indicators of <strong>Stocks</strong>-<strong>in</strong>use<strong>in</strong> the United States for Alum<strong>in</strong>um,Copper, Gold, Iron, Steel, Lead, and Z<strong>in</strong>c.Unpublished report; United States GeologicalSurvey: Wash<strong>in</strong>gton, D.C., 2003.24. Wang, J.; Graedel, T. E., Prelim<strong>in</strong>ary Assessmentof In-Use Alum<strong>in</strong>um <strong>Stocks</strong> <strong>in</strong>Ch<strong>in</strong>a. Unpublished report; Yale Centerfor Industrial Ecology: New Haven, 2007.25. Recalde, K.; Wang, J.; Graedel, T.E.,Alum<strong>in</strong>um <strong>Stocks</strong> <strong>in</strong> the State of Connecticut.Resources, Conservation, andRecycl<strong>in</strong>g, 52, 1271 – 1282, 2008.26. Bacc<strong>in</strong>i, P.; Brunner, P. H., Metabolismof the Anthroposphere. Spr<strong>in</strong>ger-Verlag:Berl<strong>in</strong>, 1991; p 157.27. Schöller, G.; Oberleitner, C.; Fehr<strong>in</strong>ger,R.; Döberl, G.; Brunner, P. H., VerknüpfungRohstofflager – anthropogene Lager– letzte Senken im Bundesland Steiermark;Vienna University of Technology:Vienna, 2006.28. Sörme, L.; Bergbäck, B.; Lohm, U., Centuryperspective of heavy metal use <strong>in</strong>urban areas. A case study <strong>in</strong> Stockholm.Water, Air, & Soil Pollution: Focus 2001,1, 197 – 211.29. Kwo, F., In-use <strong>Stocks</strong> of Chromium <strong>in</strong>New Haven, Connecticut. Unpublishedreport; Yale Center for Industrial Ecology:New Haven, 2006.30. Ba<strong>in</strong>, H. F., The rise of scrap metals. InM<strong>in</strong>eral economics; lectures under theauspices of the Brook<strong>in</strong>gs <strong>in</strong>stitution,1st ed.; Tryon, F. G.; Eckel, E. C., Eds.McGraw-Hill: New York, 1932; p 331.31. McMahon, A. D., Copper: A MaterialsSurvey; United States Bureau of M<strong>in</strong>es:Wash<strong>in</strong>gton, D.C., 1965; p 340.32. Kapur, A. The Future of the Red <strong>Metal</strong>:Scenario Analysis and Implications forPolicy. Ph.D. Dissertation, Yale, New Haven,2004.33. Jolly, J. L. W., The US copper-base scrap<strong>in</strong>dustry and its byproducts: An overview;United States Geological Survey: Wash<strong>in</strong>gton,D.C., 1999.34. Lichtensteiger, T., The Petrologic Evaluation.Spr<strong>in</strong>ger-Verlag: Berl<strong>in</strong>, 2002.35. Ruhrberg, M., Assess<strong>in</strong>g the recycl<strong>in</strong>gefficiency of copper from end-of-lifeproducts <strong>in</strong> Western Europe. Resources,Conservation & Recycl<strong>in</strong>g 2006, 48,141 – 165.36. Ingalls, W. R. In The economics of oldmetals especially copper, lead, z<strong>in</strong>c, andt<strong>in</strong>, M<strong>in</strong><strong>in</strong>g and <strong>Metal</strong>lurgical <strong>Society</strong> ofAmerica, Columbia University Club, NewYork, 1935; Columbia University Club,New York, 1935; pp 75 – 95.37. Merrill, C. W. In The accumulation andconservation of metals-<strong>in</strong>-use, Proceed<strong>in</strong>gsof the United Nations <strong>Scientific</strong>Conference on the Conservation andUtilization of Resources, Lake Success,New York, 1949; United Nations Departmentof Economic Affairs: Lake Success,New York, 1949.44
<strong>Metal</strong> <strong>Stocks</strong> <strong>in</strong> <strong>Society</strong> – <strong>Scientific</strong> <strong>Synthesis</strong>38. Merrill, C. W., The significance of them<strong>in</strong>eral <strong>in</strong>dustries <strong>in</strong> the economy. InEconomics of the m<strong>in</strong>eral <strong>in</strong>dustries; aseries of articles by specialists, 1st ed.;Robie, E. H., Ed. American Institute ofM<strong>in</strong><strong>in</strong>g, <strong>Metal</strong>lurgical, and PetroleumEng<strong>in</strong>eers: New York, 1959; p 755.39. Merrill, C. W., The significance of them<strong>in</strong>eral <strong>in</strong>dustries <strong>in</strong> the economy. InEconomics of the m<strong>in</strong>eral <strong>in</strong>dustries; aseries of articles by specialists, 2d ed.;Robie, E. H., Ed. American Institute ofM<strong>in</strong><strong>in</strong>g, <strong>Metal</strong>lurgical, and PetroleumEng<strong>in</strong>eers: New York, 1964; p 787.40. Sousa, L. J., The U.S. Copper Industry:Problems, Issues, and Outlook. UnitedStates Department of the Interior: Wash<strong>in</strong>gton,D.C., 1981; p 86.41. Zeltner, C.; Bader, H. P.; Scheidegger, R.;Bacc<strong>in</strong>i, P., Susta<strong>in</strong>able metal managementexemplified by copper <strong>in</strong> the USA.Regional Environmental Change 1999, 1,31-46.42. Landner, L.; L<strong>in</strong>deström, L., Copper <strong>in</strong><strong>Society</strong> and <strong>in</strong> the Environment: An Accountof the Facts on Fluxes, Amountsand Effects of Copper <strong>in</strong> Sweden. SwedishEnvironmental Research Group:Vasteras, Sweden, 1999.43. Ayres, R. U.; Ayres, L.; Rade, I., The LifeCycle of Copper, Its Co-Products and Byproducts.Kluwer Academic Publishers:2003.44. Gordon, R. B.; Bertram, M.; Graedel, T. E.,<strong>Metal</strong> stocks and susta<strong>in</strong>ability. Proceed<strong>in</strong>gsof the National Academy of Sciences2006, 103, 1209 – 1214.45. Wittmer, D.; Lichtensteiger, T.; Bacc<strong>in</strong>i,P. In Copper exploration for urban m<strong>in</strong><strong>in</strong>g,Copper/Cobre 2003, Santiago, Chile,2003; Santiago, Chile, 2003; pp 85 – 101.46. van Beers, D.; Graedel, T. E., Spatialcharacterisation of multi-level <strong>in</strong>-usecopper and z<strong>in</strong>c stocks <strong>in</strong> Australia.Journal of Cleaner Production 2007, 15,849 – 861.47. Nathan Associates, The Obsolete CopperScrap Inventory: Accumulation and Availability,1982 – 2003; United States Departmentof Commerce: Wash<strong>in</strong>gton, D.C.,2004; p 18.48. Rauch, J.; Eckelman, M.; Gordon, R. B.,Copper In-use Stock and Copper Scrap<strong>in</strong> the State of Connecticut, USA. Work<strong>in</strong>gPaper Number 10, School of Forestry andEnvironmental Studies; Yale University:New Haven, 2007; p 79.49. Bergbäck, B.; Johansson, K.; Mohlander,U., Urban metal flows – A case study ofStockholm. Review and conclusions.Water, Air, & Soil Pollution: Focus 2001,1, 3 – 24.50. van Beers, D.; Graedel, T. E., The magnitudeand spatial distribution of <strong>in</strong>-usecopper stocks <strong>in</strong> Cape Town, South Africa.South African Journal of Science2003, 99, 61 – 69.51. Zhang, Z., Spatial analysis of <strong>in</strong>-usecopper stocks <strong>in</strong> Beij<strong>in</strong>g, Ch<strong>in</strong>a. In Citiesas Opportunities, Bai, X.; Graedel, T. E.;Morishima, A., Eds. Cambridge UniversityPress: Cambridge, U.K., 2008.52. Drakonakis, K.; Rostkowski, K.; Rauch,J.; Graedel, T. E.; Gordon, R. B., <strong>Metal</strong>capital susta<strong>in</strong><strong>in</strong>g a North American city:Iron and copper <strong>in</strong> New Haven, CT. Resources,Conservation & Recycl<strong>in</strong>g 2007,49, 406 – 420.53. Brown, H., The Challenge of Man’s Future;An Inquiry Concern<strong>in</strong>g the Conditionof Man Dur<strong>in</strong>g the Years that Lie Ahead.Vik<strong>in</strong>g Press: New York, 1954; p 290.45
<strong>Metal</strong> <strong>Stocks</strong> <strong>in</strong> <strong>Society</strong> – <strong>Scientific</strong> <strong>Synthesis</strong>54. Wang, T. Forg<strong>in</strong>g the Anthropogenic IronCycle. Ph.D. Dissertation, Yale University,New Haven, 2009.55. Eckelman, M.; Rauch, J.; Gordon, R.B., In-Use <strong>Stocks</strong> of Iron <strong>in</strong> the Stateof Connecticut, USA. Work<strong>in</strong>g PaperNumber 11, School of Forestry and EnvironmentalStudies; Yale University: NewHaven, 2007; p 52.56. Tanikawa, H.; Hashimoto, S.; Moriguchi,Y. In Estimation of Material Stock <strong>in</strong>Urban Civil Infrastructures and Build<strong>in</strong>gsfor the Prediction of Waste Generation,Proceed<strong>in</strong>gs of the 5th InternationalConference on Ecobalance, Tokyo, 2002;<strong>Society</strong> for Non-Traditional Technology:Tokyo, 2002; pp 809 – 806.63. Daigo, I.; Igarashi, Y.; Matsuno, Y.; Adachi,Y., Account<strong>in</strong>g for steel stock <strong>in</strong> Japan.Iron and Steel Institute of Japan International2007, 47, 1065 – 1069.64. Jolly, J. H., Materials flow of z<strong>in</strong>c <strong>in</strong> theUnited States 1850 – 1990. Resources,Conservation and Recycl<strong>in</strong>g 1993, 9,1 – 30.65. van Beers, D.; Graedel, T. E., The Magnitudeand Spatial Distribution of In-useZ<strong>in</strong>c <strong>Stocks</strong> <strong>in</strong> Cape Town, South Africa.African Journal of Environmental Assessmentand Management 2004, 9, 18 – 36.Group<strong>in</strong>gs of <strong>Metal</strong>s57. Wang, T., Personal communication, YaleUniversity, New Haven, 2004.58. Elshkaki, A.; Van der Voet, E.; Van Holderbeke,M.; Timmermans, V., The environmentaland economic consequencesof the developments of lead stocks <strong>in</strong> theDutch economic system. Resources, Conservation& Recycl<strong>in</strong>g 2004, 42, 133 – 154.59. Obernosterer, R.; Brunner, P. H., Urban<strong>Metal</strong> Management The Example of Lead.Water, Air, & Soil Pollution: Focus 2001,1, 241 – 253.60. Rostkowski, K.; Rauch, J.; Drakonakis, K.;Reck, B.; Gordon, R. B.; Graedel, T. E.,“Bottom–up” study of <strong>in</strong>-use nickelstocks <strong>in</strong> New Haven, CT. Resources,Conservation & Recycl<strong>in</strong>g 2007, 50,58 – 70.61. Hagelüken, C., Materials Flow of Plat<strong>in</strong>umGroup <strong>Metal</strong>s. GFMS Limited: London,2005; p 300.62. Charles River Associates, Silver <strong>Stocks</strong>around the World; Cambridge, MA, 1992.46
<strong>Metal</strong> <strong>Stocks</strong> <strong>in</strong> <strong>Society</strong> – <strong>Scientific</strong> <strong>Synthesis</strong>47
<strong>Metal</strong> <strong>Stocks</strong> <strong>in</strong> <strong>Society</strong> – <strong>Scientific</strong> <strong>Synthesis</strong>International Panelfor Susta<strong>in</strong>ableResourceManagementGlobal <strong>Metal</strong> FlowsWork<strong>in</strong>g GroupAs our economies have grown, so has the useof materials and resources. In an <strong>in</strong>creas<strong>in</strong>glyglobalised economy, the challenge forpolicy-makers is to streaml<strong>in</strong>e actions forensur<strong>in</strong>g a more susta<strong>in</strong>able management ofresources, both renewable and non-renewable.There are exist<strong>in</strong>g measures such aspolicies on climate change and biodiversitythat tackle certa<strong>in</strong> aspects of the globalresource issues. However a holistic approachto resources management is needed to betteridentify their <strong>in</strong>terl<strong>in</strong>kages and gaps <strong>in</strong> a systemicway.The establishment of <strong>UNEP</strong>’s InternationalPanel for Susta<strong>in</strong>able Resource Management,or Resource Panel for short, is afirst step towards address<strong>in</strong>g this need. TheResource Panel was officially launched <strong>in</strong>November 2007 and aims to provide the scientificimpetus for decoupl<strong>in</strong>g economicgrowth and resource use from environmentaldegradation.The objectives of the Resource Panel are toprovide <strong>in</strong>dependent, coherent and authoritativescientific assessments of policy relevanceon the susta<strong>in</strong>able use of natural resourcesand <strong>in</strong> particular their environmental impactsover the full life cycle as well as to contributeto a better understand<strong>in</strong>g of how to decoupleeconomic growth from environmentaldegradation.Economic development is deeply coupledwith the use of metals. The grow<strong>in</strong>g demandfor metals implies a permanent pressureon the resource base. <strong>Metal</strong>s are resourcesthat have a high value and <strong>in</strong> pr<strong>in</strong>ciple can beeasily reused and recycled. Reuse and recycl<strong>in</strong>gactivities of metals on a global scale cancontribute to clos<strong>in</strong>g the loops, turn waste<strong>in</strong>to resources, and are expected to therebyreduce environmental impacts, safeguard theavailability of metals, m<strong>in</strong>imize metal prices,and promote mean<strong>in</strong>gful and safe jobs forpoor people <strong>in</strong> develop<strong>in</strong>g countries.The Global <strong>Metal</strong> Flows Work<strong>in</strong>g Group aimsat contribut<strong>in</strong>g to the promotion of reuse andrecycl<strong>in</strong>g of metals and the establishment ofan <strong>in</strong>ternational sound material-cycle societyby provid<strong>in</strong>g scientific and authoritativeassessment studies on the global flows ofmetals. Expected results <strong>in</strong>clude reveal<strong>in</strong>gpotentials for <strong>in</strong>creas<strong>in</strong>g the resourceefficiency of metal flows at the national and<strong>in</strong>ternational level.This work builds on and will contributeto other related <strong>in</strong>ternational <strong>in</strong>itiatives,<strong>in</strong>clud<strong>in</strong>g the development of the 10-yearframework on susta<strong>in</strong>able consumptionand production (Marrakech Process), theGreen Economy Initiative and the GlobalEnvironment.48
About the <strong>UNEP</strong> Division of Technology,Industry and EconomicsThe <strong>UNEP</strong> Division of Technology, Industry and Economics (DTIE) helpsgovernments, local authorities and decision-makers <strong>in</strong> bus<strong>in</strong>ess and<strong>in</strong>dustry to develop and implement policies and practices focus<strong>in</strong>g onsusta<strong>in</strong>able development.The Division works to promote:> susta<strong>in</strong>able consumption and production,> the effi cient use of renewable energy,> adequate management of chemicals,> the <strong>in</strong>tegration of environmental costs <strong>in</strong> development policies.The Office of the Director, located <strong>in</strong> Paris, coord<strong>in</strong>ates activitiesthrough:> The International Environmental Technology Centre - IETC (Osaka, Shiga),which implements <strong>in</strong>tegrated waste, water and disaster management programmes,focus<strong>in</strong>g <strong>in</strong> particular on Asia.> Susta<strong>in</strong>able Consumption and Production (Paris), which promotes susta<strong>in</strong>ableconsumption and production patterns as a contribution to human developmentthrough global markets.> Chemicals (Geneva), which catalyzes global actions to br<strong>in</strong>g about the soundmanagement of chemicals and the improvement of chemical safety worldwide.> Energy (Paris and Nairobi), which fosters energy and transport policies forsusta<strong>in</strong>able development and encourages <strong>in</strong>vestment <strong>in</strong> renewable energy andenergy effi ciency.> OzonAction (Paris), which supports the phase-out of ozone deplet<strong>in</strong>g substances<strong>in</strong> develop<strong>in</strong>g countries and countries with economies <strong>in</strong> transition to ensureimplementation of the Montreal Protocol.> Economics and Trade (Geneva), which helps countries to <strong>in</strong>tegrate environmentalconsiderations <strong>in</strong>to economic and trade policies, and works with the fi nance sectorto <strong>in</strong>corporate susta<strong>in</strong>able development policies.<strong>UNEP</strong> DTIE activities focus on rais<strong>in</strong>g awareness,improv<strong>in</strong>g the transfer of knowledge and <strong>in</strong>formation,foster<strong>in</strong>g technological cooperation and partnerships, andimplement<strong>in</strong>g <strong>in</strong>ternational conventions and agreements.For more <strong>in</strong>formation,see www.unep.fr
A key question that relates to thevery broad and <strong>in</strong>tensive use ofmetals is whether society needsto be concerned about long-termsupplies of any or many of them.This is a many-faceted questionthat cannot be answered quicklyor unequivocally. To address it, theResource Panel’s Work<strong>in</strong>g Groupon Global <strong>Metal</strong> Flows envisions aseries of six reports, of which thisis the first one address<strong>in</strong>g metalstocks <strong>in</strong> society.The cont<strong>in</strong>ued <strong>in</strong>crease <strong>in</strong> the useof metals over the twentieth centuryhas led to a substantial shiftfrom geological resource baseto metal stocks <strong>in</strong> society. Thisreport reviews the relevant literatureon this topic. From a compilationof 54 studies, it is clear thata reasonably detailed picture of<strong>in</strong>-use stocks and <strong>in</strong>-use lifetimesexists for only five metals: alum<strong>in</strong>ium,copper, iron, lead, andz<strong>in</strong>c. Limited data suggest thatper capita <strong>in</strong>-use stocks <strong>in</strong> moredevelopedcountries typicallyexceed those <strong>in</strong> less-developedcountries by factors of five to ten.For more <strong>in</strong>formation, contact:Resource Panel Secretariat<strong>UNEP</strong> DTIESusta<strong>in</strong>able Consumptionand Production Branch15 rue de Milan75441 Paris CEDEX 09FranceTel: +33 1 44 37 14 50Fax: +33 1 44 37 14 74E-mail: resourcepanel@unep.orgwww.unep.fr/scp/rpanelReliable data on metals stocks<strong>in</strong> society and their lifetimes areessential for build<strong>in</strong>g a globalrecycl<strong>in</strong>g <strong>in</strong>frastructure <strong>in</strong> thefuture.Published <strong>in</strong> May 2010ISBN: 978-92-807-3082-1DTI/1264/PA