Road Pavement Design Manual - 1999 - LGED
Road Pavement Design Manual - 1999 - LGED
Road Pavement Design Manual - 1999 - LGED

Create successful ePaper yourself
Turn your PDF publications into a flip-book with our unique Google optimized e-Paper software.
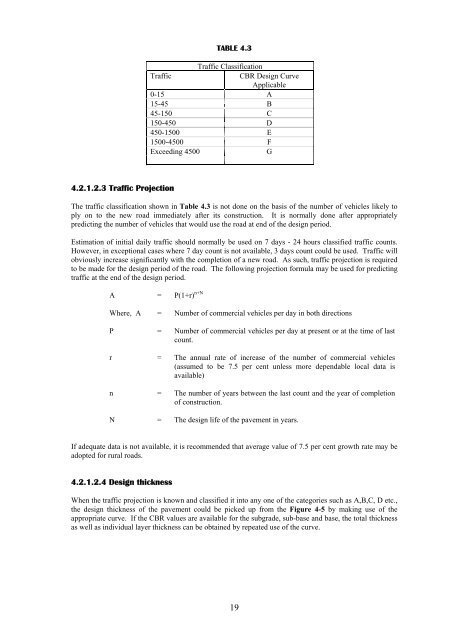
TABLE 4.3Traffic ClassificationTrafficCBR <strong>Design</strong> CurveApplicable0-15 A15-45 B45-150 C150-450 D450-1500 E1500-4500 FExceeding 4500G4.2.1.2.3 Traffic ProjectionThe traffic classification shown in Table 4.3 is not done on the basis of the number of vehicles likely toply on to the new road immediately after its construction. It is normally done after appropriatelypredicting the number of vehicles that would use the road at end of the design period.Estimation of initial daily traffic should normally be used on 7 days - 24 hours classified traffic counts.However, in exceptional cases where 7 day count is not available, 3 days count could be used. Traffic willobviously increase significantly with the completion of a new road. As such, traffic projection is requiredto be made for the design period of the road. The following projection formula may be used for predictingtraffic at the end of the design period.A = P(1+r) n+NWhere, A = Number of commercial vehicles per day in both directionsP = Number of commercial vehicles per day at present or at the time of lastcount.r = The annual rate of increase of the number of commercial vehicles(assumed to be 7.5 per cent unless more dependable local data isavailable)n = The number of years between the last count and the year of completionof construction.N = The design life of the pavement in years.If adequate data is not available, it is recommended that average value of 7.5 per cent growth rate may beadopted for rural roads.4.2.1.2.4 <strong>Design</strong> thicknessWhen the traffic projection is known and classified it into any one of the categories such as A,B,C, D etc.,the design thickness of the pavement could be picked up from the Figure 4-5 by making use of theappropriate curve. If the CBR values are available for the subgrade, sub-base and base, the total thicknessas well as individual layer thickness can be obtained by repeated use of the curve.19