Henrik Schulz* and Anita Horn, Archäomertrie-Labor der HAWK ...
Henrik Schulz* and Anita Horn, Archäomertrie-Labor der HAWK ...
Henrik Schulz* and Anita Horn, Archäomertrie-Labor der HAWK ...

You also want an ePaper? Increase the reach of your titles
YUMPU automatically turns print PDFs into web optimized ePapers that Google loves.
Manuscript, H. Schulz <strong>and</strong> A. <strong>Horn</strong>, Hildesheim, henrik.schulz@archaeometrielabor.com 1<br />
Characterization of Wooden Surfaces treated by dielectric barrier Discharges at atmospheric<br />
Pressure. The Estimation of activated surface groups by contact angle measurements <strong>and</strong><br />
UV/VIS-Spectrometry<br />
<strong>Henrik</strong> <strong>Schulz*</strong> <strong>and</strong> <strong>Anita</strong> <strong>Horn</strong>, <strong>Archäomertrie</strong>-<strong>Labor</strong> <strong>der</strong> <strong>HAWK</strong> Hildesheim<br />
Kaiserstr. 19, D-31134 Hildesheim, Germany<br />
Abstract<br />
A simple model of determining the change of the surface groups onto beech <strong>and</strong> spruce wood after a<br />
treatment by dielectric barrier discharge at atmospheric pressure has been developed, based on the<br />
measurement of the contact angle of aqueous test liquids un<strong>der</strong> n-hexane as the outer fluid. The<br />
relationship between the cosines of the contact angles of the untreated <strong>and</strong> plasma treated wooden<br />
surfaces is linear but strongly sensitive to the interaction parameter φ of the adsorption. The slope of<br />
this simple linear relation is unit <strong>and</strong> the interception is equal to the change in the spreading pressure<br />
∆π. The interceptions provide the values of ∆π between 1 to 7 mNm -1 for spruce wood <strong>and</strong> 8 to 14<br />
mNm -1 for beech wood. These results were combined with the displacement of the absorption<br />
maximum of the staining of the plasma treated wooden surface with toluidine blue as metachromatic<br />
dye. Hereby it is possible to estimate the change in the surface concentration ∆N of the activated<br />
functional groups onto the wooden surface after the plasma treatment. The predicted values of ∆N are<br />
7.1 10 12 to 5.0 10 13 cm -2 for spruce wood <strong>and</strong> 1.3 to 2.3 10 14 cm -2 for beech wood. The magnitude of<br />
these values are suitable <strong>and</strong> comparable with those known from inorganic isolators like silicon<br />
dioxide <strong>and</strong> aluminium oxide.<br />
Keywords: wooden surface, dielectric barrier discharge, spreading pressure, surface concentration,<br />
staining, plasma<br />
INTRODUCTION<br />
Long before we have called it a sustainable growing material, wood was one of the oldest<br />
stuff <strong>and</strong> trading material that human societies worked with. Nowadays wood gets an<br />
increasing importance as traditional engineering material [1-4].<br />
A major problem in wood technology is the long term stability <strong>and</strong> reliability of any kind of<br />
bonds <strong>and</strong> their adhesiveness. Wood is obviously such an extreme complex material. Also the<br />
wooden surface is different <strong>and</strong> depends upon the origin of the tree, its density <strong>and</strong> water<br />
content, the extent of seasoning, the direction of the cut, <strong>and</strong> many other factors [5]. Therefore<br />
it is valuable to pay more attention to the structure, grain <strong>and</strong> seasoning of wood.<br />
* correspondence should addressed to:<br />
e-mail: henrik.schulz@archaeometrielabor.com or fax: (+49)-(5121)-881-371
Manuscript, H. Schulz <strong>and</strong> A. <strong>Horn</strong>, Hildesheim, henrik.schulz@archaeometrielabor.com 2<br />
Additionally to the three main wood components cellulose, lignin <strong>and</strong> hemi cellulose wood<br />
contains small amounts of extractives that are characteristic for each special wooden<br />
specimen. But these minor constituents have great influence onto the properties of the<br />
industrial made wooden products. Reasons enough to find a technique that equalize the<br />
wooden surface <strong>and</strong> create good conditions for coating <strong>and</strong> adhesion in general. We have<br />
chosen a treatment by dielectric barrier discharge (DBD) un<strong>der</strong> normal atmosphere, i.e. in the<br />
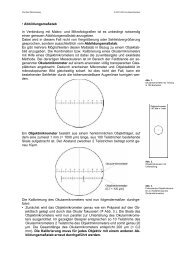
presence of air. Figure 1 illustrates the principle of the DBD technique.<br />
“cool” plasma<br />
!<br />
!<br />
!<br />
High voltage<br />
1a<br />
1b<br />
2a<br />
2b<br />
Figure 1 Scheme of the low electric current plasma chamber <strong>and</strong> the DBD technique<br />
(Dielectric Barrier Discharge, [6,7]), 1a <strong>and</strong> 1b: electrodes, 2a <strong>and</strong> 2b:<br />
dielectrics, 3: wooden surface<br />
The DBD technique used a radio frequency inductor to produce an electrostatic field un<strong>der</strong> a<br />
high voltage potential between the electrodes. In addition the electrostatic field is attenuated<br />
by the dielectric material that surrounded the electrodes, e.g. boron nitride that barrier the<br />
counter electrode. This barrier discharge of short pulse durations <strong>and</strong> repetitions results in<br />
only low energetic impacts by discharging onto the surface of the material between the two<br />
electrodes. This is important because chemical reactions at the wooden surface are strongly<br />
diminished <strong>and</strong> practically negligible.<br />
It is known that water <strong>and</strong> other hydrophilic liquids spread more effectively on the wooden<br />
surface after the electric discharge procedure than before. But there is also known that these<br />
increase in spreading is not a long-term effect. It is diminished few days after the treatment<br />
<strong>and</strong> has disappeared total at the end. The explanation of the higher hydrophilic activity of the<br />
wooden surface immediately after treatment with plasma seems to be clear because of a<br />
higher surface free energy, but what is the meaning of the time relaxation <strong>and</strong> the delay<br />
3
Manuscript, H. Schulz <strong>and</strong> A. <strong>Horn</strong>, Hildesheim, henrik.schulz@archaeometrielabor.com 3<br />
process of the activated surface energy? At first we will consi<strong>der</strong> the situation of a real<br />
wooden surface un<strong>der</strong> normal atmosphere of moist air. A certain number of water molecules<br />
from the gaseous phase will be adsorbed at the surface <strong>and</strong> be stabilized by mediation of the<br />
hydrogen bonding via the ubiquitous hydroxy groups of the cellulose but as well of the lignin<br />
<strong>and</strong> other resinous compounds. The situation of the adsorption layer at the wooden surface<br />
will be changed vigorously by the impacts of the electrical charged particles of the plasma.<br />
One of the main topics is questioned about the number of adsorbed molecules at the<br />
interfacial region <strong>and</strong> the change of that quantity after the plasma treatment. A change in<br />
adsorption is always accompanied by a change of energy, in particular the change of the<br />
surface free energy ∆G or in relation to the change of a specific area ∆A the interfacial tension<br />
γ:<br />
∆G<br />
γ =<br />
∆A<br />
(1)<br />
An easy way to study such changes at the surface of solids by experiments is the so-called<br />
wetting procedure. The wetting of a surface by a liquid <strong>and</strong> their final extent of spreading is<br />
very simple but covers a lot of information about the real surface. Figure 2 exhibits the<br />
classical three-phase situation of two immiscible fluids 1 <strong>and</strong> 2 in contact with a plane surface<br />
of the solid S. Furthermore the fluid 1 is called the “inner fluid” <strong>and</strong> fluid 2 the “outer fluid”.<br />
Figure 2 The force equilibrium at the point of the coexistence of the three phases to<br />
<strong>der</strong>ive the classical YOUNG´s equation (2) [8]<br />
In the classical way the three depicted arrows symbolise the three forces related to γ12, γS1 <strong>and</strong><br />
γS2. All three forces start at the triple point, i.e. where all of the phases co-exist simultaneously<br />
in equilibrium. The directions of γS1 <strong>and</strong> γS2 are opposite but parallel to the surface of the<br />
solid. γ12 <strong>and</strong> γS1 encircle the so-called contact angle Θ. If we consi<strong>der</strong> the force balance the<br />
YOUNG´s equation (2) straight follows as:<br />
γ12⋅cos Θ + γS1 = γS2 (2)
Manuscript, H. Schulz <strong>and</strong> A. <strong>Horn</strong>, Hildesheim, henrik.schulz@archaeometrielabor.com 4<br />
Finally we take into account pre-adsorbed molecules onto the surface of the solid S which are<br />
belonging to the outer fluid 2 (index: “S2”). Additionally to that pre-adsorption also coadsorption<br />
of other molecules out of the inner fluid 1 is possible. These adsorption<br />
phenomena are summarized by the so-called spreading pressure π. For the situation as<br />
mentioned above (pre-adsorption <strong>and</strong> co-adsorption) we could formulate:<br />
π = πS2,1<br />
The real but just adsorbed molecules decrease the interfacial tension γS of the ideal “bare”<br />
surface (nothing at all is adsorbed) <strong>and</strong> can be written to:<br />
γS2 = γS " πS2,1 (3)<br />
The combination of the equations (2) <strong>and</strong> (3) results in equation (4) that we shall use in the<br />
following discussion:<br />
γS " πS2,1 = γS1 + γ12⋅cos Θ (4)<br />
In Table 1 several situations of adsorption at the interfacial molecular level are summarized<br />
schematically. The sophisticated real situation is strongly simplified <strong>and</strong> reduced onto the<br />
main topic: distribution <strong>and</strong> spreading of the adsorbed molecules at the interfacial region.<br />
Table 1 also presents the schedule of the following experiments <strong>and</strong> investigations.<br />
To compare the different experiments that are summarized in Table 1 we make the following<br />
assumptions <strong>and</strong> postulate:<br />
Case 1:<br />
The wooden surface is still untreated by plasma (index “zero”, 0) <strong>and</strong> is h<strong>and</strong>led un<strong>der</strong> normal<br />
atmosphere of moisten air (index “V”, symbolized in Table 1 as circles). The part of pre-<br />
adsorption of water molecules (index “V”) is expressed by π0,V as:<br />
γSV,0 = γS,0 " π0,V (3.1)<br />
After a drop of the test liquid contacts the wooden surface (index “L”) the measured contact<br />
angle Θ = Θ0,LV = Θ0,V describes the YOUNG´s equation (2) in that manner:<br />
γSV,0 = γSL,0 + γLV⋅cos Θ0,LV (2.1)<br />
The combination of both terms as given above results in:<br />
γS,0 − π0,V = γSL,0 + γLV⋅cos Θ0,V (4.1)<br />
Because the statistically number of primary places of specific adsorption of water molecules<br />
onto the wooden surface before (π0,V) <strong>and</strong> after wetting (π0,LV) with the test liquid (based on<br />
water as solvent) remains fairly constant, we expect:<br />
π0,V = π0,LV
Manuscript, H. Schulz <strong>and</strong> A. <strong>Horn</strong>, Hildesheim, henrik.schulz@archaeometrielabor.com 5<br />
Table 1 Scheme of the molecular distribution at the wood/air interface respectively the wood/outer liquid interface before <strong>and</strong> after the<br />
plasma treatment. (The symbols mean: circles: adsorbed water; squares: co-adsorbed n-hexane.)<br />
condition of the wooden surface (S) before wetting with the test liquid (L) after wetting with the test liquid (L) three-phase situation with contact angle Θ<br />
Case 1:<br />
The wooden surface is still untreated<br />
by plasma (index “zero”, 0) <strong>and</strong> is<br />
h<strong>and</strong>led un<strong>der</strong> normal atmosphere of<br />
moisten air (index “V”).<br />
Case 2:<br />
The same situation like case 1, but<br />
now the wooden surface is just<br />
treated by plasma (index “one”, 1).<br />
Case 3:<br />
This case is vary similar to case 1,<br />
but the initially presence of normal<br />
atmosphere (moisten air) is even<br />
replaced by n-hexane as outer fluid<br />
(index “H”).<br />
Case 4:<br />
The situation is like that in case 3,<br />
but now the wooden surface is just<br />
treated by plasma, was in contact<br />
with moisten air <strong>and</strong> finally the air is<br />
replaced by n-hexane as outer fluid.<br />
π0,V<br />
π1,V<br />
π0,V + π0,H<br />
π1,V + π1,H<br />
π0,LV<br />
π1,LV<br />
π0,LV + π0,LH<br />
π1,LV + π1,LH<br />
γS,0 − π0,V = γSL,0 + γLV⋅cos Θ0,V<br />
γS,1 − π1,V = γSL,1 + γLV⋅cos Θ1,V<br />
γS,0 − (π0,V + π0,H) = γSL,0 + γLH⋅cos Θ0,H<br />
γS,1 − (π1,V + π1,H) = γSL,1 + γLH⋅cos Θ1,H
Manuscript, H. Schulz <strong>and</strong> A. <strong>Horn</strong>, Hildesheim, henrik.schulz@archaeometrielabor.com 6<br />
Case 2:<br />
The same situation like case 1, but now the wooden surface is just treated by plasma (index<br />
“one”, 1). The part of pre-adsorption of water molecules before (π0,V) <strong>and</strong> after (π1,V) the<br />
treatment is different:<br />
π0,V > π1,V<br />
but after wetting the surface with the aqueous test liquid (index “L”) the coverage of water<br />
molecules is the same like that before, i.e. the initial situation stated out in case 1:<br />
π1,LV = π0,V<br />
With the measured contact angle Θ1,V the YOUNG´s equation (4) is actually:<br />
γSV,1 = γS,1 " π1,V <strong>and</strong><br />
γS,1 − π1,V = γSL,1 + γLV⋅cos Θ1,V (4.2)<br />
Case 3:<br />
This case is very similar to case 1, but the initially presence of normal atmosphere (moisten<br />
air, index “V”) is even replaced by n-hexane as outer fluid (index “H”). Both spreading<br />
pressures π0,V <strong>and</strong> π0,H have an effect on the coverage of fluids onto the surface. But the<br />
situation of adsorption before <strong>and</strong> after contact the wooden surface un<strong>der</strong> n-hexane with the<br />
aqueous test liquids remains unchanged <strong>and</strong> the same:<br />
π0,V + π0,H = π0,LV + π0,LH<br />
<strong>and</strong><br />
π0,H = π0,LH<br />
because of<br />
π0,V = π0,LV (see case 1).<br />
Consi<strong>der</strong>ing the strong polar surface of wood (hydroxy groups) we can expect<br />
π0,V > π0,H<br />
The YOUNG term is very similar to case 1:<br />
γSH,0 = γS,0 " (π0,V + π0,H)<br />
<strong>and</strong><br />
γS,0 − (π0,V + π0,H) = γSL,0 + γLH⋅cos Θ0,H (4.3)
Manuscript, H. Schulz <strong>and</strong> A. <strong>Horn</strong>, Hildesheim, henrik.schulz@archaeometrielabor.com 7<br />
Case 4:<br />
The situation is like that in case 3, but now the wooden surface is just treated by plasma, was<br />
in contact with moisten air <strong>and</strong> finally the air is replaced by n-hexane as outer fluid. The<br />
coverage of n-hexane onto the wooden surface before <strong>and</strong> after the contact with the test<br />
liquids remains constant:<br />
π1,H = π1,LH<br />
<strong>and</strong> also unchanged in relation to the untreated situation (see case 3):<br />
π1,H = π0,H<br />
Analogous to eq. (4.3) the YOUNG expression is the following:<br />
γSH,1 = γS,1 " (π1,V + π1,H)<br />
<strong>and</strong><br />
γS,1 − (π1,V + π1,H) = γSL,1 + γLH⋅cos Θ1,H (4.4)<br />
If we consi<strong>der</strong> the ideal situation, where no adsorption at all takes place, we can write:<br />
γS,0 = γS,1<br />
And furthermore is valid:<br />
γSL,0 = γSL,1<br />
because the strength of interaction between the surface groups <strong>and</strong> the molecules of the test<br />
liquids only depends on the kind of intermolecular bonding, <strong>and</strong> not on the absolute number<br />
of places of adsorption onto the surface.<br />
In an easy combination of the equations (4.1) to (4.4) using the simplifications given above<br />
we can calculate the change of adsorption ∆π = π0,V − π1,V by simple contact angle<br />
measurements. Finally we can estimate the absolute number of the activated surface groups<br />
immediately after the treatment by dielectric discharges.<br />
To make all these surface phenomena visible we have stained the untreated <strong>and</strong> plasma<br />
treated wooden surfaces with a metachromatic dye. Metachromatism is a phenomenon of the<br />
change of the light absorption of dyes which is caused by aggregation <strong>and</strong> specific adsorption<br />
of the dye molecules onto a solid surface. Obviously one of the best investigated staining<br />
reaction is the toluidine blue reaction [9-11]. Chemically Toluidine Blue O is the ionic form<br />
(the ammonium <strong>and</strong> thionium chloride) of 3-Amino-7-(dimethylamino)-2-methylphenothiazine.<br />
If one extract the ionic form of the toluidine blue out of an aqueous alkaline<br />
solution into an aprotic solvent like n-hexane the colour changes to a yellowish orange.<br />
This form is called the imino base. Figure 3 summarizes the chemical reactions:
Manuscript, H. Schulz <strong>and</strong> A. <strong>Horn</strong>, Hildesheim, henrik.schulz@archaeometrielabor.com 8<br />
N<br />
CH 3<br />
(CH3 ) 2N S NH2 #<br />
Figure 3 Change of the ionic form of Toluidine Blue O into the non-ionic imino base<br />
<strong>and</strong> the following transfer of the imino base into n-hexane by extraction<br />
If we dip untreated wood into an imino base extraction of n-hexane the wooden surface<br />
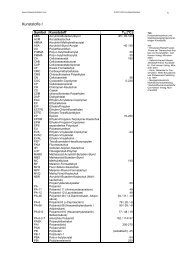
coloured bluish, but the plasma treated wood gets purple. In Figure 4 this displacement of the<br />
wavelength is illustrated for a piece of spruce.<br />
N<br />
CH 3<br />
(CH3 ) 2N S NH2 thionium-salt ammonium-salt<br />
N<br />
CH 3<br />
(CH ) N 3 2 S NH<br />
monomer (imino form)<br />
aqueous, alkaline<br />
extraction of the imino base<br />
(CH 3 ) 2 N<br />
N<br />
!<br />
+ OH<br />
- H2O (CH S<br />
3 ) 2N NH<br />
C<br />
H 3<br />
HN<br />
+ CH3-(CH2 ) 4-CH (n-hexane)<br />
3<br />
CH 3<br />
S NH<br />
slightly yellowish orange, n-hexane extract<br />
N<br />
#<br />
CH 3<br />
S N(CH 3 ) 2<br />
dimer (imino form)
Manuscript, H. Schulz <strong>and</strong> A. <strong>Horn</strong>, Hildesheim, henrik.schulz@archaeometrielabor.com 9<br />
Absorption<br />
0,5<br />
0,4<br />
0,3<br />
0,2<br />
0,1<br />
0,0<br />
-0,1<br />
-0,2<br />
-0,3<br />
λ1<br />
λ0<br />
-0,4<br />
300 350 400 450 500 550 600 650 700 750 800<br />
Wavelength [nm]<br />
Figure 4 Metachromatic shift ∆λ = λ0 − λ1 of the shorter wavelength of the adsorbed<br />
toluidine blue before (full line) <strong>and</strong> after the plasma treatment (dashed line) of<br />
a test piece of spruce<br />
There are several explanations [10,11] for the displacement of the light absorption of the free<br />
dye <strong>and</strong> the adsorbed dye onto the surface of a macromolecule like cellulose or protein.<br />
Aggregation (monomer <strong>and</strong> dimer forms) [9] <strong>and</strong> orientation [11] of the dye via hydrogen<br />
bonds with solvent molecules <strong>and</strong> the functional groups at the surface of macromolecules are<br />
discussed.<br />
We interpret the colour change of the dye onto the untreated wooden surface by interacting<br />
with the adsorbed water molecules, that results in the bluish hue. Further we assume that one<br />
molecule of toluidine blue takes up a surface area of about 6 – 7 Å in diameter [12] but then<br />
it is similar to the dimension of glucose as part of the macromolecule cellulose [13]. So that in<br />
the case of a plasma treated surface the dye interacts directly with the “bare” wooden surface<br />
(without any adsorbed water molecules).<br />
The molecules of the dye are flattening onto the wooden surface arranged e.g. by alcoholic<br />
hydroxy groups of the cellulose. The situation is schematically explained in Figure 5. The<br />
relations between the case studies in Table 1 <strong>and</strong> the dye/surface interaction that shown in<br />
Figure 5 are clearly seen.
Manuscript, H. Schulz <strong>and</strong> A. <strong>Horn</strong>, Hildesheim, henrik.schulz@archaeometrielabor.com 10<br />
H<br />
O<br />
H H<br />
H O<br />
H<br />
O<br />
H<br />
O<br />
H<br />
Figure 5 Two situations of adsorption of the uncharged imino form of the toluidine blue<br />
onto a wooden surface. Left side: Untreated wooden surface; unspecific<br />
adsorption by interaction with pre-adsorbed water molecules <strong>and</strong> re-reaction<br />
into the charged ammonium form. Right side: Plasma treated wooden surface;<br />
specific adsorption by hydrogen bonding between the alcoholic hydroxy<br />
groups onto the wooden surface <strong>and</strong> the imino form of the dye.<br />
We postulate a simple correlation between the metachromatic shift ∆λ = λ0 − λ1 (indices as<br />
given above) of the shorter absorption b<strong>and</strong> (around 600 nm) <strong>and</strong> the number ∆N of activated<br />
surface groups onto the plasma treated wooden surface. In this manner we connect the change<br />
in adsorption (energy) ∆π = π0,V − π1,V, the metachromatic shift ∆λ <strong>and</strong> the number of<br />
surface groups ∆N by means of the well-known PLANCK relation ∆E = h · ∆ν in which the<br />
quantum energy ∆E respects the energy which is necessary to orientate just one molecule of<br />
the dye that adsorbes at one activated surface group. ∆ν is the frequency shift, h is the<br />
PLANCK constant <strong>and</strong> c the velocity of light.<br />
Straight forward we can write:<br />
∆E ·∆N = ∆π (5)<br />
<strong>and</strong> recalculate the number ∆N as follows:<br />
⎛ 1 ⎞ ⎛ ∆π<br />
⎞<br />
∆N = ⎜<br />
⎟ ⎜ ⎟ λ 0 ⋅ λ 1<br />
⎝ hc<br />
⎠ ⎝ ∆λ<br />
⎠<br />
H<br />
(CH S<br />
3 ) 2N NH<br />
O<br />
C<br />
H 3<br />
H<br />
HN<br />
H<br />
H<br />
O<br />
O<br />
H<br />
O<br />
H<br />
H H<br />
650 pm<br />
N<br />
CH 3<br />
S N(CH 3 ) 2<br />
H<br />
O<br />
CH2 O<br />
O<br />
HO<br />
OH<br />
510 pm<br />
HO<br />
O<br />
CH 2 OH<br />
OH<br />
O<br />
OH<br />
O<br />
O HO<br />
O CH2 O H<br />
H<br />
CH2 O<br />
HO<br />
O<br />
OH<br />
O<br />
(6)<br />
OH<br />
CH2 O<br />
HO<br />
O
Manuscript, H. Schulz <strong>and</strong> A. <strong>Horn</strong>, Hildesheim, henrik.schulz@archaeometrielabor.com 11<br />
EXPERIMENTAL<br />
Sample Preparation<br />
Beech (hardwood) <strong>and</strong> spruce (softwood) were chosen because of the very common use as<br />
timber. Because of the important influence of the wood anatomical structure on the following<br />
measurements the cut of the raw material was the crucial moment. We used test samples with<br />
a fairly radial-tangential. If possible we have measured the contact angles only on areas of<br />
early wood regions.<br />
The test samples were cut mechanically using a circular saw <strong>and</strong> smoothed by a planning<br />
machine . The dimensions of the final test samples: 5 x 15 x 75 (high x broad x long; in<br />
millimetre). The storage of the test samples was in extra boxes in darkness un<strong>der</strong> room<br />
condition.<br />
Plasma Treatment<br />
The scheme of the discharge chamber are given in Figure 1 in the introduction. The<br />
construction of the chamber is non-commercial [6,7]. The material of the dielectric barrier is<br />
boron nitride (BN) which jackets the copper electrode. An alternating high voltage with<br />
separate high voltage pulses of 30 kV, a pulse duration of 2 µs <strong>and</strong> a pulse repletion rate of 15<br />
kHz is applied to the electrode, in or<strong>der</strong> to cause a discharge between the electrode <strong>and</strong> the<br />
wooden surface at atmospheric pressure. The distance between the electrodes was 20 mm <strong>and</strong><br />
that between the boron nitride electrode <strong>and</strong> the wooden surface of the test samples was 5<br />
mm. The air atmosphere was unconditioned, i.e. un<strong>der</strong> normal pressure <strong>and</strong> room temperature,<br />
but blown by a ventilator through the discharge gap with a rate of around 3 m/s. Immediately<br />
after the treatment the test samples were collected in boxes mentioned above. The activated<br />
surfaces should not be in direct contact with hol<strong>der</strong>s or other materials. The time between the<br />
plasma treatment <strong>and</strong> the following contact angles measurements <strong>and</strong> the staining procedure<br />
should be as short as possible.
Manuscript, H. Schulz <strong>and</strong> A. <strong>Horn</strong>, Hildesheim, henrik.schulz@archaeometrielabor.com 12<br />
Contact Angle Measurements<br />
Contact angle measurement occurs by the Sessile Drop Method with a video-based optical<br />
contact angle meter, equipped with an electronic syringe unit (OCA 15plus, DataPhysics<br />
Instruments GmbH, Germany). The measurement is carried out at room conditions. SCA 20<br />
software, Version 1.6, is used to operate the instrument <strong>and</strong> to calculate contact angles as well<br />
as free surface energy of the solid samples.<br />
Settings : Syringe type: Hamilton 1750 TLL (500 µl) used with a replaceable dosing needle<br />
with a inner diameter of 0.1 mm (Art.-No. 5132-1/4-B, GLT mbH, Germany).<br />
Drop type: normal, drop volume: 5 µl, dosing rate: 4 µl/s<br />
Frame grabbing time 20 s (25 images/s).<br />
Calculation method for the sessile drop: circle fitting (neglects gravity).<br />
Test Liquids: Water, water/ethylene glycol mixtures <strong>and</strong> aqueous solutions of CaCl2 (see table<br />
2).<br />
Colorimetric Measurements by UV/VIS-Spectroscopy<br />
Dye: Toliudineblue O, Chloride salt, dye content ~ 80%, Sigma-Aldrich Chemie, Steinheim<br />
Dye processing: Sodium hydroxide was added to a 10 -4 molar aqueous solution, to convert the<br />
dye salt into the dye base. The solution was covered with n-Hexane <strong>and</strong> shaken out for 15<br />
min. using a ultrasonic bath. Later on the mixture was transferred to a separation funnel <strong>and</strong><br />
the upper n-hexane phase with the imino form of the dye was separated.<br />
Procedure of dyeing: the samples were dyed by immersion using a Chromatogram Immersion<br />
device (CAMAG), two samples at a time. Time of dyeing: 10 min.<br />
Method of Measuring : UV/VIS-Spectroscopy, Tidas diode array spectrometer, J&M GmbH,<br />
Aalen, Germany; diffuse reflection, 45° optics, ∅ of measuring spot approx. 1,5 mm<br />
Settings: Absorbance, scan parameters: 300-800 nm, Step 1 nm, time of integration: 50 ms,<br />
time between two scans (time interval): 10 s, accumulation of scans: 10.<br />
Settings for spot <strong>and</strong> scanning measurements: The means out of 170 spot measurements of the<br />
treated samples <strong>and</strong> 30 spots of the reference for each species of wood.
Manuscript, H. Schulz <strong>and</strong> A. <strong>Horn</strong>, Hildesheim, henrik.schulz@archaeometrielabor.com 13<br />
RESULTS<br />
According to an earlier investigation of wooden surfaces by contact angle measurements [14]<br />
we have always chosen ethylene glycol/water mixtures <strong>and</strong> aqueous calcium chloride<br />
solutions as test liquids. Because of a better reproduction of our results we have measured the<br />
surface tensions γLV resp. the interfacial tensions γLH versus air resp. n-hexane by ourself. The<br />
values are summarized in Table 2:<br />
Table 2: Surface <strong>and</strong> interfacial tensions γLV resp. γLH in [mN/m] of the used test liquids,<br />
aqueous solutions, measured un<strong>der</strong> room condition (25 °C, 60 % RH))<br />
No. # test liquid γLV (versus air) γLH (versus. hexane)<br />
1 CaCl2, 10% 78,1 ±0,40 46,7 ±0,16<br />
2 CaCl2, 5% 73,4 ±0,07 47,5 ±0,05<br />
3 water 70,3 ±0,12 46,6 ±0,07<br />
4 ethylene glycol, 10% 69,2 ±0,07 41,2 ±0,06<br />
5 ethylene glycol, 20% 63,7 ±0,02 35,3 ±0,12<br />
6 ethylene glycol, 30% 59,8 ±0,22 33,1 ±0,02<br />
7 ethylene glycol, 40% 61,6 ±0,29 30,8 ±0,06<br />
8 ethylene glycol, 50% 55,0 ±0,05 27,4 ±0,03<br />
9 ethylene glycol, 60% 51,4 ±0,14 25,5 ±0,05<br />
We notify that our own values verify with those reported by literature [14,15,16] <strong>and</strong> are in a<br />
good agreement.<br />
In strong contrast to the very precise measurements of the surface tensions of liquids by the<br />
pendent drop method which are given above (Table 2) st<strong>and</strong>s the determination of the solid<br />
surface free energy using the contact angle method. Not only the well known but general<br />
effects of the surface roughness <strong>and</strong> especially the chemical heterogeneity of the wooden<br />
surface make it very difficult to measure a reliable <strong>and</strong> representative contact angle of the<br />
wetting <strong>and</strong> spreading test liquid onto the solid surface [17,18]. Unfortunately the measured<br />
contact angles of so-called high energy surfaces like wood exhibit hysteresis <strong>and</strong> cannot be<br />
defined unambiguously by experiment. The results compiled in the tables 3 <strong>and</strong> 4 compare<br />
badly with the conciseness of Table 2. Nevertheless these data should be practicable for the<br />
further discussions. Consi<strong>der</strong>ing the dynamic process of wetting <strong>and</strong> spreading of the test
Manuscript, H. Schulz <strong>and</strong> A. <strong>Horn</strong>, Hildesheim, henrik.schulz@archaeometrielabor.com 14<br />
liquid after the application onto the wooden surface the contact angle was measured two<br />
seconds later. Finally the mean of the contact angles Θ were calculated out of five reliable<br />
measurements for each test liquid onto the same piece of wood (without consi<strong>der</strong>ation of the<br />
st<strong>and</strong>ard deviation). The results for two wooden surfaces (spruce <strong>and</strong> beech wood) are<br />
summarized in Table 3 <strong>and</strong> 4. For the indices <strong>and</strong> the case studies see also Table 1 as given in<br />
the introduction.<br />
Table 3: Means of the contact angles Θ [in degree] onto even spruce wood surfaces,<br />
test liquid<br />
calculated out of five reliable measurements for each test liquid onto the same<br />
piece of wood, two seconds after the application of the test liquid (without<br />
consi<strong>der</strong>ation of the st<strong>and</strong>ard deviation)<br />
case 1 case 2 case 3 case 4<br />
Θ0,V Θ1,V Θ0,H Θ1,H<br />
CaCl2, 10% 53,2 11,4 70,5 42,9<br />
CaCl2, 5% 56 12,7 74,8 50,6<br />
water 44 10,9 61,1 53,5<br />
ethylene glycol, 10% 40,2 11,2 65,1 51,2<br />
ethylene glycol, 20% 29,5 11,4 62,1 49,3<br />
ethylene glycol, 30% 30,7 8,5 63,2 62,1<br />
ethylene glycol, 40% 24,7 8,9 64,1 54,7<br />
ethylene glycol, 50% 15,1 9,9 58,3 53,9<br />
ethylene glycol, 60% 16,5 7,8 57,7 44,6<br />
Table 4: Means of the contact angles Θ [in degree] for several test liquids onto beech<br />
test liquid<br />
wood surfaces (calculations as given in table 3.)<br />
case 1 case 2 case 3 case 4<br />
Θ0,V Θ1,V Θ0,H Θ1,H<br />
CaCl2, 10% 40,5 19,6 80,6 43,4<br />
CaCl2, 5% 23,4 8,2 78,1 37,4<br />
water 23,6 5,2 66,9 44,9<br />
ethylene glycol, 10% 26,4 8,4 64,2 39,3<br />
ethylene glycol, 20% 15,8 7,8 61,1 42,7<br />
ethylene glycol, 30% 11,6 6,6 58,3 39,2<br />
ethylene glycol, 40% 12,2 5,8 60,7 38<br />
ethylene glycol, 50% 10 7,6 55,4 36,2<br />
ethylene glycol, 60% 8,7 5,2 55,6 36,3
Manuscript, H. Schulz <strong>and</strong> A. <strong>Horn</strong>, Hildesheim, henrik.schulz@archaeometrielabor.com 15<br />
The estimated contact angles un<strong>der</strong> normal atmosphere (moisten air) are concerned about the<br />
reliability of the measured values onto the untreated as well as the plasma treated wooden<br />
surfaces. Low energy materials tend to adsorb strongly onto high-energy surfaces, as this will<br />
decrease the surface energy of the system. The plasma treatment of wooden surfaces leads to<br />
a bor<strong>der</strong>line case: The surface energy of the solid surface <strong>and</strong> the surface energies of the test<br />
liquids are very similar. The contact angle is small. Contact angles below 10° are poor,<br />
unreliable <strong>and</strong> cause of errors. Therefore we have changed the outer fluid by n-hexane <strong>and</strong><br />
received much better results of the contact angles (see table 4.).<br />
Also the differences in the surface activity of the two kinds of wood before <strong>and</strong> after the<br />
plasma treatment can be realized by staining. The metachromatic shifts ∆λ = λ0 − λ1 of the<br />
adsorbed toluidine blue onto both wood (untreated <strong>and</strong> plasma treated beech <strong>and</strong> spruce) is<br />
given in table 5.<br />
Table 5: The metachromatic shift ∆λ = λ0 − λ1 of untreated (reference) <strong>and</strong> plasma<br />
treated wood samples (means out of 170 spot measurements of the treated<br />
samples <strong>and</strong> 30 spots of the reference for each kind wood), discharge<br />
condition: normal atmosphere of air, pulse duration of 2 µs <strong>and</strong> a pulse<br />
repletion rate of 15 kHz, total time 10 s, duration of staining (imino base<br />
extraction by n-hexane) 10 minutes<br />
wood λ0 [nm] λ1 [nm] ∆λ [nm]<br />
beech 599±1 588±1 11<br />
spruce 591±1 567±1 24<br />
Obviously the increase of the shift ∆λ is accompanied by the decrease of the contact angle Θ .<br />
But there are more hidden details that pointed out the specific adsorption of the dye molecules<br />
onto the activated wooden surface, especially about the role of the number of surface groups<br />
N0 . In the following discussion the energetic aspect of adsorption shall consi<strong>der</strong> in detail.<br />
DISCUSSION<br />
Low-energy materials (organic compounds but also water) tend to adsorb strongly onto highenergy<br />
surfaces <strong>and</strong> decrease the total surface energy of the system. High-energy materials<br />
like metals, metal oxides <strong>and</strong> inorganic compounds (silica, sapphire, graphite) have surface<br />
tensions γS in the range of 200 – 5000 mN/m. On the other h<strong>and</strong>, the or<strong>der</strong> of γS of low-energy
Manuscript, H. Schulz <strong>and</strong> A. <strong>Horn</strong>, Hildesheim, henrik.schulz@archaeometrielabor.com 16<br />
materials ranged below 100 mN/m. Wood as a highly functional surface (for example by the<br />
hydroxy group of the cellulose molecules, see also Figure 5) st<strong>and</strong>s between the low- <strong>and</strong><br />
high-energy materials, especially after plasma treatment. Thus, a freshly treated wooden<br />
surface that exposed to an ordinary environment (e.g. moisten air) tends rapidly to be covered<br />
with a film of adsorbed water. Therefore we should expect a remarkable value of the<br />
spreading pressure π [18a]. All these phenomena are summarized in Table 1. Let us compile<br />
the essentials of the given models of adsorption again:<br />
1). The total number N0 of surface groups are fairly constant <strong>and</strong> not influenced by the<br />
plasma treatment of the surface:.<br />
π0,V ≈ π0,LV ≈ π1,LV<br />
2.) n-hexane is accepted to adsorb only statistically, because there are no polar functional<br />
groups in the outer fluid that could arrange interaction with the polar surface of the<br />
wood; so no specific adsorption take place:<br />
π0,H ≈ π0,LH ≈ π1,H ≈ π1,LH<br />
3). The plasma treatment strongly increases the number ∆N of activated functional groups<br />
onto the wooden surface, ∆N = N0 − N,<br />
wherein N is the number of remaining inactive <strong>and</strong> saturated surface groups by<br />
adsorption.<br />
4.) The number of activated functional groups ∆N is proportional to the change of the<br />
spreading pressure, ∆π = π0,V − π1,V:<br />
∆π ~ ∆N<br />
5). γS,0 = γS,1<br />
In both cases (per definition) the surface is “bare” (total empty), there is no adsorption<br />
at all.<br />
6). Although the interaction between the surface (functional groups) <strong>and</strong> the wetting liquid<br />
is very sensitive to the polar <strong>and</strong> hydrogen bonding forces the change in γSL before <strong>and</strong><br />
after the plasma treatment is negligible because of the nearly constant surface<br />
concentration of functional groups at all (no additional new kind of surface groups will<br />
be created by the plasma treatment <strong>and</strong> the absolute number of them remain constant):<br />
In other words: If the interaction parameter φ for a series of test liquid is constant, the<br />
change in γSL disappears:<br />
∆γSL = γSL,0 − γSL,1 = 0
Manuscript, H. Schulz <strong>and</strong> A. <strong>Horn</strong>, Hildesheim, henrik.schulz@archaeometrielabor.com 17<br />
The latter circumstance can be explained by the theory of GOOD <strong>and</strong> GIRIFALCO [18a, 19]. In<br />
combination of the YOUNG equation <strong>and</strong> the theory of GOOD <strong>and</strong> GIRIFALCO the exact but<br />
striking simple relation:<br />
1<br />
1 + cos θ γLH (7)<br />
4<br />
γc = ( ) 2<br />
terms out, wherein γc is the critical surface tension:<br />
γc =<br />
lim γLH (7.1)<br />
Θ →<br />
0<br />
For a series of test liquids with almost the same interaction parameter (φ = const.) the plot of<br />
γc against γLH is a function with a maximum at γc,max . Figure 6. shows such a plot of a sample<br />
of spruce wood before <strong>and</strong> after treated by plasma.<br />
[mNm -1 ]<br />
γ c<br />
35<br />
30<br />
25<br />
20<br />
15<br />
γ(c,max),1<br />
10<br />
25 30 35 40 45 50<br />
γ LH [mNm -1 ]<br />
Figure 6. Equation of state plots (eq. (7)) of untreated (∆) <strong>and</strong> plasma treated (Ο) spruce<br />
un<strong>der</strong> n-hexane as outer fluid<br />
In table 6. the values of γ(c,max),0 , γ(c,max),1 <strong>and</strong> ∆γc,max of both wood species un<strong>der</strong> air <strong>and</strong><br />
n-hexane as outer liquid are summarized.<br />
γ(c,max),0
Manuscript, H. Schulz <strong>and</strong> A. <strong>Horn</strong>, Hildesheim, henrik.schulz@archaeometrielabor.com 18<br />
Table 6: The values of γ(c,max),0 , γ(c,max),1 <strong>and</strong> ∆γc,max (in [mNm- 1 ]) of both wood<br />
species un<strong>der</strong> air resp. n-hexane as outer liquid (indices “V” resp. “H”)<br />
un<strong>der</strong> moisten air (index “V”) un<strong>der</strong> n-hexane (index “H”)<br />
γ(c,max),0 γ(c,max),1 ∆γc,max γ(c,max),0 γ(c,max),1 ∆γc,max ∆π<br />
beech 60,7 - - 19,8 29,7 9,9 8 to 14<br />
spruce 54,1 - - 20,6 26,3 5,7 1 to 7<br />
If we consi<strong>der</strong> that the change in the interfacial energy of the wooden surface after the plasma<br />
treatment is only effected by the change of the spreading pressure ∆π = π0,V − π1,V this value<br />
is easy to calculate in making the difference between eq. (4.3) minus eq. (4.4):<br />
γLH⋅cos Θ1,H = (π0,V − π1,V) + γLH⋅cos Θ0,H (8)<br />
The very simple linear relation with the slope of unit one, the absisse γLH⋅cos Θ0,H <strong>and</strong> the<br />
ordinate γLH⋅cos Θ1,H has the interception of ∆π. In Figure 7. a scratch of four values of ∆π is<br />
illustrated for spruce wood un<strong>der</strong> n-hexane.<br />
γ LH cos θ 1,H<br />
45<br />
40<br />
35<br />
30<br />
25<br />
20<br />
15<br />
2<br />
1<br />
3<br />
d<br />
10<br />
0 5 10 15 20 25 30<br />
5<br />
9<br />
8<br />
7<br />
6<br />
4<br />
γ LH cos θ 0,H<br />
a<br />
b<br />
c<br />
Figure 7. Graphs for the interpretation of eq. (8) by a series of test liquids (numbers as<br />
are given in table 2.), surface of spruce wood.<br />
a) ∆π = 19 mNm -1 ; b) ∆π = 13 mNm -1 ; c) ∆π = 7 mNm -1 <strong>and</strong> d) ∆π = 1 mNm -1
Manuscript, H. Schulz <strong>and</strong> A. <strong>Horn</strong>, Hildesheim, henrik.schulz@archaeometrielabor.com 19<br />
This plot gives a good impression of the sensitive influence of the interaction parameter φ<br />
which is causing by the different test liquids. The test liquids No. 1 <strong>and</strong> No. 2 are strongly<br />
ionic (CaCl2/H2O) rather than the more polar <strong>and</strong> hydrogen bonding liquids No. 3 – 9<br />
(water/ethylene glycol mixtures). If we consi<strong>der</strong> only the latter series we receive an expected<br />
value of ∆π between 1 <strong>and</strong> 7 mNm -1 for the sample of spruce wood. In the same way we have<br />
estimated the value for the sample of beech wood: ∆π between 8 <strong>and</strong> 14 mNm -1 . These two<br />
value are compiled into the table 6 (last right column). If we compare the values of ∆π with<br />
those of ∆γc,max they correspond in good agreement for both wood species. The reliability of<br />
the equation of state (eq. (7)) <strong>and</strong> the adsorption therm (eq. (8)) is given in practice an we set<br />
∆γc,max = ∆π . If we do so, finally we can estimate the number ∆N of activated functional<br />
groups onto the wooden surface that are created by the plasma treatment. We use eq. (6):<br />
⎛ 1 ⎞ ⎛ ∆π<br />
⎞<br />
∆N = ⎜<br />
⎟ ⎜ ⎟ λ 0 ⋅ λ 1<br />
⎝ hc<br />
⎠ ⎝ ∆λ<br />
⎠<br />
With the data given in the tables 5. <strong>and</strong> 6. the following values of ∆N were calculated <strong>and</strong> are<br />
summarized in table 7.<br />
Table 7: Summary of the experimental data (see table 5 <strong>and</strong> 6) for the estimation of the<br />
increase of the number of activated surface groups ∆N by plasma treatment<br />
(beech <strong>and</strong> spruce wood)<br />
wood λ0 [nm] λ1 [nm] ∆λ [nm] ∆π [mNm -1 ] ∆N [cm -2 ]<br />
beech 599 588 11 8 1,3 10 14<br />
(6)<br />
14 2,3 10 14<br />
spruce 591 567 24 1 7,1 10 12<br />
7 5,0 10 13<br />
The magnitude of the estimated ∆N is of reasonable or<strong>der</strong> for surface groups of isolators [20].<br />
Unfortunately no details about the number of hydroxy groups onto the surface of cellulose or<br />
wood were given or found in literature resp. We found in the literature for the number of<br />
hydroxy groups onto surfaces of SiO2 5⋅10 14 cm -2 <strong>and</strong> Al2O3 8⋅10 14 cm -2 [21].
Manuscript, H. Schulz <strong>and</strong> A. <strong>Horn</strong>, Hildesheim, henrik.schulz@archaeometrielabor.com 20<br />
CONCLUSIONS<br />
The reasonable results in assessing the contribution of adsorption to the interfacial energy <strong>and</strong><br />
the prediction of the extent in change of activated surface groups after plasma treatment<br />
justified some simplifying assumptions in or<strong>der</strong> to apply theories to much more complex<br />
practical systems like wood.<br />
With the help of a rather simple model it is possible to characterize the change of a wooden<br />
surface after the treatment by electric discharge with a series of measurements of the contact<br />
angles <strong>and</strong> the light absorption of suitable dyes (e.g. toluidine blue). The practical advantage<br />
of both methods is there more summarized than in detail working procedure of the<br />
measurement. The determination of the interfacial energy by contact angle measurements <strong>and</strong><br />
also the absorption of light onto <strong>and</strong> their reflectance from a surface are integral <strong>and</strong> collective<br />
methods. It means that most of the microscopic small inhomogeneities <strong>and</strong> artefacts onto the<br />
real wooden surface would scaled down by the huge number of the regular surface groups.<br />
Therefore the fuzzy set potential of both methods is remarkable <strong>and</strong> useful in further<br />
investigations of surface phenomena. The simple model given above can help to recognize<br />
good treatment for technological practising like to glue, to paste, to cover or to coat. The<br />
number of activated surface groups ∆N could be a kind of quality mark as part of the control<br />
of the technical process in production <strong>and</strong> manufacturing. In contrast to the very easy <strong>and</strong><br />
rapid staining procedure the measurements of contact angles are time consuming <strong>and</strong> often<br />
disturbed by the environment. Therefore the relation between ∆N <strong>and</strong> ∆λ is in particular of<br />
interest. The predicted values of ∆N are 7.1 10 12 to 5.0 10 13 cm -2 for spruce wood <strong>and</strong> 1.3 to<br />
2.3 10 14 cm -2 for beech wood. The magnitude of these values are suitable <strong>and</strong> comparable<br />
with those known from inorganic isolators like silicon dioxide <strong>and</strong> aluminium oxide [20,21].<br />
The model that is given here could be used to verify several wood species <strong>and</strong> there surfaces<br />
to improve <strong>and</strong> optimise the procedure of dielectric barrier discharges at atmospheric pressure<br />
in the technological advance.<br />
ACKNOWLEDGMENTS<br />
This work was supported by research grants from the Volkswagenstiftung. The authors are<br />
indebted to their colleagues, Andreas Bu<strong>der</strong>, Peter Rehn <strong>and</strong> Dr. W. Viöl for their help in the<br />
preparation of the manuscript. Special thanks to Mr. P. Rehn for carrying out the DBD<br />
experiments.
Manuscript, H. Schulz <strong>and</strong> A. <strong>Horn</strong>, Hildesheim, henrik.schulz@archaeometrielabor.com 21<br />
REFERENCES<br />
[1] Zeppenfeld, G., Klebstoffe in <strong>der</strong> Holz- und Möbelindustrie, Leipzig, 1991<br />
[2] Fengel, D. <strong>and</strong> Wegener, G., Wood – Chemistry, Ultrastructure, Reactions, de Gruyter, Berlin, 1989<br />
[3 ] Wagenführ, R. <strong>and</strong> Scheiber, Ch., Holzatlas, Leipzig, 1989<br />
[4] Sjöström, E., Wood chemistry, Fundamentals <strong>and</strong> Applications, Academic Press, New York, 1981<br />
[5] Richardson, P., Timbers of the World, Harlow, Longman, 1979<br />
[6] Rehn, P., Wolkenhauer, A., Bente, B., Förster, S. <strong>and</strong> Viöl, W, Wood surface modification in dielectric<br />
barrier discharges at atmospheric pressure, Surface <strong>and</strong> Coating Technol., 174-175, p. 515-518 (2003)<br />
[7 Avramidis, G., Leck, M., Meiners, A., Rehn, P., Viöl, W., <strong>and</strong> Wolkenhauer, A., Improvement of adhesion<br />
of wood coatings by plasma-pre-treatment, holztechnologie, 46(2005)40-47<br />
[8] Myers, D., Surfaces, Interfaces <strong>and</strong> Colloids, Principles <strong>and</strong> Applications, 2 nd . ed., Wiley-VCH, 1999<br />
[9] Harms, H., H<strong>and</strong>buch <strong>der</strong> Farbstoffe für die Mikroskopie, Staufen Verlag, 1965<br />
[10] Toepfer, K., Die Thiazinfarbstoffe. – Progress in Histochemistry <strong>and</strong> Cytochemistry, Stuttgart, 1(1970)<br />
277-354<br />
[11] Hutschenreiter, J. <strong>and</strong> Scheuner, G., Das Auftreten von Metachromasie, Doppelbrechung und Dichroismus<br />
durch die Toluidinblaureaktion. – Progress in Histochemistry <strong>and</strong> Cytochemistry, Stuttgart, 7(1975), 73 p.<br />
[12] Fautrez, J., <strong>and</strong> Lison, L., Protoplasma, 27, 183 (1937); cited in [11], p. 7<br />
[13] Volhardt, J., Lehrbuch <strong>der</strong> Organischen Chemie, VCH, Weinheim, 1998<br />
[14] Nguyen, T. <strong>and</strong> Johns, W. E., The Effects of Aging <strong>and</strong> Extraction on the Surface Free Energy of Douglas<br />
Fir <strong>and</strong> Redwood, Wood Sci. Technol., 13, 29-40 (1979)<br />
[15] DataPhysics, Software Package for the system OCA 15plus, DataPhysics Instruments GmbH, Germany,<br />
www.dataphysics.de<br />
[16] Jasper, J. J., The Surface Tension of Pure Liquid Compounds, J. Phys. Chem. Ref. Data, Vol. 1, No. 4,<br />
NSDRS, 1972, p. 859<br />
[17] Myers, D., Surfaces, Interfaces <strong>and</strong> Colloids, Wiley-VCH, 2 nd . ed., 1999<br />
[18] Wu, S., Polymer Interface <strong>and</strong> Adhesion, Dekker, 1982<br />
[18a] ibd., p. 215<br />
[19] Girifalco, L.A. <strong>and</strong> Good, R. J., J. Phys. Chem., 61, 904(1957)<br />
[20] Schulz, H., Investigations of the electrical potential at electrolyte/polymer interfaces, thesis, Berlin, 1986<br />
[21] Davis, J.A., James, R.D. <strong>and</strong> Leckie, J.O., J. Colloid Interface Sci., 63, 480(1978)