A fuzzy inference system with application to player selection and ...
A fuzzy inference system with application to player selection and ...
A fuzzy inference system with application to player selection and ...

Create successful ePaper yourself
Turn your PDF publications into a flip-book with our unique Google optimized e-Paper software.
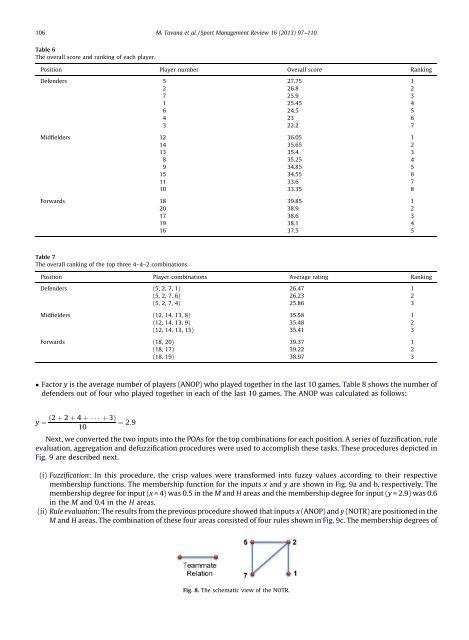
106M. Tavana et al. / Sport Management Review 16 (2013) 97–110Table 6The overall score <strong>and</strong> ranking of each <strong>player</strong>.Position Player number Overall score RankingDefenders 5 27.75 12 26.8 27 25.9 31 25.45 46 24.5 54 23 63 22.2 7Midfielders 12 36.05 114 35.65 213 35.4 38 35.25 49 34.85 515 34.55 611 33.6 710 33.35 8Forwards 18 39.85 120 38.9 217 38.6 319 38.1 416 37.5 5Table 7The overall ranking of the <strong>to</strong>p three 4–4–2 combinations.Position Player combinations Average rating RankingDefenders (5, 2, 7, 1) 26.47 1(5, 2, 7, 6) 26.23 2(5, 2, 7, 4) 25.86 3Midfielders (12, 14, 13, 8) 35.58 1(12, 14, 13, 9) 35.48 2(12, 14, 13, 15) 35.41 3Forwards (18, 20) 39.37 1(18, 17) 39.22 2(18, 19) 38.97 3 Fac<strong>to</strong>r y is the average number of <strong>player</strong>s (ANOP) who played <strong>to</strong>gether in the last 10 games. Table 8 shows the number ofdefenders out of four who played <strong>to</strong>gether in each of the last 10 games. The ANOP was calculated as follows:y ¼ ð2 þ 2 þ 4 þ þ 3Þ¼ 2:910Next, we converted the two inputs in<strong>to</strong> the POAs for the <strong>to</strong>p combinations for each position. A series of fuzzification, ruleevaluation, aggregation <strong>and</strong> defuzzification procedures were used <strong>to</strong> accomplish these tasks. These procedures depicted inFig. 9 are described next.(i) Fuzzification: In this procedure, the crisp values were transformed in<strong>to</strong> <strong>fuzzy</strong> values according <strong>to</strong> their respectivemembership functions. The membership function for the inputs x <strong>and</strong> y are shown in Fig. 9a <strong>and</strong> b, respectively. Themembership degree for input (x = 4) was 0.5 in the M <strong>and</strong> H areas <strong>and</strong> the membership degree for input (y = 2.9) was 0.6in the M <strong>and</strong> 0.4 in the H areas.(ii) Rule evaluation: The results from the previous procedure showed that inputs x (ANOP) <strong>and</strong> y (NOTR) are positioned in theM <strong>and</strong> H areas. The combination of these four areas consisted of four rules shown in Fig. 9c. The membership degrees ofFig. 8. The schematic view of the NOTR.