The Living Conditions of Tenant Households Who Have Been on the ...
The Living Conditions of Tenant Households Who Have Been on the ...
The Living Conditions of Tenant Households Who Have Been on the ...

You also want an ePaper? Increase the reach of your titles
YUMPU automatically turns print PDFs into web optimized ePapers that Google loves.
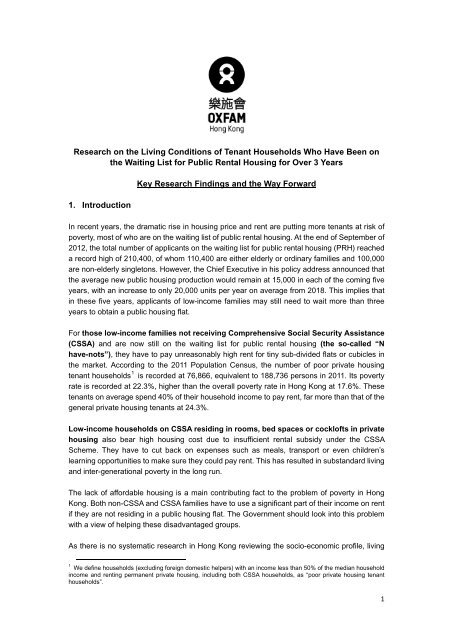
Research <strong>on</strong> <strong>the</strong> <str<strong>on</strong>g>Living</str<strong>on</strong>g> <str<strong>on</strong>g>C<strong>on</strong>diti<strong>on</strong>s</str<strong>on</strong>g> <str<strong>on</strong>g>of</str<strong>on</strong>g> <str<strong>on</strong>g>Tenant</str<strong>on</strong>g> <str<strong>on</strong>g>Households</str<strong>on</strong>g> <str<strong>on</strong>g>Who</str<strong>on</strong>g> <str<strong>on</strong>g>Have</str<strong>on</strong>g> <str<strong>on</strong>g>Been</str<strong>on</strong>g> <strong>on</strong><strong>the</strong> Waiting List for Public Rental Housing for Over 3 Years1. Introducti<strong>on</strong>Key Research Findings and <strong>the</strong> Way ForwardIn recent years, <strong>the</strong> dramatic rise in housing price and rent are putting more tenants at risk <str<strong>on</strong>g>of</str<strong>on</strong>g>poverty, most <str<strong>on</strong>g>of</str<strong>on</strong>g> who are <strong>on</strong> <strong>the</strong> waiting list <str<strong>on</strong>g>of</str<strong>on</strong>g> public rental housing. At <strong>the</strong> end <str<strong>on</strong>g>of</str<strong>on</strong>g> September <str<strong>on</strong>g>of</str<strong>on</strong>g>2012, <strong>the</strong> total number <str<strong>on</strong>g>of</str<strong>on</strong>g> applicants <strong>on</strong> <strong>the</strong> waiting list for public rental housing (PRH) reacheda record high <str<strong>on</strong>g>of</str<strong>on</strong>g> 210,400, <str<strong>on</strong>g>of</str<strong>on</strong>g> whom 110,400 are ei<strong>the</strong>r elderly or ordinary families and 100,000are n<strong>on</strong>-elderly singlet<strong>on</strong>s. However, <strong>the</strong> Chief Executive in his policy address announced that<strong>the</strong> average new public housing producti<strong>on</strong> would remain at 15,000 in each <str<strong>on</strong>g>of</str<strong>on</strong>g> <strong>the</strong> coming fiveyears, with an increase to <strong>on</strong>ly 20,000 units per year <strong>on</strong> average from 2018. This implies thatin <strong>the</strong>se five years, applicants <str<strong>on</strong>g>of</str<strong>on</strong>g> low-income families may still need to wait more than threeyears to obtain a public housing flat.For those low-income families not receiving Comprehensive Social Security Assistance(CSSA) and are now still <strong>on</strong> <strong>the</strong> waiting list for public rental housing (<strong>the</strong> so-called “Nhave-nots”), <strong>the</strong>y have to pay unreas<strong>on</strong>ably high rent for tiny sub-divided flats or cubicles in<strong>the</strong> market. According to <strong>the</strong> 2011 Populati<strong>on</strong> Census, <strong>the</strong> number <str<strong>on</strong>g>of</str<strong>on</strong>g> poor private housingtenant households 1 is recorded at 76,866, equivalent to 188,736 pers<strong>on</strong>s in 2011. Its povertyrate is recorded at 22.3%, higher than <strong>the</strong> overall poverty rate in H<strong>on</strong>g K<strong>on</strong>g at 17.6%. <str<strong>on</strong>g>The</str<strong>on</strong>g>setenants <strong>on</strong> average spend 40% <str<strong>on</strong>g>of</str<strong>on</strong>g> <strong>the</strong>ir household income to pay rent, far more than that <str<strong>on</strong>g>of</str<strong>on</strong>g> <strong>the</strong>general private housing tenants at 24.3%.Low-income households <strong>on</strong> CSSA residing in rooms, bed spaces or cockl<str<strong>on</strong>g>of</str<strong>on</strong>g>ts in privatehousing also bear high housing cost due to insufficient rental subsidy under <strong>the</strong> CSSAScheme. <str<strong>on</strong>g>The</str<strong>on</strong>g>y have to cut back <strong>on</strong> expenses such as meals, transport or even children’slearning opportunities to make sure <strong>the</strong>y could pay rent. This has resulted in substandard livingand inter-generati<strong>on</strong>al poverty in <strong>the</strong> l<strong>on</strong>g run.<str<strong>on</strong>g>The</str<strong>on</strong>g> lack <str<strong>on</strong>g>of</str<strong>on</strong>g> affordable housing is a main c<strong>on</strong>tributing fact to <strong>the</strong> problem <str<strong>on</strong>g>of</str<strong>on</strong>g> poverty in H<strong>on</strong>gK<strong>on</strong>g. Both n<strong>on</strong>-CSSA and CSSA families have to use a significant part <str<strong>on</strong>g>of</str<strong>on</strong>g> <strong>the</strong>ir income <strong>on</strong> rentif <strong>the</strong>y are not residing in a public housing flat. <str<strong>on</strong>g>The</str<strong>on</strong>g> Government should look into this problemwith a view <str<strong>on</strong>g>of</str<strong>on</strong>g> helping <strong>the</strong>se disadvantaged groups.As <strong>the</strong>re is no systematic research in H<strong>on</strong>g K<strong>on</strong>g reviewing <strong>the</strong> socio-ec<strong>on</strong>omic pr<str<strong>on</strong>g>of</str<strong>on</strong>g>ile, living1We define households (excluding foreign domestic helpers) with an income less than 50% <str<strong>on</strong>g>of</str<strong>on</strong>g> <strong>the</strong> median householdincome and renting permanent private housing, including both CSSA households, as “poor private housing tenanthouseholds”.1
2.1.3 Only 8.6% was given <strong>the</strong> SECOND OFFER <str<strong>on</strong>g>of</str<strong>on</strong>g> public rental housing with anaverage waiting time <str<strong>on</strong>g>of</str<strong>on</strong>g> 5.1 years.According to <strong>the</strong> survey, <strong>on</strong>ly 8.6% (43 cases) <str<strong>on</strong>g>of</str<strong>on</strong>g> <strong>the</strong> total resp<strong>on</strong>dents received <strong>the</strong> sec<strong>on</strong>d<str<strong>on</strong>g>of</str<strong>on</strong>g>fer with an average waiting time <str<strong>on</strong>g>of</str<strong>on</strong>g> 5.1 years or 61.7 m<strong>on</strong>ths in which an additi<strong>on</strong>al 7.4m<strong>on</strong>ths had to be c<strong>on</strong>sumed subsequent to <strong>the</strong> first housing <str<strong>on</strong>g>of</str<strong>on</strong>g>fer (See Appendix: Table 3 orFull Report Secti<strong>on</strong> 6.25).2.1.4 One in every three cases in <strong>the</strong> survey has <strong>on</strong>ce changed <strong>the</strong>ir district choice, <str<strong>on</strong>g>of</str<strong>on</strong>g>which 92.4% preferred urban districtAccording to <strong>the</strong> survey, <strong>on</strong>e in every three cases (38.5% or 193 cases) have changed <strong>the</strong>irdistrict opti<strong>on</strong> after <strong>the</strong> Government announced to allow PRH applicants to change <strong>the</strong>irpreferred locati<strong>on</strong> <str<strong>on</strong>g>of</str<strong>on</strong>g> PRH flats. Am<strong>on</strong>gst <strong>the</strong> applicants who have changed <strong>the</strong>ir district opti<strong>on</strong>s,about 92.4% wanted a flat in <strong>the</strong> urban district. Over half <str<strong>on</strong>g>of</str<strong>on</strong>g> <strong>the</strong>m (59%) understood that<strong>the</strong>y might have to wait l<strong>on</strong>ger to get into more c<strong>on</strong>venient areas. <str<strong>on</strong>g>The</str<strong>on</strong>g>re are three majorreas<strong>on</strong>s for applicants to change <strong>the</strong>ir district choice: a) closer to work place (77.3%), b) closerto school place <str<strong>on</strong>g>of</str<strong>on</strong>g> <strong>the</strong>ir children (68.5%) and c) better transportati<strong>on</strong> (74.4%) (See Full ReportSecti<strong>on</strong> 6.14 and 6.15).2.1.5 Poor private tenant households bear a higher housing cost<str<strong>on</strong>g>The</str<strong>on</strong>g> survey results showed that <strong>the</strong> median rent-to-income ratio was 30.1% for poorhouseholds, which was higher than that <str<strong>on</strong>g>of</str<strong>on</strong>g> overall private housing tenants in H<strong>on</strong>gK<strong>on</strong>g at 24.3%. If food and housing costs are also c<strong>on</strong>sidered, both categories shared 69% <str<strong>on</strong>g>of</str<strong>on</strong>g><strong>the</strong> total income <str<strong>on</strong>g>of</str<strong>on</strong>g> poor private tenant households. To meet <strong>the</strong>ir food and housing needs,<strong>the</strong>se households have to reduce o<strong>the</strong>r expenses and in turn, compromise <strong>the</strong>ir livingstandards (See Full Report Secti<strong>on</strong> 4.6 and 4.7).2.1.6 High living density per pers<strong>on</strong>, far below <strong>the</strong> Government’s minimum standardResults <str<strong>on</strong>g>of</str<strong>on</strong>g> <strong>the</strong> study showed that <strong>the</strong> median living space per pers<strong>on</strong> was about 4.2 squaremetres (or 45 square feet), which is far below <strong>the</strong> minimum living space standard <str<strong>on</strong>g>of</str<strong>on</strong>g> 5.5square metres per pers<strong>on</strong> according to <strong>the</strong> H<strong>on</strong>g K<strong>on</strong>g Housing Authority 2 . Taking 5.5square metres as <strong>the</strong> yardstick, about 61.8% <str<strong>on</strong>g>of</str<strong>on</strong>g> <strong>the</strong> surveyed households were overcrowded.Am<strong>on</strong>g <strong>the</strong>m, nearly half (48.9%) were 4-pers<strong>on</strong> households and 24.4% were 3-pers<strong>on</strong>households (See Appendix: Chart 1 or Full Report Secti<strong>on</strong> 4.9).Am<strong>on</strong>g those who were dissatisfied or very dissatisfied with <strong>the</strong> size <str<strong>on</strong>g>of</str<strong>on</strong>g> <strong>the</strong> flat, 59.4% statedthat <strong>the</strong> crowdedness led to family quarrels (See Full Report Secti<strong>on</strong> 5.10).2.1.7 Rents per square foot for tenants’ tiny accommodati<strong>on</strong>s are now <strong>on</strong> a par withluxury flats in urban centreAccording to <strong>the</strong> survey, rent for <strong>the</strong> resp<strong>on</strong>dents had <strong>on</strong> average risen around 14% over <strong>the</strong>past year which was higher than <strong>the</strong> government estimate at 12% 3 (See Appendix: Table 5 or2<str<strong>on</strong>g>The</str<strong>on</strong>g> definiti<strong>on</strong> <str<strong>on</strong>g>of</str<strong>on</strong>g> overcrowded households:http://www.housingauthority.gov.hk/en/public-housing/tenancy-matters/transfer/living-space-improvement-transfer-scheme/index.html3Opening speech by STH at <strong>the</strong> Internati<strong>on</strong>al C<strong>on</strong>ference <strong>on</strong> Spatial and Social Transformati<strong>on</strong> in Urban China. 133
Full Report Secti<strong>on</strong> 4.11).Worse still, calculated <strong>on</strong> a square-foot basis, <strong>the</strong> rent for <strong>the</strong>se tiny accommodati<strong>on</strong>s is nowas costly as that <str<strong>on</strong>g>of</str<strong>on</strong>g> some large private estates in <strong>the</strong> urban district. In October 2012, <strong>the</strong>average rent per square foot for <strong>the</strong>se tiny living spaces was about $22 which was comparableto that <str<strong>on</strong>g>of</str<strong>on</strong>g> some large private housing estates such as Mei Foo Sun Chuen, Sceneway Garden,Metro Town, etc. 4 (See Table 6 or Full Report Secti<strong>on</strong> 4.12).2.1.8 68.3% resided in cubicles, bed spaces or subdivided flats with unsatisfactoryliving c<strong>on</strong>diti<strong>on</strong>sAccording to <strong>the</strong> survey, 68.3% (or 342 cases) <str<strong>on</strong>g>of</str<strong>on</strong>g> <strong>the</strong> resp<strong>on</strong>dents are now living in ei<strong>the</strong>rcubicles (11.2%), bed spaces (0.8%) or subdivided flats( 56.3%) (See Appendix: Table 7 orFull Report Secti<strong>on</strong> 4.1 and 4.2).In additi<strong>on</strong>, <strong>the</strong> survey results showed <strong>the</strong> top three problems <str<strong>on</strong>g>of</str<strong>on</strong>g> <strong>the</strong> tenants’ living unit to be a)water leakage, b) falling <str<strong>on</strong>g>of</str<strong>on</strong>g>f <str<strong>on</strong>g>of</str<strong>on</strong>g> c<strong>on</strong>crete and c) exposure <str<strong>on</strong>g>of</str<strong>on</strong>g> steel rope. A total <str<strong>on</strong>g>of</str<strong>on</strong>g> 59%, 49.3%and 45.9% <str<strong>on</strong>g>of</str<strong>on</strong>g> tenant households opined that problems <str<strong>on</strong>g>of</str<strong>on</strong>g> water leakage, fall <str<strong>on</strong>g>of</str<strong>on</strong>g>f <str<strong>on</strong>g>of</str<strong>on</strong>g> c<strong>on</strong>creteand exposure <str<strong>on</strong>g>of</str<strong>on</strong>g> steep rope were serious respectively (See Appendix: Table 8 or Full ReportSecti<strong>on</strong> 5.3).2.2 Housing problem <str<strong>on</strong>g>of</str<strong>on</strong>g> low-income families <strong>on</strong> CSSA residing in private rentalflatsResults <str<strong>on</strong>g>of</str<strong>on</strong>g> <strong>the</strong> survey showed that poor tenant households <strong>on</strong> CSSA that are living in privaterental flats and have yet to obtain a public housing <str<strong>on</strong>g>of</str<strong>on</strong>g>fer bear a high housing cost due toinadequate rent allowance under <strong>the</strong> CSSA Scheme.Under CSSA, recipients are entitled to a rent allowance according to <strong>the</strong> Maximum Level <str<strong>on</strong>g>of</str<strong>on</strong>g>Rent Allowance (MRA), which varies according to <strong>the</strong> total number <str<strong>on</strong>g>of</str<strong>on</strong>g> family members.According to <strong>the</strong> government figures <str<strong>on</strong>g>of</str<strong>on</strong>g> January 2012 (Table A), 60.3% <str<strong>on</strong>g>of</str<strong>on</strong>g> recipients residing inprivate housing reported that CSSA payments were insufficient to cover <strong>the</strong>ir rising rent. <str<strong>on</strong>g>The</str<strong>on</strong>g>yhave to cut back o<strong>the</strong>r daily expenses like meals or children’s learning opportunities in order tomake up <strong>the</strong> difference.Table A: <str<strong>on</strong>g>The</str<strong>on</strong>g> number <str<strong>on</strong>g>of</str<strong>on</strong>g> CSSA cases renting private housing flats with <strong>the</strong> actual rent less than, equal toand higher than <strong>the</strong> Maximum Levels <str<strong>on</strong>g>of</str<strong>on</strong>g> Rent Allowance (MRA)Number <str<strong>on</strong>g>of</str<strong>on</strong>g> cases %Actual rent less than or equal to MRA 14,950 39.7Actual rent higher than MRA 22,688 60.3Total 36,946 100.0Source: Social Welfare Department, Census and Statistic Department, 2012December 2012. (http://www.thb.gov.hk/eng/psp/speeches/transport/land/2012/20121213.pdf)4Ricacorp Properties, October 20124
3. Policy Analysis – Why existing policies and measures are inadequate3.1 <str<strong>on</strong>g>The</str<strong>on</strong>g> shortage <str<strong>on</strong>g>of</str<strong>on</strong>g> public rental housingFor poor people paying high rent in private housing but still squeezing into tiny dwellings,having a public housing unit is <strong>the</strong>ir dream. Yet <strong>the</strong> current supply <str<strong>on</strong>g>of</str<strong>on</strong>g> public rental housing doesnot meet <strong>the</strong> demand. <str<strong>on</strong>g>The</str<strong>on</strong>g> waiting list is 121 per cent l<strong>on</strong>ger than it was nine years ago, anincrease from 90,240 applicati<strong>on</strong>s in 2003 to 199,600 5 in June 2012. It is worth noting that <strong>the</strong>total number <str<strong>on</strong>g>of</str<strong>on</strong>g> applicants <strong>on</strong> <strong>the</strong> waiting list had already climbed up to 210,400 6 bySeptember 2012 (100,400 are from ordinary families), in which an extra 10,800 new applicantswere added to <strong>the</strong> list within <strong>on</strong>ly four m<strong>on</strong>ths’ time from June to September 2012. <str<strong>on</strong>g>The</str<strong>on</strong>g> surgingdemand for public rental housing is loud and clear.However, <strong>the</strong> Chief Executive in his first policy address announced that <strong>the</strong> average newpublic housing producti<strong>on</strong> would remain at 15,000 units per year and even counting <strong>the</strong> 7,000recovered units from existing public housing estates, <strong>the</strong> supply still lagged far behind <strong>the</strong>surging demand each year. As a result, more low-income families have to wait l<strong>on</strong>ger than <strong>the</strong>target time <str<strong>on</strong>g>of</str<strong>on</strong>g> three years and <strong>the</strong>ir housing woes c<strong>on</strong>tinue to take a toll <strong>on</strong> <strong>the</strong>ir lives.Besides, <strong>the</strong> new flats in urban and extended urban areas are not sufficient to satisfy <strong>the</strong>demand. According to <strong>the</strong> H<strong>on</strong>g K<strong>on</strong>g Housing Authority’s report <strong>on</strong> “Housing <str<strong>on</strong>g>of</str<strong>on</strong>g> Waiting ListApplicants” in November 2012, 15,700 applicants have not yet obtained a first <str<strong>on</strong>g>of</str<strong>on</strong>g>fer after morethan 3 years because 62% are opting for Urban and Extended Urban Districts. This reflects <strong>the</strong>shortage <str<strong>on</strong>g>of</str<strong>on</strong>g> new flats in Urban and Extended Urban Districts.3.2 Inadequate rent allowance under CSSA and narrow coverage <str<strong>on</strong>g>of</str<strong>on</strong>g> housingsubsidy under <strong>the</strong> Community Care FundAs menti<strong>on</strong>ed, rent is rising faster than <strong>the</strong> adjustment <str<strong>on</strong>g>of</str<strong>on</strong>g> rent allowance <str<strong>on</strong>g>of</str<strong>on</strong>g>fered by CSSA.CSSA recipients living in private rental housing need to allocate more income for footing <strong>the</strong>bill. This reflects that <strong>the</strong> current rent allowance under CSSA is inadequate to relieve CSSArecipients <str<strong>on</strong>g>of</str<strong>on</strong>g> housing burden.As for those poor private housing tenants who do not receive CSSA, <strong>the</strong> Government hasintroduced “Subsidy for low-income pers<strong>on</strong>s who are inadequately housed” under <strong>the</strong>Community Care Fund <strong>on</strong> 8 October 2012. It sets aside about $91 milli<strong>on</strong> for <strong>the</strong> programme torelieve poor people’s financial pressure due to housing cost. <str<strong>on</strong>g>The</str<strong>on</strong>g> amount <str<strong>on</strong>g>of</str<strong>on</strong>g> subsidy is $3,000for <strong>on</strong>e-pers<strong>on</strong> households, $6,000 for two-pers<strong>on</strong> households, and a uniform rate <str<strong>on</strong>g>of</str<strong>on</strong>g> $8,000for three-or-more-pers<strong>on</strong> households. <str<strong>on</strong>g>The</str<strong>on</strong>g> programme is expected to benefit over 13,000households (nearly 30,000 pers<strong>on</strong>s).According to 2011 Populati<strong>on</strong> Census, a total <str<strong>on</strong>g>of</str<strong>on</strong>g> 39,228 7 n<strong>on</strong>-CSSA poor households areresiding in private rental flats with unreas<strong>on</strong>ably high rent, but <strong>on</strong>ly 33.1% <str<strong>on</strong>g>of</str<strong>on</strong>g> <strong>the</strong>se householdscan benefit from this programme. In o<strong>the</strong>r words, 26,228 poor tenant households (66.9%) are5Memorandum for <strong>the</strong> Subsidized Housing Committee <str<strong>on</strong>g>of</str<strong>on</strong>g> <strong>the</strong> H<strong>on</strong>g K<strong>on</strong>g Housing Authority, Housing <str<strong>on</strong>g>of</str<strong>on</strong>g> Waiting ListApplicants (November 2012)6Opening speech by STH at <strong>the</strong> Internati<strong>on</strong>al C<strong>on</strong>ference <strong>on</strong> Spatial and Social Transformati<strong>on</strong> in Urban China. 13December 2012. (http://www.thb.gov.hk/eng/psp/speeches/transport/land/2012/20121213.pdf)7<str<strong>on</strong>g>The</str<strong>on</strong>g> figure is <strong>the</strong> difference between <strong>the</strong> total number <str<strong>on</strong>g>of</str<strong>on</strong>g> poor households living in private rental housing (76,866)and <strong>the</strong> number <str<strong>on</strong>g>of</str<strong>on</strong>g> CSSA cases living in private rental housing and receiving rent allowance in 2011/12 (37,638).Census and Statistics Department and Department <str<strong>on</strong>g>of</str<strong>on</strong>g> Welfare.5
left behind without receiving any immediate assistance. Moreover, <strong>the</strong> programme <strong>on</strong>ly <str<strong>on</strong>g>of</str<strong>on</strong>g>fersa <strong>on</strong>e-<str<strong>on</strong>g>of</str<strong>on</strong>g>f subsidy without having any l<strong>on</strong>g-term policy commitments. <str<strong>on</strong>g>The</str<strong>on</strong>g>refore, it cannotrelieve <strong>the</strong> housing burden <str<strong>on</strong>g>of</str<strong>on</strong>g> <strong>the</strong> low-income tenants before <strong>the</strong>y obtain a public housing unit.4. <str<strong>on</strong>g>The</str<strong>on</strong>g> Way Forward - Oxfam’s policy recommendati<strong>on</strong>sAlthough <strong>the</strong> newly released policy address sets out plans to build more public rental flats, <strong>the</strong>number <str<strong>on</strong>g>of</str<strong>on</strong>g> <strong>the</strong>se new public rental flats being completed could rise to 20,000 per year <strong>on</strong>lyfrom 2018. That means, housing needs for poor people cannot be met in <strong>the</strong>se coming fiveyears. Over 110,000 low-income households now <strong>on</strong> <strong>the</strong> waiting list for rental public housingstill have to suffer from high rent and poor living c<strong>on</strong>diti<strong>on</strong>s. In order to relieve <strong>the</strong>ir hardshipimmediately, Oxfam H<strong>on</strong>g K<strong>on</strong>g urges <strong>the</strong> Government to c<strong>on</strong>sider <strong>the</strong> following:4.1 Short-term relief measures:4.1.1 Rental subsidy for n<strong>on</strong>-CSSA tenants <strong>on</strong> <strong>the</strong> waiting list for public housing<str<strong>on</strong>g>The</str<strong>on</strong>g> Government should study how to provide rental subsidy to those n<strong>on</strong>-CSSA tenants whoare <strong>on</strong> <strong>the</strong> waiting list <str<strong>on</strong>g>of</str<strong>on</strong>g> public rental housing but have not received a first <str<strong>on</strong>g>of</str<strong>on</strong>g>fer within threeyears as promised. Our survey showed that <strong>the</strong> average waiting time for <strong>the</strong> first <str<strong>on</strong>g>of</str<strong>on</strong>g>fer was 4.5years (or 54.3 m<strong>on</strong>ths), which implied that an extra 1.5 years had to be spent before <strong>the</strong> first<str<strong>on</strong>g>of</str<strong>on</strong>g>fer took place. In order to lessen <strong>the</strong> burden <str<strong>on</strong>g>of</str<strong>on</strong>g> <strong>the</strong>se tenants who have been wait listingmore than three years, we suggest <strong>the</strong> Government to study <strong>the</strong> opti<strong>on</strong> <str<strong>on</strong>g>of</str<strong>on</strong>g> providing rentalsubsidy for eligible tenants living in private rental housing until <strong>the</strong> Housing Authority issues afirst or a sec<strong>on</strong>d housing <str<strong>on</strong>g>of</str<strong>on</strong>g>fer to <strong>the</strong>m. We believe that this measure will not have much impact<strong>on</strong> <strong>the</strong> rental prices in <strong>the</strong> private market as <strong>the</strong> total number <str<strong>on</strong>g>of</str<strong>on</strong>g> targeted beneficiaries iscomparatively small 8 . Also, it is a <strong>on</strong>ly temporary measure in order to relieve <strong>the</strong> housingburden <str<strong>on</strong>g>of</str<strong>on</strong>g> poor n<strong>on</strong>-CSSA tenants.4.1.2 Explore <strong>the</strong> feasibility <str<strong>on</strong>g>of</str<strong>on</strong>g> building more temporary social housingAccording to government figures 9 , <strong>the</strong>re are 167.7, 384.4 and 465.5 hectares <str<strong>on</strong>g>of</str<strong>on</strong>g> unleased orunallocated government lands which have been designated respectively for“Industrial”, ”Government, Instituti<strong>on</strong> or Community” and “Open Space” uses. We suggest <strong>the</strong>Government to study how <strong>the</strong>se vacant lands (especially those that will not be used for <strong>the</strong>coming five or ten years) can be used to provide temporary social housing with low rents forlow-income private housing tenants who have been waiting for rental public housing over threeyears. By <strong>the</strong> same token, we also suggest <strong>the</strong> Government to explore <strong>the</strong> feasibility <str<strong>on</strong>g>of</str<strong>on</strong>g>c<strong>on</strong>verting those vacant industrial buildings into temporary housing for <strong>the</strong>se households. Thismeasure can reduce <strong>the</strong> housing stress <str<strong>on</strong>g>of</str<strong>on</strong>g> those poor tenants who have been waiting l<strong>on</strong>gerthan <strong>the</strong> target time <str<strong>on</strong>g>of</str<strong>on</strong>g> three years <strong>on</strong> <strong>the</strong> <strong>on</strong>e hand. On <strong>the</strong> o<strong>the</strong>r hand, <strong>the</strong> supply <str<strong>on</strong>g>of</str<strong>on</strong>g>temporary housing may stabilise or even help lower <strong>the</strong> rental prices in <strong>the</strong> private market as aresult <str<strong>on</strong>g>of</str<strong>on</strong>g> <strong>the</strong> increased supply <str<strong>on</strong>g>of</str<strong>on</strong>g> small-sized rental flats.8 According to <strong>the</strong> report “Housing <str<strong>on</strong>g>of</str<strong>on</strong>g> Waiting List Applicants” (Housing Authority, November 2012), a total <str<strong>on</strong>g>of</str<strong>on</strong>g>15,700 households <strong>on</strong> <strong>the</strong> waiting list for rental public housing waited l<strong>on</strong>ger than three years without receiving an<str<strong>on</strong>g>of</str<strong>on</strong>g>fer. It is estimated that <strong>the</strong> number <str<strong>on</strong>g>of</str<strong>on</strong>g> beneficiaries under our proposed rental subsidy scheme for n<strong>on</strong>-CSSAtenants will be less than that number if taking out those <strong>on</strong> CSSA and not living in rental private housing.9 Legislative Council Meeting <strong>on</strong> 17 October 2012 ( Questi<strong>on</strong> 16)http://www.info.gov.hk/gia/general/201210/17/P201210170305.htm6
4.2 L<strong>on</strong>g-term policy4.2.1 Increase <strong>the</strong> supply <str<strong>on</strong>g>of</str<strong>on</strong>g> public rental housingIn <strong>the</strong> l<strong>on</strong>g run, <strong>the</strong> Government should produce sufficient public rental housing so as toensure that applicants <strong>on</strong> <strong>the</strong> waiting list will receive a first <str<strong>on</strong>g>of</str<strong>on</strong>g>fer after waiting for not more thanthree years. Recently, <strong>the</strong> total number <str<strong>on</strong>g>of</str<strong>on</strong>g> ordinary family applicants <strong>on</strong> <strong>the</strong> waiting list hasreached 110,400 (<strong>on</strong> top <str<strong>on</strong>g>of</str<strong>on</strong>g> <strong>the</strong> 100,000 n<strong>on</strong>-elderly singlet<strong>on</strong>s) as at <strong>the</strong> end <str<strong>on</strong>g>of</str<strong>on</strong>g> September,2012. <str<strong>on</strong>g>The</str<strong>on</strong>g> Government should increase <strong>the</strong> producti<strong>on</strong> <str<strong>on</strong>g>of</str<strong>on</strong>g> public rental flats from 15,000 to noless than 35,000 flats per year so as to ensure that applicants do not need to wait more thanthree years for <strong>the</strong>ir unit.According to our survey, a majority <str<strong>on</strong>g>of</str<strong>on</strong>g> tenants <strong>on</strong> <strong>the</strong> waiting list prefer a locati<strong>on</strong> in urbandistrict in <strong>the</strong>ir public housing applicati<strong>on</strong>. Given <strong>the</strong> fact that <strong>the</strong> vacant land for residential useis estimated at 391.5 hectares 10 according to <strong>the</strong> Development Bureau <strong>on</strong> October 2012, <strong>the</strong>Government should study and inform <strong>the</strong> public how much vacant land for residential use isavailable for <strong>the</strong> producti<strong>on</strong> <str<strong>on</strong>g>of</str<strong>on</strong>g> <strong>the</strong> public housing estates, particularly in urban district.Meanwhile, in view <str<strong>on</strong>g>of</str<strong>on</strong>g> <strong>the</strong> expanding number <str<strong>on</strong>g>of</str<strong>on</strong>g> applicants <strong>on</strong> <strong>the</strong> waiting list, we suggest that<strong>the</strong> Government should allocate half <str<strong>on</strong>g>of</str<strong>on</strong>g> all disposable lands for providing public housing flatsso as to maintain a balance between private and public housing markets.4.2.2 Review <strong>the</strong> Maximum Level <str<strong>on</strong>g>of</str<strong>on</strong>g> Rent Allowance (MRA) under <strong>the</strong> CSSA SchemeWe support a fair and adequate rent allowance for CSSA recipients, and suggest <strong>the</strong>Government to take into account <strong>the</strong> rental agreements <str<strong>on</strong>g>of</str<strong>on</strong>g> <strong>the</strong> latest leases for CSSArecipients living in private housing to define <strong>the</strong> maximum level <str<strong>on</strong>g>of</str<strong>on</strong>g> rent allowance as so<strong>on</strong> aspossible. In additi<strong>on</strong>, <strong>the</strong> rate should be adjusted annually according to <strong>the</strong> movement <str<strong>on</strong>g>of</str<strong>on</strong>g> CPI(A) rent index for private housing.10<str<strong>on</strong>g>The</str<strong>on</strong>g> data come from <strong>the</strong> Land Department’s Land Informati<strong>on</strong> System as at June <str<strong>on</strong>g>of</str<strong>on</strong>g> 2012.7
AppendixTable 1: Percentage <str<strong>on</strong>g>of</str<strong>on</strong>g> cases that have a housing <str<strong>on</strong>g>of</str<strong>on</strong>g>ferProcess Total N (%)From registrati<strong>on</strong> <str<strong>on</strong>g>of</str<strong>on</strong>g> WL (blue card) to now 501 (100%)Did not have housing <str<strong>on</strong>g>of</str<strong>on</strong>g>fer 369 (73.7%)Had housing <str<strong>on</strong>g>of</str<strong>on</strong>g>fer 132 (26.3%)Table 2: Average Waiting Time <str<strong>on</strong>g>of</str<strong>on</strong>g> those who DID NOT have a housing <str<strong>on</strong>g>of</str<strong>on</strong>g>ferProcessTotal N (%) Average Waiting Time(those who did not have housing <str<strong>on</strong>g>of</str<strong>on</strong>g>fer)From registrati<strong>on</strong> <str<strong>on</strong>g>of</str<strong>on</strong>g> WL (blue card) to now 369 (100%) 52.6 m<strong>on</strong>ths or 4.4 years<str<strong>on</strong>g>Have</str<strong>on</strong>g>n’t g<strong>on</strong>e through vetting 283 (76.7%)<str<strong>on</strong>g>Have</str<strong>on</strong>g>n g<strong>on</strong>e through vetting 86 (23.3%)Did not revise any informati<strong>on</strong>(excluding <strong>the</strong> change <str<strong>on</strong>g>of</str<strong>on</strong>g> districtopti<strong>on</strong>)200 (54.2%)Revised informati<strong>on</strong> 169 (45.8%)Table 3: Average Waiting Time for those who HAD a housing <str<strong>on</strong>g>of</str<strong>on</strong>g>ferProcessTotal N Average Waiting Time (Valid N)(those who had housing <str<strong>on</strong>g>of</str<strong>on</strong>g>fer)From registrati<strong>on</strong> <str<strong>on</strong>g>of</str<strong>on</strong>g> WL (blue card) to now 132From blue card to FIRST <str<strong>on</strong>g>of</str<strong>on</strong>g>fer 132 54.3 m<strong>on</strong>ths or 4.5 years (125)From FIRST <str<strong>on</strong>g>of</str<strong>on</strong>g>fer to SECOND <str<strong>on</strong>g>of</str<strong>on</strong>g>fer 43 7.4 m<strong>on</strong>ths (37)Table 4: Reas<strong>on</strong>s for rejecting <str<strong>on</strong>g>of</str<strong>on</strong>g>ferReas<strong>on</strong>s for rejecti<strong>on</strong> First Offer (%)Far awayFrom work place 37.8From study place 26.1Estate too far away 47.9Not satisfied with c<strong>on</strong>diti<strong>on</strong> <str<strong>on</strong>g>of</str<strong>on</strong>g> <strong>the</strong> housing unit 22.7Locati<strong>on</strong> (level/directi<strong>on</strong>) not good 19.3Facilities <str<strong>on</strong>g>of</str<strong>on</strong>g> estate not good 5.0Unhappy incidence happened in <strong>the</strong> unit before 12.6O<strong>the</strong>rs 16.88
Chart 1: Household size <str<strong>on</strong>g>of</str<strong>on</strong>g> overcrowded households5-pers<strong>on</strong>, 10.4%4-pers<strong>on</strong>, 48.9%6+ pers<strong>on</strong>, 5.9%3-pers<strong>on</strong>, 24.4%2-pers<strong>on</strong>,10.4%Table 5: Mean increase in rental living areaEffective floor area (sq ft) Mean increase in rent ($) Mean increase in rent (%)< 70 300 1970 – 139 332 13140 – 209 439 15210 – 279 377 12280 – 349 334 9350 - 419 533 13420 and above 854 21Overall 427 14Table 6: <str<strong>on</strong>g>The</str<strong>on</strong>g> average rent per square foot <str<strong>on</strong>g>of</str<strong>on</strong>g> selected large private housing estatesSelected large private housingestates<str<strong>on</strong>g>The</str<strong>on</strong>g> average rent per square footat October 2012 ($)Park Island 20.4Metro Town 21.2Mei Foo Sun Chuen 21.5Sceneway Garden 21.5<str<strong>on</strong>g>The</str<strong>on</strong>g> average rent per square foot in this survey is about $22Source: Ricacorp Properties, October 2012Table 7: Type <str<strong>on</strong>g>of</str<strong>on</strong>g> quarters (%)Type <str<strong>on</strong>g>of</str<strong>on</strong>g> quarters %<str<strong>on</strong>g>Who</str<strong>on</strong>g>le flat 30.7Cubicle/room 11.2Bed space/cockl<str<strong>on</strong>g>of</str<strong>on</strong>g>t 0.8Sub-divided flat 56.3Temporary housing/ro<str<strong>on</strong>g>of</str<strong>on</strong>g>-top flat/cubicle 1.0Total 100.09
Table 8: <str<strong>on</strong>g>C<strong>on</strong>diti<strong>on</strong>s</str<strong>on</strong>g> <str<strong>on</strong>g>of</str<strong>on</strong>g> living unit by problems (%)Type <str<strong>on</strong>g>of</str<strong>on</strong>g> quarters No such With such Serious Not seriousproblem problemWater leakage 50.3 49.7 59.0 17.7Fall <str<strong>on</strong>g>of</str<strong>on</strong>g>f <str<strong>on</strong>g>of</str<strong>on</strong>g> c<strong>on</strong>crete 45.7 54.3 49.3 20.2Exposure <str<strong>on</strong>g>of</str<strong>on</strong>g> steel rope 61.3 38.7 45.9 27.8Mess up <str<strong>on</strong>g>of</str<strong>on</strong>g> electric wire 56.2 43.8 28.8 26.010