Temperature-Pressure Phase Diagram of a D2O-D2 System at ...
Temperature-Pressure Phase Diagram of a D2O-D2 System at ...
Temperature-Pressure Phase Diagram of a D2O-D2 System at ...

You also want an ePaper? Increase the reach of your titles
YUMPU automatically turns print PDFs into web optimized ePapers that Google loves.
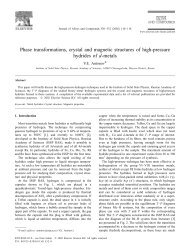
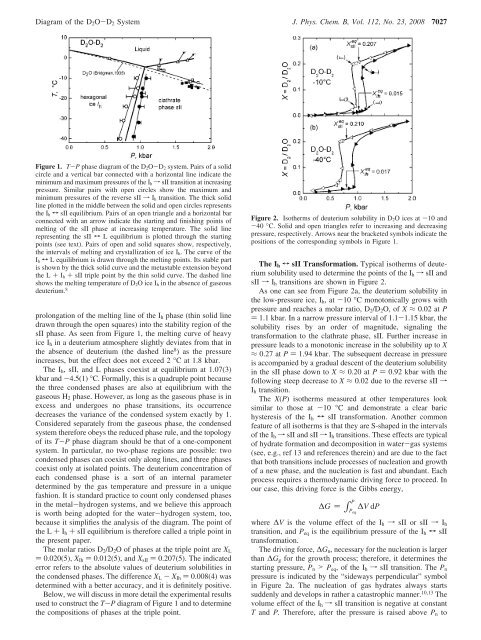
<strong>Diagram</strong> <strong>of</strong> the D 2 O-D 2 <strong>System</strong> J. Phys. Chem. B, Vol. 112, No. 23, 2008 7027Figure 1. T-P phase diagram <strong>of</strong> the D 2O-D 2 system. Pairs <strong>of</strong> a solidcircle and a vertical bar connected with a horizontal line indic<strong>at</strong>e theminimum and maximum pressures <strong>of</strong> the I h f sII transition <strong>at</strong> increasingpressure. Similar pairs with open circles show the maximum andminimum pressures <strong>of</strong> the reverse sII f I h transition. The thick solidline plotted in the middle between the solid and open circles representsthe I h T sII equilibrium. Pairs <strong>of</strong> an open triangle and a horizontal barconnected with an arrow indic<strong>at</strong>e the starting and finishing points <strong>of</strong>melting <strong>of</strong> the sII phase <strong>at</strong> increasing temper<strong>at</strong>ure. The solid linerepresenting the sII T L equilibrium is plotted through the startingpoints (see text). Pairs <strong>of</strong> open and solid squares show, respectively,the intervals <strong>of</strong> melting and crystalliz<strong>at</strong>ion <strong>of</strong> ice I h. The curve <strong>of</strong> theI h T L equilibrium is drawn through the melting points. Its stable partis shown by the thick solid curve and the metastable extension beyondthe L + I h + sII triple point by the thin solid curve. The dashed lineshows the melting temper<strong>at</strong>ure <strong>of</strong> D 2O ice I h in the absence <strong>of</strong> gaseousdeuterium. 8prolong<strong>at</strong>ion <strong>of</strong> the melting line <strong>of</strong> the I h phase (thin solid linedrawn through the open squares) into the stability region <strong>of</strong> thesII phase. As seen from Figure 1, the melting curve <strong>of</strong> heavyice I h in a deuterium <strong>at</strong>mosphere slightly devi<strong>at</strong>es from th<strong>at</strong> inthe absence <strong>of</strong> deuterium (the dashed line 8 ) as the pressureincreases, but the effect does not exceed 2 °C <strong>at</strong> 1.8 kbar.The I h , sII, and L phases coexist <strong>at</strong> equilibrium <strong>at</strong> 1.07(3)kbar and -4.5(1) °C. Formally, this is a quadruple point becausethe three condensed phases are also <strong>at</strong> equilibrium with thegaseous H 2 phase. However, as long as the gaseous phase is inexcess and undergoes no phase transitions, its occurrencedecreases the variance <strong>of</strong> the condensed system exactly by 1.Considered separ<strong>at</strong>ely from the gaseous phase, the condensedsystem therefore obeys the reduced phase rule, and the topology<strong>of</strong> its T-P phase diagram should be th<strong>at</strong> <strong>of</strong> a one-componentsystem. In particular, no two-phase regions are possible: twocondensed phases can coexist only along lines, and three phasescoexist only <strong>at</strong> isol<strong>at</strong>ed points. The deuterium concentr<strong>at</strong>ion <strong>of</strong>each condensed phase is a sort <strong>of</strong> an internal parameterdetermined by the gas temper<strong>at</strong>ure and pressure in a uniquefashion. It is standard practice to count only condensed phasesin the metal-hydrogen systems, and we believe this approachis worth being adopted for the w<strong>at</strong>er-hydrogen system, too,because it simplifies the analysis <strong>of</strong> the diagram. The point <strong>of</strong>the L + I h + sII equilibrium is therefore called a triple point inthe present paper.The molar r<strong>at</strong>ios D 2 /D 2 O <strong>of</strong> phases <strong>at</strong> the triple point are X L) 0.020(5), X Ih ) 0.012(5), and X sII ) 0.207(5). The indic<strong>at</strong>ederror refers to the absolute values <strong>of</strong> deuterium solubilities inthe condensed phases. The difference X L - X Ih ) 0.008(4) wasdetermined with a better accuracy, and it is definitely positive.Below, we will discuss in more detail the experimental resultsused to construct the T-P diagram <strong>of</strong> Figure 1 and to determinethe compositions <strong>of</strong> phases <strong>at</strong> the triple point.Figure 2. Isotherms <strong>of</strong> deuterium solubility in D 2O ices <strong>at</strong> -10 and-40 °C. Solid and open triangles refer to increasing and decreasingpressure, respectively. Arrows near the bracketed symbols indic<strong>at</strong>e thepositions <strong>of</strong> the corresponding symbols in Figure 1.The I h T sII Transform<strong>at</strong>ion. Typical isotherms <strong>of</strong> deuteriumsolubility used to determine the points <strong>of</strong> the I h f sII andsII f I h transitions are shown in Figure 2.As one can see from Figure 2a, the deuterium solubility inthe low-pressure ice, I h ,<strong>at</strong>-10 °C monotonically grows withpressure and reaches a molar r<strong>at</strong>io, D 2 /D 2 O, <strong>of</strong> X ≈ 0.02 <strong>at</strong> P) 1.1 kbar. In a narrow pressure interval <strong>of</strong> 1.1-1.15 kbar, thesolubility rises by an order <strong>of</strong> magnitude, signaling thetransform<strong>at</strong>ion to the cl<strong>at</strong>hr<strong>at</strong>e phase, sII. Further increase inpressure leads to a monotonic increase in the solubility up to X≈ 0.27 <strong>at</strong> P ) 1.94 kbar. The subsequent decrease in pressureis accompanied by a gradual descent <strong>of</strong> the deuterium solubilityin the sII phase down to X ≈ 0.20 <strong>at</strong> P ) 0.92 kbar with thefollowing steep decrease to X ≈ 0.02 due to the reverse sII fI h transition.The X(P) isotherms measured <strong>at</strong> other temper<strong>at</strong>ures looksimilar to those <strong>at</strong> -10 °C and demonstr<strong>at</strong>e a clear barichysteresis <strong>of</strong> the I h T sII transform<strong>at</strong>ion. Another commonfe<strong>at</strong>ure <strong>of</strong> all isotherms is th<strong>at</strong> they are S-shaped in the intervals<strong>of</strong> the I h f sII and sII f I h transitions. These effects are typical<strong>of</strong> hydr<strong>at</strong>e form<strong>at</strong>ion and decomposition in w<strong>at</strong>er-gas systems(see, e.g., ref 13 and references therein) and are due to the factth<strong>at</strong> both transitions include processes <strong>of</strong> nucle<strong>at</strong>ion and growth<strong>of</strong> a new phase, and the nucle<strong>at</strong>ion is fast and abundant. Eachprocess requires a thermodynamic driving force to proceed. Inour case, this driving force is the Gibbs energy,P∆G ) ∫ Peq∆V dPwhere ∆V is the volume effect <strong>of</strong> the I h f sII or sII f I htransition, and P eq is the equilibrium pressure <strong>of</strong> the I h T sIItransform<strong>at</strong>ion.The driving force, ∆G n , necessary for the nucle<strong>at</strong>ion is largerthan ∆G g for the growth process; therefore, it determines thestarting pressure, P n > P eq , <strong>of</strong> the I h f sII transition. The P npressure is indic<strong>at</strong>ed by the “sideways perpendicular” symbolin Figure 2a. The nucle<strong>at</strong>ion <strong>of</strong> gas hydr<strong>at</strong>es always startssuddenly and develops in r<strong>at</strong>her a c<strong>at</strong>astrophic manner. 10,13 Thevolume effect <strong>of</strong> the I h f sII transition is neg<strong>at</strong>ive <strong>at</strong> constantT and P. Therefore, after the pressure is raised above P n to