Temperature-Pressure Phase Diagram of a D2O-D2 System at ...
Temperature-Pressure Phase Diagram of a D2O-D2 System at ...
Temperature-Pressure Phase Diagram of a D2O-D2 System at ...

You also want an ePaper? Increase the reach of your titles
YUMPU automatically turns print PDFs into web optimized ePapers that Google loves.
7026J. Phys. Chem. B 2008, 112, 7026–7031<strong>Temper<strong>at</strong>ure</strong>-<strong>Pressure</strong> <strong>Phase</strong> <strong>Diagram</strong> <strong>of</strong> a D 2 O-D 2 <strong>System</strong> <strong>at</strong> <strong>Pressure</strong>s to 1.8 kbarVadim S. Efimchenko,* ,† Vladimir E. Antonov, † Oleg I. Barkalov, † and Semen N. Klyamkin ‡Institute <strong>of</strong> Solid St<strong>at</strong>e Physics, Russian Academy <strong>of</strong> Sciences, 142432 ChernogoloVka, Moscow District,Russia, and Department <strong>of</strong> Chemistry, Moscow St<strong>at</strong>e UniVersity, 119991 Moscow, RussiaReceiVed: January 17, 2008; In Final Form: March 24, 2008Using a volumetric technique, the deuterium solubility, X, in heavy w<strong>at</strong>er (L), low-pressure hexagonal ice(I h ), and high-pressure cubic cl<strong>at</strong>hr<strong>at</strong>e ice (sII) is studied <strong>at</strong> deuterium pressures up to 1.8 kbar and temper<strong>at</strong>uresfrom -40 to +5 °C. The triple point <strong>of</strong> the L + I h + sII equilibrium is loc<strong>at</strong>ed <strong>at</strong> P ) 1.07(3) kbar andT )-4.5(8)°C. The molar r<strong>at</strong>ios D 2 /D 2 O <strong>of</strong> phases <strong>at</strong> the triple point are X L ) 0.020(5), X Ih ) 0.012(5), andX sII ) 0.207(5).Introduction<strong>Phase</strong> transform<strong>at</strong>ions in the w<strong>at</strong>er-hydrogen system haverecently <strong>at</strong>tracted close <strong>at</strong>tention due to the discovery <strong>of</strong> newhydrogen cl<strong>at</strong>hr<strong>at</strong>e hydr<strong>at</strong>e. 1–3 The cubic unit cell <strong>of</strong> the sIItype2 crystal structure <strong>of</strong> this cl<strong>at</strong>hr<strong>at</strong>e phase is composed <strong>of</strong>136 H 2 O molecules and can accommod<strong>at</strong>e from 27.2 4 to 48 3guest molecules <strong>of</strong> H 2 , which gives a molar r<strong>at</strong>io <strong>of</strong> H 2 /H 2 O )0.200-0.353. The cl<strong>at</strong>hr<strong>at</strong>e with these compositions is formed<strong>at</strong> hydrogen pressures <strong>of</strong> 1-3.6 kbar. 1 If quenched under highpressure, the cl<strong>at</strong>hr<strong>at</strong>e is metastable in vacuum <strong>at</strong> temper<strong>at</strong>uresup to 145 K. 2 The r<strong>at</strong>her high hydrogen capacity makes the sIIcl<strong>at</strong>hr<strong>at</strong>eapromisingcandid<strong>at</strong>eforhydrogenstorageapplic<strong>at</strong>ions. 2,5The cl<strong>at</strong>hr<strong>at</strong>e is <strong>of</strong> significant interest for planetary science andastrophysics because its form<strong>at</strong>ion pressure is low enough tobe reached inside small icy s<strong>at</strong>ellites and because hydrogentrapped in interstellar ices can be in the form <strong>of</strong> this cl<strong>at</strong>hr<strong>at</strong>edue to its thermal stability <strong>at</strong> low pressure. 2Some significant properties <strong>of</strong> the hydrogen cl<strong>at</strong>hr<strong>at</strong>e hydr<strong>at</strong>e,such as the crystal structure, 3 the maximum 3 and minimum 4concentr<strong>at</strong>ions <strong>of</strong> the guest hydrogen molecules, and theform<strong>at</strong>ion kinetics, 3 were studied by neutron diffraction ondeuterium-substituted D 2 O-D 2 samples. At the same time, thetemper<strong>at</strong>ure-pressure (T-P) phase diagram <strong>of</strong> the D 2 O-D 2system has never been examined. In the present paper, weconstruct the lines <strong>of</strong> phase transitions between the liquid phase(L), low-pressure hexagonal ice (I h ), and cl<strong>at</strong>hr<strong>at</strong>e phase (sII)and determine the deuterium content <strong>of</strong> these phases in thevicinity <strong>of</strong> the L-I h -sII triple point in the D 2 O-D 2 systemusing a volumetric technique. The feasibility <strong>of</strong> the obtainedd<strong>at</strong>a was additionally tested and improved by comparing withearlier results for the H 2 O-H 2 system. 4,6Experimental DetailsThe experimental setup is described in ref 7. The measurementswere carried out in an <strong>at</strong>mosphere <strong>of</strong> molecular deuteriumtaken in excess. The D 2 gas with isotopic purity 99.9% wasprepared by thermal decomposition <strong>of</strong> a LaNi 5 -based deuteride.The heavy w<strong>at</strong>er had an <strong>at</strong>omic r<strong>at</strong>io <strong>of</strong> H/D ) 10 -3 .The amount <strong>of</strong> deuterium absorbed by the sample wasdetermined volumetrically from the pressure and temper<strong>at</strong>ure* To whom correspondence should be addressed. E-mail: efimchen@issp.ac.ru.† Institute <strong>of</strong> Solid St<strong>at</strong>e Physics, Russian Academy <strong>of</strong> Sciences.‡Department <strong>of</strong> Chemistry, Moscow St<strong>at</strong>e University.in the calibr<strong>at</strong>ed volume <strong>of</strong> the measuring system. The molarr<strong>at</strong>io X ) D 2 /D 2 O <strong>of</strong> the absorbed deuterium was calcul<strong>at</strong>edwith an accuracy <strong>of</strong> (0.005 by using published d<strong>at</strong>a on thepressure and temper<strong>at</strong>ure dependences <strong>of</strong> the molar volumes<strong>of</strong> deuterium-substituted liquid w<strong>at</strong>er and ice, I h , 8 the sII phase 2–4and gaseous deuterium. 9 The solubility <strong>of</strong> w<strong>at</strong>er in gaseoushydrogen was earlier shown to be vanishingly small <strong>at</strong> 27 °Cand pressures up to 6 kbar, 10 so we neglected the solubility <strong>of</strong>heavy w<strong>at</strong>er in the deuterium gas in our experiments <strong>at</strong> pressuresup to 1.8 kbar. The deuterium dissolved in heavy w<strong>at</strong>er and iceI h was assumed to increase their molar volumes by the samevalue <strong>of</strong> ∂V/∂X ) 7.95 cm 3 /mol as hydrogen dissolved in liquidH 2 O. The adopted ∂V/∂X value is the average <strong>of</strong> experimentalresults <strong>of</strong> refs 11 and 12.Each studied sample <strong>of</strong> D 2 O weighing ∼1.5 g was frozenand powdered in an ag<strong>at</strong>e mortar under liquid nitrogen prior tothe high-pressure experiment to speed up the kinetics <strong>of</strong>deuterium absorption and desorption. Changing the temper<strong>at</strong>ureor the total hydrogen amount in the autoclave led to a temporaldrift <strong>of</strong> the pressure. The drift lasted ∼5-3 min in the absence<strong>of</strong> phase transitions; ∼1 h in the course <strong>of</strong> the I h f sII and sIIf I h transitions; ∼5 min when the I h phase was melted orcrystallized; ∼5 min when the sII phase was crystallized, and∼20 min when it was melted. While constructing isotherms orisochors, the closed autoclave was held <strong>at</strong> every point <strong>at</strong> fixedtemper<strong>at</strong>ure until the pressure stopped changing. The pressurewas measured accur<strong>at</strong>ely to (3 bar. The temper<strong>at</strong>ure wasdetermined with an accuracy <strong>of</strong> (0.1 °C and could be keptconstant within (0.3 °C.Results and DiscussionThe constructed T-P diagram <strong>of</strong> phase equilibria in theD 2 O-D 2 system is shown as thick solid lines in Figure 1. Thelines <strong>of</strong> the I h T L and sII T L equilibria are drawn throughthe experimental melting points <strong>of</strong> the I h and sII phase,correspondingly, because the equilibrium line is always muchcloser to the melting curve than to the curve <strong>of</strong> crystalliz<strong>at</strong>ion.The line <strong>of</strong> the I h T sII equilibrium is plotted in the middlebetween the points <strong>of</strong> form<strong>at</strong>ion (solid circles) and decomposition(open circles) <strong>of</strong> the sII phase.The L f sII transition th<strong>at</strong> occurred on cooling the liquid(solid squares in Figure 1) was incomplete, and the sampleswere composed <strong>of</strong> mixture <strong>of</strong> the I h and sII phases. Furtherhe<strong>at</strong>ing <strong>of</strong> these samples allowed construction <strong>of</strong> a metastable10.1021/jp800487y CCC: $40.75 © 2008 American Chemical SocietyPublished on Web 05/14/2008
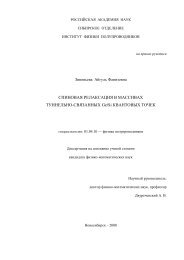
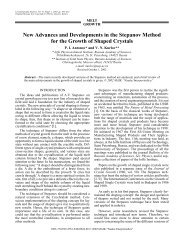
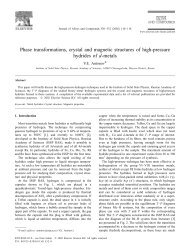
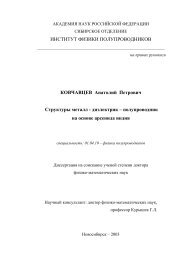
<strong>Diagram</strong> <strong>of</strong> the D 2 O-D 2 <strong>System</strong> J. Phys. Chem. B, Vol. 112, No. 23, 2008 7027Figure 1. T-P phase diagram <strong>of</strong> the D 2O-D 2 system. Pairs <strong>of</strong> a solidcircle and a vertical bar connected with a horizontal line indic<strong>at</strong>e theminimum and maximum pressures <strong>of</strong> the I h f sII transition <strong>at</strong> increasingpressure. Similar pairs with open circles show the maximum andminimum pressures <strong>of</strong> the reverse sII f I h transition. The thick solidline plotted in the middle between the solid and open circles representsthe I h T sII equilibrium. Pairs <strong>of</strong> an open triangle and a horizontal barconnected with an arrow indic<strong>at</strong>e the starting and finishing points <strong>of</strong>melting <strong>of</strong> the sII phase <strong>at</strong> increasing temper<strong>at</strong>ure. The solid linerepresenting the sII T L equilibrium is plotted through the startingpoints (see text). Pairs <strong>of</strong> open and solid squares show, respectively,the intervals <strong>of</strong> melting and crystalliz<strong>at</strong>ion <strong>of</strong> ice I h. The curve <strong>of</strong> theI h T L equilibrium is drawn through the melting points. Its stable partis shown by the thick solid curve and the metastable extension beyondthe L + I h + sII triple point by the thin solid curve. The dashed lineshows the melting temper<strong>at</strong>ure <strong>of</strong> D 2O ice I h in the absence <strong>of</strong> gaseousdeuterium. 8prolong<strong>at</strong>ion <strong>of</strong> the melting line <strong>of</strong> the I h phase (thin solid linedrawn through the open squares) into the stability region <strong>of</strong> thesII phase. As seen from Figure 1, the melting curve <strong>of</strong> heavyice I h in a deuterium <strong>at</strong>mosphere slightly devi<strong>at</strong>es from th<strong>at</strong> inthe absence <strong>of</strong> deuterium (the dashed line 8 ) as the pressureincreases, but the effect does not exceed 2 °C <strong>at</strong> 1.8 kbar.The I h , sII, and L phases coexist <strong>at</strong> equilibrium <strong>at</strong> 1.07(3)kbar and -4.5(1) °C. Formally, this is a quadruple point becausethe three condensed phases are also <strong>at</strong> equilibrium with thegaseous H 2 phase. However, as long as the gaseous phase is inexcess and undergoes no phase transitions, its occurrencedecreases the variance <strong>of</strong> the condensed system exactly by 1.Considered separ<strong>at</strong>ely from the gaseous phase, the condensedsystem therefore obeys the reduced phase rule, and the topology<strong>of</strong> its T-P phase diagram should be th<strong>at</strong> <strong>of</strong> a one-componentsystem. In particular, no two-phase regions are possible: twocondensed phases can coexist only along lines, and three phasescoexist only <strong>at</strong> isol<strong>at</strong>ed points. The deuterium concentr<strong>at</strong>ion <strong>of</strong>each condensed phase is a sort <strong>of</strong> an internal parameterdetermined by the gas temper<strong>at</strong>ure and pressure in a uniquefashion. It is standard practice to count only condensed phasesin the metal-hydrogen systems, and we believe this approachis worth being adopted for the w<strong>at</strong>er-hydrogen system, too,because it simplifies the analysis <strong>of</strong> the diagram. The point <strong>of</strong>the L + I h + sII equilibrium is therefore called a triple point inthe present paper.The molar r<strong>at</strong>ios D 2 /D 2 O <strong>of</strong> phases <strong>at</strong> the triple point are X L) 0.020(5), X Ih ) 0.012(5), and X sII ) 0.207(5). The indic<strong>at</strong>ederror refers to the absolute values <strong>of</strong> deuterium solubilities inthe condensed phases. The difference X L - X Ih ) 0.008(4) wasdetermined with a better accuracy, and it is definitely positive.Below, we will discuss in more detail the experimental resultsused to construct the T-P diagram <strong>of</strong> Figure 1 and to determinethe compositions <strong>of</strong> phases <strong>at</strong> the triple point.Figure 2. Isotherms <strong>of</strong> deuterium solubility in D 2O ices <strong>at</strong> -10 and-40 °C. Solid and open triangles refer to increasing and decreasingpressure, respectively. Arrows near the bracketed symbols indic<strong>at</strong>e thepositions <strong>of</strong> the corresponding symbols in Figure 1.The I h T sII Transform<strong>at</strong>ion. Typical isotherms <strong>of</strong> deuteriumsolubility used to determine the points <strong>of</strong> the I h f sII andsII f I h transitions are shown in Figure 2.As one can see from Figure 2a, the deuterium solubility inthe low-pressure ice, I h ,<strong>at</strong>-10 °C monotonically grows withpressure and reaches a molar r<strong>at</strong>io, D 2 /D 2 O, <strong>of</strong> X ≈ 0.02 <strong>at</strong> P) 1.1 kbar. In a narrow pressure interval <strong>of</strong> 1.1-1.15 kbar, thesolubility rises by an order <strong>of</strong> magnitude, signaling thetransform<strong>at</strong>ion to the cl<strong>at</strong>hr<strong>at</strong>e phase, sII. Further increase inpressure leads to a monotonic increase in the solubility up to X≈ 0.27 <strong>at</strong> P ) 1.94 kbar. The subsequent decrease in pressureis accompanied by a gradual descent <strong>of</strong> the deuterium solubilityin the sII phase down to X ≈ 0.20 <strong>at</strong> P ) 0.92 kbar with thefollowing steep decrease to X ≈ 0.02 due to the reverse sII fI h transition.The X(P) isotherms measured <strong>at</strong> other temper<strong>at</strong>ures looksimilar to those <strong>at</strong> -10 °C and demonstr<strong>at</strong>e a clear barichysteresis <strong>of</strong> the I h T sII transform<strong>at</strong>ion. Another commonfe<strong>at</strong>ure <strong>of</strong> all isotherms is th<strong>at</strong> they are S-shaped in the intervals<strong>of</strong> the I h f sII and sII f I h transitions. These effects are typical<strong>of</strong> hydr<strong>at</strong>e form<strong>at</strong>ion and decomposition in w<strong>at</strong>er-gas systems(see, e.g., ref 13 and references therein) and are due to the factth<strong>at</strong> both transitions include processes <strong>of</strong> nucle<strong>at</strong>ion and growth<strong>of</strong> a new phase, and the nucle<strong>at</strong>ion is fast and abundant. Eachprocess requires a thermodynamic driving force to proceed. Inour case, this driving force is the Gibbs energy,P∆G ) ∫ Peq∆V dPwhere ∆V is the volume effect <strong>of</strong> the I h f sII or sII f I htransition, and P eq is the equilibrium pressure <strong>of</strong> the I h T sIItransform<strong>at</strong>ion.The driving force, ∆G n , necessary for the nucle<strong>at</strong>ion is largerthan ∆G g for the growth process; therefore, it determines thestarting pressure, P n > P eq , <strong>of</strong> the I h f sII transition. The P npressure is indic<strong>at</strong>ed by the “sideways perpendicular” symbolin Figure 2a. The nucle<strong>at</strong>ion <strong>of</strong> gas hydr<strong>at</strong>es always startssuddenly and develops in r<strong>at</strong>her a c<strong>at</strong>astrophic manner. 10,13 Thevolume effect <strong>of</strong> the I h f sII transition is neg<strong>at</strong>ive <strong>at</strong> constantT and P. Therefore, after the pressure is raised above P n to
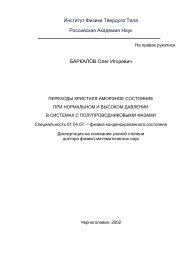
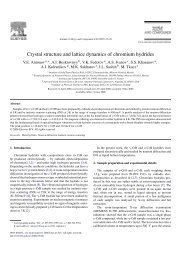
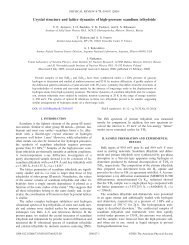
7028 J. Phys. Chem. B, Vol. 112, No. 23, 2008 Efimchenko et al.Figure 3. Vari<strong>at</strong>ion <strong>of</strong> pressure, P, in the closed autoclave th<strong>at</strong> washe<strong>at</strong>ed and cooled in the succession <strong>of</strong> 1 to 4. The arrows show thetransition points indic<strong>at</strong>ed in Figure 1.initi<strong>at</strong>e the I h f sII transition and we fix the volume <strong>of</strong> thesystem, the pressure suddenly begins decreasing. The form<strong>at</strong>ion<strong>of</strong> new stable nuclei <strong>of</strong> the sII phase stops when the pressuredecreases to P n , and the growth <strong>of</strong> the existing nuclei also stopswhen the pressure drops below P g . To further increase the degree<strong>of</strong> the I h f sII conversion, the pressure should be raised again,but not necessarily above P n , as the transition could proceedvia the growth <strong>of</strong> the existing numerous nuclei <strong>of</strong> the sII phasealone, without the cre<strong>at</strong>ion <strong>of</strong> new nuclei. The process stopsagain, when the pressure decreases to P g , and the cycle shouldbe repe<strong>at</strong>ed until most ice I h transforms to the cl<strong>at</strong>hr<strong>at</strong>e phase.The P g pressure could noticeably decrease in every cycle dueto the increasing size <strong>of</strong> the growing sII particles and theconcomitant decrease in the contribution <strong>of</strong> their surface energyto the energy balance. To better localize the equilibrium pressurein the T-P diagram <strong>of</strong> Figure 1, we considered the minimumP g pressure <strong>of</strong> the resulting S-shaped X(P) dependence (solidcircle in Figure 2a) as the pressure <strong>of</strong> the I h f sII transition.In the course <strong>of</strong> the reverse sII f I h transition, we had P n
<strong>Diagram</strong> <strong>of</strong> the D 2 O-D 2 <strong>System</strong> J. Phys. Chem. B, Vol. 112, No. 23, 2008 7029could not begin <strong>at</strong> a temper<strong>at</strong>ure below the equilibrium one, itsstarting point should have been most close to the equilibriumconditions. In Figure 1, the sII T L equilibrium is presentedby the thick solid line drawn through the starting points <strong>of</strong> thesII f L transitions.The lines <strong>of</strong> the I h T sII and I h T L equilibria in the T-Pdiagram <strong>of</strong> the D 2 O-D 2 system are determined more accur<strong>at</strong>elyand intersect <strong>at</strong> P ) 1.07(3) kbar and T )-4.5(8) °C. As seenfrom Figure 1, the sII T L equilibrium line passes through thistriple point, too, and has a slope <strong>of</strong> 6.0(3) K/kbar. The slope <strong>of</strong>the I h T L line near the triple point is -7.8(2) K/kbar.The Deuterium Content <strong>of</strong> the sII, I h , and L <strong>Phase</strong>s.Turning back to Figure 2, one can see th<strong>at</strong> the deuteriumconcentr<strong>at</strong>ion <strong>of</strong> the D 2 O-D 2 samples did not change fullyreversibly with increasing and decreasing pressure in the range<strong>of</strong> stability <strong>of</strong> the sII phase. The reason was obviously th<strong>at</strong>the form<strong>at</strong>ion <strong>of</strong> the sII phase remained incomplete, even <strong>at</strong>the maximum pressure <strong>of</strong> ∼1.9 kbar. Earlier, 5 aD 2 O-D 2 sample<strong>of</strong> the sII phase prepared under a deuterium pressure <strong>of</strong> 1.7 kbarand temper<strong>at</strong>ure -20 °C in the same manner as the samples inthe present work was examined by neutron diffraction andshown to contain ∼1% unreacted ice I h . Most likely, our samplesloaded with deuterium <strong>at</strong> 1.9 kbar while constructing theisotherms <strong>at</strong> increasing pressure contained a similar amount <strong>of</strong>ice I h . Each isotherm measured <strong>at</strong> the pressure decreasing from1.9 kbar to the point <strong>of</strong> the sII f I h transition could thereforegive the deuterium content <strong>of</strong> the sII phase underestim<strong>at</strong>ed by∼1%. We neglected this possible system<strong>at</strong>ic error because theabsolute accuracy <strong>of</strong> the measurement was ∼2%.The concentr<strong>at</strong>ions X eq sII and X eq Ih <strong>of</strong> the sII and I h phases alongthe equilibrium line, P eq (T), <strong>of</strong> the I h T sII transform<strong>at</strong>ion (thick,solid line in Figure 1) were determined as the X(P eq ) values inthe isotherms measured <strong>at</strong> decreasing and increasing pressure,respectively (see Figure 2). Within the experimental error,neither concentr<strong>at</strong>ion changed in the studied temper<strong>at</strong>ure interval-40 to -10 °C, and their mean values were X eq sII ) 0.207(5)and X eq Ih ) 0.015(5). One should expect th<strong>at</strong> these concentr<strong>at</strong>ionswere the same <strong>at</strong> the L + I h + sII triple point loc<strong>at</strong>ed nearby <strong>at</strong>-4.5 °C. The deuterium concentr<strong>at</strong>ion, X L ) 0.025(8), <strong>of</strong> theliquid near the triple point was determined less accur<strong>at</strong>ely inan individual experiment. The difference X L - X Ih ) 0.008(4)also determined in this experiment is consistent with theestim<strong>at</strong>ed value <strong>of</strong> X Ih ) 0.015(5).The triple point is traditionally an object for testing theintegrity and consistency <strong>of</strong> experimental d<strong>at</strong>a because a number<strong>of</strong> different conditions must be met simultaneously <strong>at</strong> the triplepoints. Namely, the independently determined equilibrium lines<strong>of</strong> three transform<strong>at</strong>ions must pass through a common point,which is s<strong>at</strong>isfied in our case. The three independently determinedchanges in volume, ∆V i , accompanying these transform<strong>at</strong>ionsmust answer the additive rel<strong>at</strong>ion, which is also s<strong>at</strong>isfiedbecause we directly measured the volumes <strong>of</strong> each <strong>of</strong> the threeequilibrium st<strong>at</strong>es <strong>of</strong> the system. Finally, the three changes inentropy, ∆S i , must answer the additive rel<strong>at</strong>ion, too, and thisconnects ∆V i and the slopes (dT/dP) i <strong>of</strong> the transform<strong>at</strong>ion linesvia Clapeyron’s equ<strong>at</strong>ion so th<strong>at</strong>∑ ∆S i ) ∑ (dT ⁄dP) i ⁄ ∆V i ) 0 (1)We used eq 1 to independently estim<strong>at</strong>e the X Ih and X L values<strong>at</strong> the triple point <strong>of</strong> the D 2 O-D 2 system, assuming th<strong>at</strong> X Ih /X L) 0.64. This r<strong>at</strong>io was experimentally determined for the I h andL phases in the H 2 O-H 2 system <strong>at</strong> 0.3 kbar and 0 °C. 16 It agreeswith a value <strong>of</strong> X Ih /X L ) 0.011/0.017 ≈ 0.6 <strong>at</strong> the triple point(1.07 kbar, -10 °C) <strong>of</strong> the H 2 O-H 2 system 4 and is likely toFigure 4. T-P diagram <strong>of</strong> phase equilibria in the D 2O-D 2 system(solid lines) and H 2O-H 2 system (dashed lines, results <strong>of</strong> ref 4). Closedand open circles show the points <strong>of</strong> the I h f sII and sII f I h phasetransitions, respectively, in the H 2O-H 2 system. 4 The I h T sIIequilibrium line in the H 2O-H 2 system is plotted with the same slope,dT/dP ) 128 K/kbar, as in the D 2O-D 2 system.hold for the I h and L phases in the D 2 O-D 2 system, too, undersimilar conditions. Using X Ih ) 0.64X L and solving eq 1 for X Lwith all other parameters taken from experiment gives X calc Ih )0.012 and X calc L ) 0.020 for the L + I h + sII triple point <strong>of</strong>D 2 O-D 2 . These values agree with the experimental X Ih )0.015(5) and X L ) 0.025(8). Moreover, we consider thecalcul<strong>at</strong>ed values more reliable and accur<strong>at</strong>e because they arefully consistent with the whole set <strong>of</strong> other parameters characterizingthe D 2 O-D 2 phases <strong>at</strong> the triple point.We also used eq 1 to slightly reduce the uncertainty in theparameters <strong>of</strong> the triple point in the H 2 O-H 2 system examinedearlier. 4The points <strong>of</strong> the I h f sII and sII f I h transitions in theH 2 O-H 2 system (Figure 4) show a larger sc<strong>at</strong>ter and hysteresisthan in the D 2 O-D 2 system (Figure 1), which makes the slope<strong>of</strong> the I h T sII equilibrium line less definite. Assuming th<strong>at</strong> theslope <strong>of</strong> this line is the same as in the D 2 O-D 2 system andsolving eq 1 for X sII with all other parameters taken fromexperiment gives X calc sII ) 0.207 <strong>at</strong> the triple point <strong>of</strong> H 2 O-H 2 .The calcul<strong>at</strong>ed value agrees with X sII ) 0.212(9) measured inref 4 and coincides with the experimental value <strong>of</strong> X sII )0.207(5) <strong>at</strong> the triple point <strong>of</strong> the D 2 O-D 2 system determinedin the present paper. Similar compositions <strong>of</strong> phases <strong>at</strong> the triplepoints <strong>of</strong> the H 2 O-H 2 and D 2 O-D 2 systems are very likely,so the calcul<strong>at</strong>ion corrobor<strong>at</strong>es the assumption th<strong>at</strong> the slopes<strong>of</strong> the I h T sII equilibrium lines in these systems are similar,too.The most feasible values <strong>of</strong> thermodynamic parameters <strong>of</strong>the phases and phase transform<strong>at</strong>ions near the triple points inthe D 2 O-D 2 and H 2 O-H 2 systems are collected in Tables 1and 2. The third column <strong>of</strong> Table 1 presents the total change involume (∆V) accompanying the phase transition. This volumechange can be written as the sum ∆V ) ∆V cond + ∆V gas <strong>of</strong>volume changes <strong>of</strong> the condensed phases (last column <strong>of</strong> Table1) and the gaseous phase.Thermal and Concentr<strong>at</strong>ion Stability <strong>of</strong> the sII <strong>Phase</strong>. Inthe cubic unit cell <strong>of</strong> the sII phase formed by 136 D 2 Omolecules, there are two types <strong>of</strong> cages accessible to guestmolecules: 8 “large” and 16 “small” ones. The in situ neutrondiffraction investig<strong>at</strong>ion 3 showed th<strong>at</strong> the large and small cagescan accommod<strong>at</strong>e up to four and one D 2 molecule, respectively,which corresponds to X max sII ) 48/136 ≈ 0.353. The deuteriumcontent <strong>of</strong> the sII phase and the occupancies <strong>of</strong> cages <strong>of</strong> bothtypes vary with pressure and temper<strong>at</strong>ure. The distribution <strong>of</strong>