The Role of the Bovine Growth Hormone Receptor and ... - Genetics
The Role of the Bovine Growth Hormone Receptor and ... - Genetics
The Role of the Bovine Growth Hormone Receptor and ... - Genetics

Create successful ePaper yourself
Turn your PDF publications into a flip-book with our unique Google optimized e-Paper software.
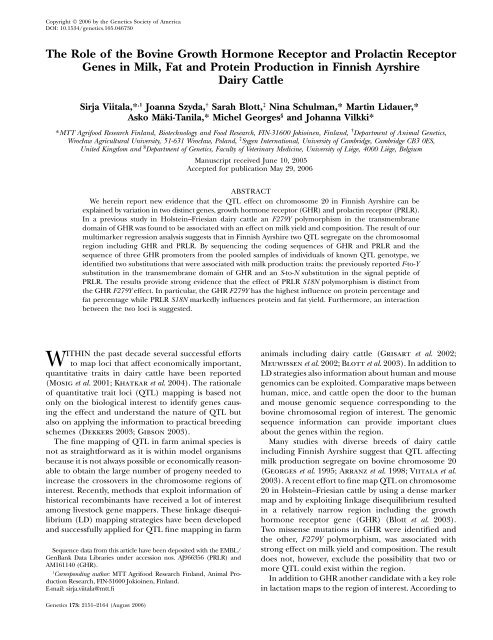
Copyright Ó 2006 by <strong>the</strong> <strong>Genetics</strong> Society <strong>of</strong> AmericaDOI: 10.1534/genetics.105.046730<strong>The</strong> <strong>Role</strong> <strong>of</strong> <strong>the</strong> <strong>Bovine</strong> <strong>Growth</strong> <strong>Hormone</strong> <strong>Receptor</strong> <strong>and</strong> Prolactin <strong>Receptor</strong>Genes in Milk, Fat <strong>and</strong> Protein Production in Finnish AyrshireDairy CattleSirja Viitala,* ,1 Joanna Szyda, † Sarah Blott, ‡ Nina Schulman,* Martin Lidauer,*Asko Mäki-Tanila,* Michel Georges § <strong>and</strong> Johanna Vilkki**MTT Agrifood Research Finl<strong>and</strong>, Biotechnology <strong>and</strong> Food Research, FIN-31600 Jokioinen, Finl<strong>and</strong>, † Department <strong>of</strong> Animal <strong>Genetics</strong>,Wroc1aw Agricultural University, 51-631 Wroc1aw, Pol<strong>and</strong>, ‡ Sygen International, University <strong>of</strong> Cambridge, Cambridge CB3 0ES,United Kingdom <strong>and</strong> § Department <strong>of</strong> <strong>Genetics</strong>, Faculty <strong>of</strong> Veterinary Medicine, University <strong>of</strong> Liège, 4000 Liège, BelgiumManuscript received June 10, 2005Accepted for publication May 29, 2006ABSTRACTWe herein report new evidence that <strong>the</strong> QTL effect on chromosome 20 in Finnish Ayrshire can beexplained by variation in two distinct genes, growth hormone receptor (GHR) <strong>and</strong> prolactin receptor (PRLR).In a previous study in Holstein–Friesian dairy cattle an F279Y polymorphism in <strong>the</strong> transmembranedomain <strong>of</strong> GHR was found to be associated with an effect on milk yield <strong>and</strong> composition. <strong>The</strong> result <strong>of</strong> ourmultimarker regression analysis suggests that in Finnish Ayrshire two QTL segregate on <strong>the</strong> chromosomalregion including GHR <strong>and</strong> PRLR. By sequencing <strong>the</strong> coding sequences <strong>of</strong> GHR <strong>and</strong> PRLR <strong>and</strong> <strong>the</strong>sequence <strong>of</strong> three GHR promoters from <strong>the</strong> pooled samples <strong>of</strong> individuals <strong>of</strong> known QTL genotype, weidentified two substitutions that were associated with milk production traits: <strong>the</strong> previously reported F-to-Ysubstitution in <strong>the</strong> transmembrane domain <strong>of</strong> GHR <strong>and</strong> an S-to-N substitution in <strong>the</strong> signal peptide <strong>of</strong>PRLR. <strong>The</strong> results provide strong evidence that <strong>the</strong> effect <strong>of</strong> PRLR S18N polymorphism is distinct from<strong>the</strong> GHR F279Y effect. In particular, <strong>the</strong> GHR F279Y has <strong>the</strong> highest influence on protein percentage <strong>and</strong>fat percentage while PRLR S18N markedly influences protein <strong>and</strong> fat yield. Fur<strong>the</strong>rmore, an interactionbetween <strong>the</strong> two loci is suggested.WITHIN <strong>the</strong> past decade several successful effortsto map loci that affect economically important,quantitative traits in dairy cattle have been reported(Mosig et al. 2001; Khatkar et al. 2004). <strong>The</strong> rationale<strong>of</strong> quantitative trait loci (QTL) mapping is based notonly on <strong>the</strong> biological interest to identify genes causing<strong>the</strong> effect <strong>and</strong> underst<strong>and</strong> <strong>the</strong> nature <strong>of</strong> QTL butalso on applying <strong>the</strong> information to practical breedingschemes (Dekkers 2003; Gibson 2003).<strong>The</strong> fine mapping <strong>of</strong> QTL in farm animal species isnot as straightforward as it is within model organismsbecause it is not always possible or economically reasonableto obtain <strong>the</strong> large number <strong>of</strong> progeny needed toincrease <strong>the</strong> crossovers in <strong>the</strong> chromosome regions <strong>of</strong>interest. Recently, methods that exploit information <strong>of</strong>historical recombinants have received a lot <strong>of</strong> interestamong livestock gene mappers. <strong>The</strong>se linkage disequilibrium(LD) mapping strategies have been developed<strong>and</strong> successfully applied for QTL fine mapping in farmSequence data from this article have been deposited with <strong>the</strong> EMBL/GenBank Data Libraries under accession nos. AJ966356 (PRLR) <strong>and</strong>AM161140 (GHR).1Corresponding author: MTT Agrifood Research Finl<strong>and</strong>, Animal ProductionResearch, FIN-31600 Jokioinen, Finl<strong>and</strong>.E-mail: sirja.viitala@mtt.fianimals including dairy cattle (Grisart et al. 2002;Meuwissen et al. 2002; Blott et al. 2003). In addition toLD strategies also information about human <strong>and</strong> mousegenomics can be exploited. Comparative maps betweenhuman, mice, <strong>and</strong> cattle open <strong>the</strong> door to <strong>the</strong> human<strong>and</strong> mouse genomic sequence corresponding to <strong>the</strong>bovine chromosomal region <strong>of</strong> interest. <strong>The</strong> genomicsequence information can provide important cluesabout <strong>the</strong> genes within <strong>the</strong> region.Many studies with diverse breeds <strong>of</strong> dairy cattleincluding Finnish Ayrshire suggest that QTL affectingmilk production segregate on bovine chromosome 20(Georges et al. 1995; Arranz et al. 1998; Viitala et al.2003). A recent effort to fine map QTL on chromosome20 in Holstein–Friesian cattle by using a dense markermap <strong>and</strong> by exploiting linkage disequilibrium resultedin a relatively narrow region including <strong>the</strong> growthhormone receptor gene (GHR) (Blott et al. 2003).Two missense mutations in GHR were identified <strong>and</strong><strong>the</strong> o<strong>the</strong>r, F279Y polymorphism, was associated withstrong effect on milk yield <strong>and</strong> composition. <strong>The</strong> resultdoes not, however, exclude <strong>the</strong> possibility that two ormore QTL could exist within <strong>the</strong> region.In addition to GHR ano<strong>the</strong>r c<strong>and</strong>idate with a key rolein lactation maps to <strong>the</strong> region <strong>of</strong> interest. According to<strong>Genetics</strong> 173: 2151–2164 (August 2006)
2152 S. Viitala et al.<strong>the</strong> human <strong>and</strong> mouse genomic sequences, <strong>the</strong> receptorfor prolactin hormone (prolactin receptor, PRLR) locates7 Mb from <strong>the</strong> GHR. Both growth hormonereceptor <strong>and</strong> prolactin receptor have a major role in <strong>the</strong>regulation <strong>of</strong> growth hormone <strong>and</strong> prolactin action in<strong>the</strong> mammary gl<strong>and</strong> as well as in a variety <strong>of</strong> tissues <strong>and</strong>are thus potential c<strong>and</strong>idate genes that could be responsiblefor QTL effects observed in chromosome 20.In this study we have searched for variation in bothc<strong>and</strong>idate genes that could explain <strong>the</strong> observed effect(s)in chromosome 20. We show that variation in both GHR<strong>and</strong> PRLR is significantly associated with milk content<strong>and</strong> yield in Finnish Ayrshire dairy cattle.MATERIALS AND METHODSFamily structure <strong>and</strong> recorded traits: In this study twoindependently ascertained data sets were used. Data set I is anextension <strong>of</strong> <strong>the</strong> family data used in <strong>the</strong> genome scan <strong>of</strong>Finnish Ayrshire (Viitala et al. 2003). <strong>The</strong> data include 23half-sib families containing a total <strong>of</strong> 810 progeny-tested AIbulls from Finnish Ayrshire cattle born between 1980 <strong>and</strong>1995. Data set I was used both in QTL mapping <strong>and</strong> in <strong>the</strong>association study. Data set II includes 718 progeny-testedFinnish Ayrshire bulls born between 1971 <strong>and</strong> 2001. <strong>The</strong>sedata were used to estimate <strong>the</strong> effect <strong>of</strong> GHR <strong>and</strong> PRLR polymorphismson milk yield <strong>and</strong> composition in an independentsample from <strong>the</strong> Finnish Ayrshire population.<strong>The</strong> milk production traits representing both first <strong>and</strong> laterlactations are milk yield (MY 1st ,MY later ), fat yield (FY 1st ,FY later ),protein yield (PY 1st ,PY later ), fat content (F% 1st ,F% later ), <strong>and</strong>protein content (P% 1st ,P% later ). Bulls’ phenotypes are representedby daughter yield deviations (DYDs) originating from<strong>the</strong> <strong>of</strong>ficial 2002 (data set I) <strong>and</strong> 2005 (data set II) geneticevaluations based on a r<strong>and</strong>om regression test day model(Lidauer et al. 2000). <strong>The</strong> corresponding effective number <strong>of</strong>daughters varied among bulls from 5 to 7631 for MY, to 6792for FY <strong>and</strong> F%, to 7021 for PY <strong>and</strong> P% in 2002 data <strong>and</strong>,respectively, in 2005 data from 5 to 9252 for MY, to 7551 for FY<strong>and</strong> F%, to 8163 for PY <strong>and</strong> P%.Screening <strong>the</strong> c<strong>and</strong>idate genes for variation: <strong>The</strong> codingsequence <strong>of</strong> two c<strong>and</strong>idate genes was sequenced from genomicDNA. To obtain flanking intronic sequences for eachexon, a bovine genomic BAC library was screened with oligonucleotideprobes representing <strong>the</strong> c<strong>and</strong>idate genes. <strong>The</strong> informationabout <strong>the</strong> intronic sequence allowed us to sequenceentire coding sequences from Ayrshire samples. To obtain <strong>the</strong>corresponding BAC clones a gridded bovine genomic BAClibrary (Warren et al. 2000) was screened with 32 P-labeledoligo probes. Positive clones were identified <strong>and</strong> <strong>the</strong> selectedclones were transferred from library plates to LB agar(chloramphenicol 12 mg/ml). DNA was extracted from BACculture with a QIAGEN (West Sussex, UK) Midiprep kit. <strong>The</strong>primers for BAC clone sequencing were designed according toprediction <strong>of</strong> exon/intron boundaries between species.A set <strong>of</strong> pooled DNA samples from <strong>the</strong> two families (family5 <strong>and</strong> family 12) originally segregating for <strong>the</strong> QTL at a 5%significance level (Viitala et al. 2003) was used to scan for anysequence variation. <strong>The</strong> pooling was done because <strong>the</strong> siresamples were not available <strong>and</strong> also to keep <strong>the</strong> sequencingexpenses low. Pools were prepared by extracting DNA fromsperm samples (Zadworny <strong>and</strong> Kuhnlein 1990) <strong>and</strong> bypooling <strong>the</strong>se samples after concentration measurement (10individuals per pool, 2 pools per family).<strong>The</strong> primers for exon amplification <strong>and</strong> sequencing weredesigned according to intron sequence provided from BACsequencing (Tables 1 <strong>and</strong> 2). <strong>The</strong> sequencing reactions wereperformed with a Bigdye-Terminator kit <strong>and</strong> <strong>the</strong> sequenceswere run on an ABI377 automatic sequencer (Applied Biosystems,Foster City, CA). <strong>The</strong> sequences were analyzed with<strong>the</strong> Sequencher 3.1.1 analysis program (Gene Codes, AnnArbor, MI).Calculation <strong>of</strong> DYDs: Calculation <strong>of</strong> DYDs included 32.7million records on milk, protein, <strong>and</strong> fat yields from alllactations <strong>of</strong> all Finnish dairy cows that calved for <strong>the</strong>ir firsttime after <strong>the</strong> year 1987. <strong>The</strong> associated genetic model wasa multiple-trait r<strong>and</strong>om regression test-day model routinelyused for genetic evaluation in Finl<strong>and</strong> (Lidauer et al. 2000).Within each biological trait, two different traits were defined,one for first lactation observations <strong>and</strong> ano<strong>the</strong>r one for all laterlactation observations. On <strong>the</strong> basis <strong>of</strong> this model, daily DYDswere calculated for all sires <strong>and</strong> all six traits, applying <strong>the</strong>method <strong>of</strong> Mrode <strong>and</strong> Swanson (2004). Daily DYDs fromlactation day 8 up to day 312 were summed to obtain a DYD ona 305-day basis. <strong>The</strong> DYDs for content traits were derived fromDYDs for yield traits.Genotyping: For genotyping all <strong>the</strong> observed coding sequencevariation two methods, allele discrimination <strong>and</strong>primer extension, were used. For PRLR snp5 <strong>and</strong> for GHRsnp1 <strong>and</strong> snp2 allelic discrimination using fluorogenic probes(TaqMan chemistry; Applied Biosystems) was performed. Foreach polymorphism a template for TaqMan probing wasamplified with st<strong>and</strong>ard protocols. <strong>The</strong> sequences <strong>of</strong> amplificationprimers <strong>and</strong> TaqMan probes are presented in Table 3.<strong>The</strong> detection <strong>of</strong> allelic differences was carried out with ABIPRISM 7700 real-time PCR (Applied Biosystems). <strong>The</strong> reactionswere performed in a volume <strong>of</strong> 25 ml containing 1 ml<strong>of</strong> template, 2,5 ml <strong>of</strong> TaqMan Universal PCR Master Mix(Applied Biosystems), 100 nm <strong>of</strong> each fluorescent probe, <strong>and</strong>700 nm <strong>of</strong> each primer. <strong>The</strong> PCR conditions were 40 cycles <strong>of</strong>15 sec at 95° <strong>and</strong> 1 min at 62° with an additional 2 min uracil-Nglycosylaseenzyme activation at 50° <strong>and</strong> 10 min denaturationat 95° in <strong>the</strong> first cycle. For allelic discrimination eight controlswithout a template <strong>and</strong> eight DNA controls for both alleleswere included into each run. <strong>The</strong> genotypes were analyzedwith an SDS 1.7a s<strong>of</strong>tware package (Applied Biosystems). <strong>The</strong>observed SNPs are named from snp1 to snp6 to simplify <strong>the</strong>formulas. <strong>The</strong> corresponding polymorphisms are presented inTable 4.A single-base-pair primer extension method (SNuPe Genotypingkit; Amersham Biosciences, Little Chalfont, UK) wasapplied for PRLR snp6 <strong>and</strong> GHR snp3 <strong>and</strong> snp4. <strong>The</strong>templates for primer extension were amplified with st<strong>and</strong>ardprotocols. <strong>The</strong> amplification primers <strong>and</strong> primers for minisequencingare presented in Table 3. <strong>The</strong> excess nucleotides<strong>and</strong> amplification primers were removed from <strong>the</strong> samples byExoSAP-IT purification (Amersham Biosciences). <strong>The</strong> reactionswere performed in a volume <strong>of</strong> 10 ml containing 5 ml <strong>of</strong>purified template, 4 ml <strong>of</strong> SNuPe reagent premix, <strong>and</strong> 2 mm <strong>of</strong>extension primer. Before MegaBACE 500 capillary electrophoresis(Amersham Biosciences) <strong>the</strong> primer extension productswere purified with an AutoSeq96 Dye Terminator clean-upkit (Amersham Biosciences) to eliminate <strong>the</strong> excess ddNTPs.<strong>The</strong> genotyping was performed with MegaBACE SNP Pr<strong>of</strong>ilers<strong>of</strong>tware.In addition to genotyped SNPs a set <strong>of</strong> microsatellitemarkers was selected <strong>and</strong> genotyped with st<strong>and</strong>ard protocols.A genetic linkage map was constructed with CRI-MAP 2.4.(Green et al. 1990).QTL linkage analysis with a single-QTL model: To identifynew segregating families QTL mapping was performed in<strong>the</strong> extended family data using a multimarker regression
GHR <strong>and</strong> PRLR Genes in Milk Production 2153TABLE 1Primers used for amplification <strong>and</strong> sequencing <strong>of</strong> <strong>the</strong> PRLR <strong>and</strong> GHR exons 2–10 from bovine genomic DNAPCR product Forward (59 / 39) Reverse (59 / 39)PRLRExon 2 CAGTGTTCTTGCCTGGTGG ACAGATGGGTGGTGTGACExon 3 GCGTATGCACAGCGATGC GATTGAAGAGAAGCAAATGCExon 4 GACCTCATCACTGGCCTG GAGGTTATCAGTGTCCATTCExon 5 GCTTCTTGACCATTGAGCC GATCTATCCCTAAGACAAGGExon 6 CACCCACTTGCTTCAGCCTAGT GAGGCACGACTGGTTCTCExon 7 GACCTACATACTGGCTTCTCTGC GCAGATTTCAGGCAGAATCCExon 8 CGCTACTCTGTTTGGATTGCTG GGTGCTTGGATTATCTGTAGExon 9 GGCTCAGATGGTAAAGAATC GCGACTCTATGGACTGTAGExon 10A GATCTTTCCGCTGTTCTGC GGCTGGTTCTTCTAACAGAGTCExon 10B GTGACAGATAGCAACATCCTGG CTGTCACATACGAAACCATGGHRExon 2 GAGACTCTAGGGCAGCGAAA TGTCCTCCTAGTTTGCAATTTTExon 3 CAAGCAAGACTTAAGTTTGG GTAAGAACAGTAGCTTGAACExon 4 CTGACAACAGCTCTGAAGC CCACTACTGCATGACACTCExon 5 CTAGTCCTTGGAAATGGTAC GCATGCACTTGGACTTTGCExon 6 CTGCCATAAAGTGGAAGTG CTGGGATATGTGGTATTAAGExon 7 CAGAAGCACCTCATGGAGC GTATGCCTGTGTATTGACAGExon 8 GTGGCTATCAAGTGAAATCATTGAC ACTGGGTTGATGAAACACTTCACTCExon 9 CTGACATGGAAATTGGCTTC CTTGATTCAGAAGTCAAGAGExon 10A GGTGTGATGTTGGGGTTAGC AGGTACCATCGCACATGTCAExon 10B CTTCACTAATGTATTTGTTACATG GTAGCACAAAATTAACACCCACapproach in a gr<strong>and</strong>daughter design (Knott et al. 1996). Inshort, as explained in Viitala et al. (2003), <strong>the</strong> most likelylinkage phases <strong>of</strong> <strong>the</strong> gr<strong>and</strong>sire were determined. <strong>The</strong>n forevery half-sib <strong>of</strong>fspring, <strong>the</strong> conditional probability <strong>of</strong> inheriting<strong>the</strong> sire’s alternative haplotype was calculated. A QTL withan additive effect was fitted every 1 cM along <strong>the</strong> linkage groupby regressing <strong>the</strong> trait score (DYD) on <strong>the</strong> probability. <strong>The</strong>regression analysis was nested within families <strong>and</strong> weightedwith <strong>the</strong> reciprocal <strong>of</strong> <strong>the</strong> reliability <strong>of</strong> <strong>the</strong> son’s breedingvalue. <strong>The</strong> presence <strong>of</strong> a QTL was assessed by comparing <strong>the</strong>pooled mean squares obtained from regression within familiesto <strong>the</strong> residual mean square (i.e., F-ratios). This analysisprovides F-ratios along <strong>the</strong> linkage group with <strong>the</strong> maximumvalue being <strong>the</strong> most likely position <strong>of</strong> QTL. For more detailssee Vilkki et al. (1997). <strong>The</strong> significance thresholds <strong>and</strong><strong>the</strong> empirical P-values were estimated with <strong>the</strong> permutationtest (Churchill <strong>and</strong> Doerge 1994). <strong>The</strong> chromosomewisesignificance levels (P chr ) for across-family analysis <strong>and</strong> withinfamilyanalysis were obtained by carrying out 100,000 permutations.<strong>The</strong> 95% confidence intervals (C.I.) for QTL positionswere determined with QTLExpress available at http://qtl.cap.ed.ac.uk/ (Seaton et al. 2002). QTLExpress was also used to fitindividual SNPs as fixed effects in <strong>the</strong> linkage model.QTL linkage analysis with <strong>the</strong> two-QTL model: In our previousstudy (Viitala et al. 2003) no evidence for <strong>the</strong> presence<strong>of</strong> two QTL was found on chromosome 20. <strong>The</strong> existence <strong>of</strong>multiple QTL on <strong>the</strong> same linkage group was reanalyzed with<strong>the</strong> extended data by fitting a two-QTL model into <strong>the</strong> analysis(Spelman et al. 1996; Velmala et al. 1999). First, test statisticswere calculated for one QTL vs. none <strong>and</strong> <strong>the</strong>n for two QTL vs.TABLE 2Primers used for amplification <strong>and</strong> sequencing <strong>of</strong> <strong>the</strong> alternative GHR exons (1A, 1B, <strong>and</strong> 1C) <strong>and</strong>promoters from bovine genomic DNAPCR product Forward (59 / 39) Reverse (59 / 39)GHRExon 1A_1 ATATTCTGGGAGGTGGGTCTC ACAACGCATTGCCTCACATAExon 1A_2 CTGGCCTTCACTTCAGTTGG CCCTTTAAAGCAAAGTGACCAExon 1BC_1 TCCACACCCCGTCTAGAATC AGCGCGTCATGCTATCTTTTExon 1BC_2 CCAAGTCCTTGGTCCTGTGT TGAAAAGCTGTCAACGTGCTExon 1BC_3 CGCTGGTCTGTCAAATCTCA CAAACCCAACACTGCCTCTTExon 1BC_4 GCTGAGGCCTGTGTCTGAAT TTGGTGCGTGTCACTCTCATExon 1BC_5 CCCTTTCCAGCAGAGAGCTA TCCTCTTCCCATGGCTGAExon 1BC_6 GAACGCTTCATCCCAGCTC AAAGTAACAGCCCGATCCTGExon 1BC_7 GAACCGCGCTCTCTCTCC CAAAACTGGATTCGGAGGAAExon 1BC_8 TCATGGAGTTAGGGGTGACA CTCGAGCAGTTCTGTCAAA
2154 S. Viitala et al.TABLE 3Primers (F <strong>and</strong> R) <strong>and</strong> probes (a, b, or c) used for Taqman probing <strong>and</strong> minisequencingSNP Polymorphism Primer/probe sequence (59-39)GHR snp1 F279Y F CTTTGGAATACTTGGGCTAGR CACTTCACTCAGGATTCACAGTGACATTATATTTACTCATAT aAGTGACATTATTTTTACTCATA bGHR snp2 N528T F AGTGTGACACGCACCCAGAAR CCCAGCTGTAGTGGTAAGGCTTTTCATCGTGGACAACGCTTACTTCTGC aTTCATCGTGGACACCGCTTACTTCTG bGHR snp3 A541S F AGTGTGACACGCACCCAGAAR CCACATGATGAGAGAAACTCGAGGTAGACGCCAAAAAGTACATT cGHR snp4 S555G F AGTGTGACACGCACCCAGAAR CCACATGATGAGAGAAACTCAGCTAACTTCATCGTGGACA cPRLR snp5 S18N F TGCAGCATCTAGAGTGGTTTTCAR GAACAAGACAGTCTCTTACTTACCATTCAACTTTTTCTCAACGTCAGCCTT aTACTTTTTCTCAGTGTCAGCCTT bPRLR snp6 L186P F GACCTACATACTGGCTTCTCTGCR GCAGATTTCAGGCAGAATCCCCTCCCTAGACTCATTTTACTC c<strong>The</strong> polymorphic nucleotide in Taqman probes is presented in boldface type.a<strong>The</strong> sequence <strong>of</strong> FAM-labeled Taqman probe.b<strong>The</strong> sequence <strong>of</strong> VIC-labeled Taqman probe.c<strong>The</strong> sequence <strong>of</strong> primer extension oligo.none. <strong>The</strong> empirical thresholds were determined with apermutation test as described above. If <strong>the</strong> test statistics fortwo QTL vs. none were significant, an F-test for two QTL vs.one QTL was applied. This allows us to define whe<strong>the</strong>r <strong>the</strong> twoQTL explain more variation than one QTL. <strong>The</strong> significance<strong>of</strong> <strong>the</strong> test statistics was determined by a st<strong>and</strong>ard F-table.Association analysis with SNP genotypes: For <strong>the</strong> analysis <strong>of</strong><strong>the</strong> association <strong>of</strong> GHR <strong>and</strong> PRLR SNP genotypes with milkproduction traits <strong>the</strong> following model was applied to <strong>the</strong> data(data set I),y ¼ Xb 1 Za 1 e;where y is a vector <strong>of</strong> DYDs for 1 <strong>of</strong> <strong>the</strong> 10 milk productiontraits considered, st<strong>and</strong>ardized to have variance equal to 1 <strong>and</strong><strong>the</strong> zero mean; b is a vector <strong>of</strong> fixed effects comprising <strong>the</strong>general mean <strong>and</strong> <strong>the</strong> SNP genotypes effects <strong>of</strong> GHR snp1,snp2, snp3, <strong>and</strong> snp4 <strong>and</strong> PRLR snp5 <strong>and</strong> snp6; a is a vector <strong>of</strong>r<strong>and</strong>om polygenic effects assuming a N 0; As 2 a with A rep-resenting additive relationships among individuals <strong>and</strong> s 2 abeing a component <strong>of</strong> <strong>the</strong> total additive genetic variance attributedto polygenes; e is a vector <strong>of</strong> r<strong>and</strong>om errors assuminge N 0; Dse 2 with D being a diagonal matrix with reciprocal<strong>of</strong> <strong>the</strong> effective number <strong>of</strong> daughters used for <strong>the</strong> calculation<strong>of</strong> DYD for <strong>the</strong> ith bull <strong>and</strong> s 2 edenoting <strong>the</strong> error variance; <strong>and</strong>X, Z are corresponding design matrices.<strong>The</strong> parameters underlying <strong>the</strong> above model (i.e., b, a, e)were estimated via a maximum-likelihood method. Note thatonly <strong>the</strong> model’s effects were estimated while, due to <strong>the</strong> smallsize <strong>of</strong> <strong>the</strong> analyzed sample, <strong>the</strong> variance components wereassumed as known, amounting to s 2 ¼ 0:30; a s2 e¼ 0:70: Additionally,because <strong>of</strong> marked differences in <strong>the</strong> number <strong>of</strong>missing genotypes between particular SNPs, for <strong>the</strong> inferenceson model parameters imputation <strong>of</strong> missing genotypes wasapplied. <strong>The</strong> imputation was based on <strong>the</strong> multiple-imputationprinciple (Verbeke <strong>and</strong> Molenberghs 1997), so that 125 datasets were generated in which <strong>the</strong> missing genotypes were replacedby r<strong>and</strong>om deviates from <strong>the</strong> multinomial distributionTABLE 4<strong>The</strong> GHR <strong>and</strong> PRLR polymorphisms <strong>and</strong> allele frequencies in Finnish AyrshireGene SNP Polymorphism Exon Substitution Frequency Flanking sequenceGHR snp1 F279Y 8 T/A 0.89/0.11 TTATT/ATTTAsnp2 N528T 10 A/C 0.63/0.37 GACAA/CCGCTsnp3 A541S 10 G/T 0.90/0.10 CATTG/TCCCTsnp4 S555G 10 A/G 0.87/0.13 GCCAA/GGCTTPRLR snp5 S18N 3 GT/AC 0.86/0.14 CTCAG/AT/CGTCAsnp6 L186P 7 T/C 0.45/0.55 ACTCT/CGAAG
GHR <strong>and</strong> PRLR Genes in Milk Production 2155Figure 1.—A schematic <strong>of</strong> <strong>the</strong>model selection procedure.with parameters corresponding to <strong>the</strong> distribution <strong>of</strong> knownSNP genotypes. <strong>The</strong> final estimates <strong>of</strong> b <strong>and</strong> a (say, û) are givenby <strong>the</strong> arithmetic mean <strong>of</strong> estimates from <strong>the</strong> 125 data sets (ûi):û ¼sffiffiffiffiffiffiffiffiffiffiffiffiffiffiffiffiffiffiffiffiffiffiffiffiffiffiffiffiffiffiffiffiffiffiffiffiffiffiffiffiffiffiffiffiffiffiffiffiffiffiffiffiffiffiffiffiffiffiffiffiffiP 125125 6 i¼1 s2 u i1 126 P 125i¼1 ðûi ûÞ 2:125 125 124P 125i¼1 ûi<strong>The</strong> likelihood-ratio test (l) was used for testing varioushypo<strong>the</strong>ses corresponding to SNP genotype effects on milkproduction traits, using,l ¼ 2½ln Lð ˆb 0 Þ ln Lð ˆb 1 ÞŠ;where L ˆb 0<strong>and</strong> L ˆb1represent <strong>the</strong> maximum <strong>of</strong> likelihoodfunctions obtained under <strong>the</strong> more parsimonious <strong>and</strong> <strong>the</strong> lessparsimonious models, respectively. Note that in <strong>the</strong> currentanalysis model parsimony is expressed by <strong>the</strong> vector <strong>of</strong> fixedeffects (b) while <strong>the</strong> o<strong>the</strong>r model parameters remain <strong>the</strong> samebetween models. <strong>The</strong> full model is given byb ¼½m s1 ð11Þ s1 ð12Þ s1 ð22Þ s2 ð11Þ s2 ð12Þ s2 ð22Þ s3 ð11Þ s3 ð12Þs3 ð22Þ s4 ð11Þ s4 ð12Þ s4 ð22Þ s5 ð11Þ s5 ð12Þ s5 ð22Þ s6 ð11Þs6 ð12Þ s6 ð22Þ s1 3 sZŠ T ;where m is <strong>the</strong> general mean, sX (ij) represents <strong>the</strong> genotype ij<strong>of</strong> <strong>the</strong> Xth SNP, <strong>and</strong> s1 3 sZ represents <strong>the</strong> interaction betweengenotypes <strong>of</strong> snp1 <strong>and</strong> snp5 or snp6. Significance <strong>of</strong> l wasassessed on <strong>the</strong> basis <strong>of</strong> its large sample distribution, whichfollows <strong>the</strong> x 2 -distribution with degrees <strong>of</strong> freedom equal to<strong>the</strong> difference in <strong>the</strong> number <strong>of</strong> parameters in b betweencompared models. <strong>The</strong> model selection procedure is presentedin Figure 1.In addition to l, a nonparametric approach to modelcomparison was applied. Following Bogdan et al. (2004) <strong>the</strong>original Bayesian information criterion (BIC) (Schwarz1978) was modified to account for <strong>the</strong> prior information on<strong>the</strong> number <strong>of</strong> putative QTL in <strong>the</strong> model, resulting inBIC ¼ ln LðˆbÞ½ðp 1 qÞln n 1 2p lnðl 1Þ 1 2q lnðu 1ÞŠ;where p <strong>and</strong> q are, respectively, <strong>the</strong> numbers <strong>of</strong> main genotype<strong>and</strong> interaction terms in <strong>the</strong> model, <strong>and</strong> n is <strong>the</strong> number <strong>of</strong>individuals. For a model fitting M SNPs, prior information onQTL is introduced through M=l, which is <strong>the</strong> a priori number<strong>of</strong> additive QTL effects, <strong>and</strong> through MðM 1Þ=2u, which is<strong>the</strong> a priori number <strong>of</strong> QTL interactions. For <strong>the</strong> case <strong>of</strong> <strong>the</strong>above model with six SNPs, assuming a priori two additive QTL<strong>and</strong> two interaction terms, l <strong>and</strong> u are equal to 3.0 <strong>and</strong> 7.5,respectively.<strong>The</strong> confirmation <strong>of</strong> <strong>the</strong> association <strong>of</strong> GHR <strong>and</strong> PRLR SNPgenotypes with milk production traits in data representing anindependent sample <strong>of</strong> <strong>the</strong> general population (data set II)was performed similarly except that only snp1, snp5, <strong>and</strong> <strong>the</strong>irinteraction was tested.RESULTSScreening <strong>the</strong> c<strong>and</strong>idate genes for DNA sequencepolymorphism: <strong>The</strong> coding sequences <strong>of</strong> GHR (exons
2156 S. Viitala et al.TABLE 5<strong>The</strong> genotypes <strong>of</strong> <strong>the</strong> GHR <strong>and</strong> PRLR amino acid polymorphisms in <strong>the</strong> siresSire No. <strong>of</strong> sons F279Y N528T A541S S555G S18N L186P1 29 FF NN AA SS SS LP2 26 FF NN AS SS SS LL3 56 FF NN AS SS SS LL4 37 FF NT AS SG SS LP5 47 FF NN AA SS SS LL6 18 FF NT AA SS SS LP7 75 FF TT AA SS SN PP8 29 FF TT AA SS SN PP9 27 FF NT AA SG SS LP10 41 FF NN AA SS SS LP11 38 FF NN AA SS SN LP12 40 FY NN AS SS SN LP13 21 FF NN AA SS SS LP14 35 FY NT AS SG SN LP15 38 FF NN AA SS SN LP16 40 FF NT AA SS SS LP17 28 FF NT AA SG SS LP18 48 FF NT AS SS SS LP19 33 FF NT AA SS SS LP20 24 FF TT AA SG SN LP21 23 FY NN AA SS SS PP22 23 FF NN AA SS SS LP23 21 FF NN AA SS SS LP<strong>The</strong> families segregating for a QTL effect on chromosome 20 are underlined.2–10) <strong>and</strong> PRLR (exons 2–10) <strong>and</strong> <strong>the</strong> sequence <strong>of</strong>three well-characterized GHR promoters were screenedto find DNA variation in segregating families that couldexplain <strong>the</strong> observed QTL effects in bovine chromosome20. A total <strong>of</strong> five exonic SNPs were detected inGHR, four <strong>of</strong> which (snp1, -2, -3, <strong>and</strong> -4) lead to anamino acid substitution (Table 4). In PRLR two contiguousSNPs generate an amino acid substitution in <strong>the</strong>signal peptide <strong>of</strong> <strong>the</strong> protein (in this study treated as asingle marker, snp5) <strong>and</strong> a single SNP (snp6) leads toan amino acid substitution in <strong>the</strong> extracellular, lig<strong>and</strong>bindingdomain. <strong>The</strong> SNP genotypes <strong>of</strong> <strong>the</strong> sires arepresented in Table 5.Two <strong>of</strong> <strong>the</strong> GHR amino acid substitutions have beendescribed in Holstein–Friesian cattle (Blott et al. 2003).<strong>The</strong> first (snp1) is a phenylalanine–tyrosine substitution(F279Y ) in <strong>the</strong> transmembrane domain <strong>of</strong> <strong>the</strong> receptor(exon 8). <strong>The</strong> aromatic ring <strong>of</strong> tyrosine contains areactive hydroxyl group, which makes it less hydrophobicthan also aromatic <strong>and</strong> neutral phenylalanine. <strong>The</strong>second (snp2) substitution is a replacement <strong>of</strong> a polarasparagine with a polar threonine (N528T ) in <strong>the</strong> cytoplasmicdomain (exon 10).In addition to <strong>the</strong>se two substitutions two additionalamino acid replacements were observed in Finnish Ayrshire.Both locate in exon 10, where one is a G-to-Tsubstitution (Nt1639; snp3) <strong>and</strong> <strong>the</strong> o<strong>the</strong>r is an A-to-Gsubstitution (Nt1681; snp4) at <strong>the</strong> first codon position(numbering according to GenBank cDNA sequenceX70041). <strong>The</strong> first replaces a small <strong>and</strong> hydrophobicalanine with a small but polar serine residue (A541S)<strong>and</strong> <strong>the</strong> latter a serine with a tiny glycine (S555G).To localize evolutionary conserved, functionally <strong>and</strong>structurally important regions in GHR sequence a multiplesequence alignment was performed with ClustalWat http://www.ebi.ac.uk/clustalw/index.html (st<strong>and</strong>ardparameters). Primarily ClustalW provides informationabout conserved sequence regions but it can also <strong>of</strong>ferimportant clues about which residues are most crucialfor maintaining a protein’s structure or function. <strong>The</strong>more conserved <strong>the</strong> region is, <strong>the</strong> more likely it is importantfor structural <strong>and</strong>/or functional properties <strong>of</strong><strong>the</strong> protein. However, particular caution should be takenif <strong>the</strong> sequences are drawn from very closely relatedspecies because similarities may reflect history ra<strong>the</strong>rthan function.<strong>The</strong> comparison <strong>of</strong> <strong>the</strong> GHR cytoplasmic domainbetween different species (Figure 2) revealed that <strong>the</strong>three observed SNPs in exon 10 locate in <strong>the</strong> ‘‘periphery’’<strong>of</strong> conserved regions, suggesting that <strong>the</strong> variationdoes not necessarily have functional or structural importance.As presented in Figure 2 at <strong>the</strong> positioncorresponding to <strong>the</strong> substitution N528T, asparagine iscommon in most species (primates, carnivores, birds,elephants, <strong>and</strong> horses). It is common also in somerodents, bats, insectivores, rabbits, <strong>and</strong> artiodactyls butserine or threonine is also seen in some <strong>of</strong> <strong>the</strong>se species.All three residues are represented in artiodactyls.
GHR <strong>and</strong> PRLR Genes in Milk Production 2157Figure 2.—<strong>The</strong> multiple-sequence alignment <strong>of</strong> PRLR(amino acids 157–196) <strong>and</strong> GHR (amino acids 268–307 <strong>and</strong>517–556). <strong>The</strong> positions <strong>of</strong> amino acid substitutions L186P,F279Y, N528T, A541S, <strong>and</strong>S555G are marked with arrows. <strong>The</strong>substitution <strong>of</strong> PRLR exon 7 replaces leucine with a prolineresidue (L186P). At <strong>the</strong> position <strong>of</strong> substitution glycine is highlyconserved among studied species except artiodactyls. <strong>The</strong> comparison<strong>of</strong> <strong>the</strong> transmembrane domain <strong>of</strong> GHR (exon 8) suggeststhat at <strong>the</strong> position <strong>of</strong> substitution F279Y <strong>the</strong> phenylalanineis conserved among mammals except cow. <strong>The</strong> comparison <strong>of</strong><strong>the</strong> GHR exon 10 revealed that <strong>the</strong> three observed substitutions,N528T, A541S, <strong>and</strong>S555G, locate in <strong>the</strong> ‘‘periphery’’ <strong>of</strong> conservedregions. However, <strong>the</strong> serine residue at position A541S<strong>and</strong> <strong>the</strong> glycine at position S555G are observed only in Bostaurus. <strong>The</strong> sequences for alignment were retrieved from <strong>the</strong>NCBI sequence database.<strong>The</strong> alanine at position A541S is common in all speciesexcept carnivores (threonine). In some primates(human, rhesus monkey, <strong>and</strong> baboon) <strong>and</strong> in one batspecies <strong>and</strong> in horse <strong>the</strong> corresponding residue isproline <strong>and</strong> in some rodents <strong>and</strong> insectivores threonine<strong>and</strong> valine are seen. <strong>The</strong> serine residue is observed onlyin Bos taurus.<strong>The</strong> glycine residue at <strong>the</strong> position <strong>of</strong> bovine S555Gsubstitution is B. taurus specific. <strong>The</strong> serine residue is<strong>the</strong> most common but some variation in rodents, primates,<strong>and</strong> bats exists. In chicken <strong>and</strong> pigeon <strong>the</strong> correspondingresidue is glutamine.<strong>The</strong> comparison <strong>of</strong> <strong>the</strong> transmembrane domain <strong>of</strong>GHR suggests that <strong>the</strong> neutral <strong>and</strong> highly hydrophobicphenylalanine at <strong>the</strong> position <strong>of</strong> substitution F279Y isconserved among mammals except cow (B. taurus;Figure2). In chicken <strong>and</strong> pigeon <strong>the</strong> corresponding residue isneutral <strong>and</strong> hydrophobic isoleucine. <strong>The</strong> comparisonis, however, based only on few species.<strong>The</strong> sequences for alignments are retrieved from <strong>the</strong>NCBI database (http://www.ncbi.nlm.nih.gov/). <strong>The</strong> databaseaccession numbers are presented in Figure 2.Substitutions at <strong>the</strong> second position [Nt139(G-A)]<strong>and</strong> at <strong>the</strong> third position [Nt140(T-C)] <strong>of</strong> PRLR exon 3replace a serine with an asparagine residue (numberingaccording to GenBank sequence L02549). <strong>The</strong>se twocontiguous substitutions can be found only in two ‘‘haplotypes’’(GT <strong>and</strong> AC) in Finnish Ayrshire.Exon 3 encodes a highly hydrophobic signal peptide<strong>of</strong> <strong>the</strong> protein. <strong>The</strong> comparison <strong>of</strong> PRLR signal peptides<strong>of</strong> different species [human (NCBI sequence database:AAA60174), red deer (CAA64419), bovine (AAA51417),sheep (AAB96795), rabbit (AAA31457), rat (AAA41938),mouse (AAC37641), chicken (BAA02439), domesticpigeon (AAA20646), <strong>and</strong> common turkey (AAB01544)]reveals that <strong>the</strong> amino acid sequences are quite different<strong>and</strong> <strong>the</strong> length <strong>of</strong> <strong>the</strong> sequences vary. However, a certainhydrophobic structure can be seen in all comparedmammals. At <strong>the</strong> position <strong>of</strong> <strong>the</strong> S18N substitution apolar amino acid is common except in sheep wherehighly hydrophobic phenylalanine exists. <strong>The</strong> polarasparagine <strong>and</strong> <strong>the</strong> polar serine are <strong>the</strong> most commonat this position, suggesting that <strong>the</strong> observed variationmay have low functional or structural importance.<strong>The</strong> substitution at <strong>the</strong> second position <strong>of</strong> PRLRexon 7 [Nt643(C-T)] replaces a neutral <strong>and</strong> hydrophobicleucine with proline residue (L186P). Exon 7 codes apart <strong>of</strong> <strong>the</strong> extracellular, lig<strong>and</strong>-binding domain <strong>of</strong> <strong>the</strong>receptor. <strong>The</strong> comparison <strong>of</strong> <strong>the</strong> PRLR extracellulardomain between different species (Figure 2) revealedthat at <strong>the</strong> position <strong>of</strong> substitution glycine is highlyconserved among studied vertebrates except artiodactyls[bovine (proline or leucine), sheep (proline), <strong>and</strong>red deer (alanine)].Genotyping <strong>of</strong> <strong>the</strong> c<strong>and</strong>idate genes: <strong>The</strong> observed codingsequence polymorphisms were genotyped with twodifferent SNP genotyping methods—allele discrimination
2158 S. Viitala et al.TABLE 6<strong>The</strong> results <strong>of</strong> <strong>the</strong> least-squares analysis across families for first <strong>and</strong> later (second <strong>and</strong> third) lactationsTrait F-ratio Position (cM) P chrFirst lactation Protein content 2.45 45 ,0.0009Fat content 2.05 45 ,0.0109Protein yield 1.67 65 ,0.0448Later lactations Milk yield 2.19 59 ,0.0031Protein content 2.98 43 ,0.00005Fat content 2.37 45 ,0.0033Protein yield 1.87 62 ,0.0182Fat yield 1.76 41 ,0.0438Significance thresholds were determined by permutation. <strong>The</strong> highest test statistics (F-ratios) <strong>and</strong> <strong>the</strong>ir positions(centimorgans) for all chromosomewise significant effects (P chr , 0.05) are shown.<strong>and</strong> primer extension. To increase <strong>the</strong> informativity<strong>of</strong> <strong>the</strong> GHR as a marker, haplotypes <strong>of</strong> <strong>the</strong> four SNPscausing <strong>the</strong> amino acid substitutions were used in QTLanalysis. <strong>The</strong> haplotypes were built within families on<strong>the</strong> basis <strong>of</strong> homozygous sons, assuming no recombinationwithin <strong>the</strong> gene. <strong>The</strong> allele frequencies <strong>of</strong>GHR <strong>and</strong> PRLR SNPs in data set I are presented inTable 4.Defining <strong>the</strong> map position <strong>of</strong> <strong>the</strong> c<strong>and</strong>idate genes: Todefine <strong>the</strong> map position <strong>of</strong> c<strong>and</strong>idate genes a male geneticlinkage map with PRLR (S18N), GHR haplotype,<strong>and</strong> seven microsatellite markers was constructed. <strong>The</strong>order <strong>of</strong> <strong>the</strong> map is BM3517 (0 cM)–TGLA304 (14 cM)–BM713 (35 cM)–GHR (39 cM)–TGLA153 (40 cM)–DIK15(43 cM)–PRLR (44 cM)–AGLA29 (45 cM)–AFR2215(69 cM). <strong>The</strong> distance between GHR <strong>and</strong> PRLR inhuman genomic sequence (NCBI human genomic view:http://www.ncbi.org/) is 7 Mb, where <strong>the</strong> GHR gene islocated in chromosome 5 at map position 42.4–42.7 Mb<strong>and</strong> <strong>the</strong> PRLR gene at map position 35.1–35.2. In <strong>the</strong>mouse genome <strong>the</strong> GHR gene is located in chromosome15 at map position 3.1–3.4 Mb <strong>and</strong> <strong>the</strong> PRLR atmap position 10.1–10.2 Mb, with <strong>the</strong> distance betweengenes being also 7 Mb (Ensembl Genomic Server: http://www.ensembl.org/). We herein report a new map positiondifferent from that previously reported for bovinePRLR, which is compatible with <strong>the</strong> human <strong>and</strong> mousegenomic sequences.Linkage analysis on BTA20: In <strong>the</strong> across-family analysis,QTL effects exceeding <strong>the</strong> 5% chromosomewisesignificance threshold were identified for PY, F%, <strong>and</strong>P% in first lactation <strong>and</strong> for all milk production traits inlater lactations (Table 6). <strong>The</strong> highest test statistics wasobserved in P% (P chr , 0.00005, later lactations) at mapposition 43 cM (DIK15). <strong>The</strong> 95% C.I. for observed QTLposition <strong>of</strong> each trait is relatively long, spanning most <strong>of</strong><strong>the</strong> chromosome (data not shown).<strong>The</strong> two-QTL model supports <strong>the</strong> existence <strong>of</strong> twoQTL for protein percentage (1 QTL vs. no QTL, P chr ,0.00005; 2 QTL vs. no QTL, P chr , 0.00001; 2 QTL vs.1 QTL, P chr , 0.01) at map positions 35 cM (BM713)<strong>and</strong> 45 cM (AGLA29). Some caution should be takenwhen interpreting <strong>the</strong> two-QTL result because <strong>the</strong> F-testfor two QTL vs. one QTL is only an approximate test <strong>and</strong>it is likely to be unconservative <strong>and</strong> thus to provideoptimistic results.Because in <strong>the</strong> analysis <strong>of</strong> individual families <strong>the</strong>results were very similar for first <strong>and</strong> later lactations weherein report only <strong>the</strong> results for later lactations. Four <strong>of</strong><strong>the</strong> families were identified to be segregating for <strong>the</strong>QTL (Table 7). In families 5, 12, <strong>and</strong> 14, <strong>the</strong> sizes <strong>of</strong> <strong>the</strong>QTL substitution effect on milk yield were 0.35-, 0.51-,<strong>and</strong> 0.77s p , respectively (<strong>the</strong> st<strong>and</strong>ard deviation for milkyield in 2002 data is 428 kg). Exceptionally high teststatistics were observed for fat content (P chr , 0.0001)<strong>and</strong> for protein content (P chr , 0.0002) in family 12 <strong>and</strong>TABLE 7<strong>The</strong> within-family result <strong>of</strong> QTL analysisMilk yield Fat content Protein content Protein yieldFamily F-ratio cM P chr F-ratio cM P chr F-ratio cM P chr F-ratio cM P chr5 8.30 53 ,0.0192 16.40 31 ,0.00112 12.18 47 ,0.0047 23.71 45 ,0.0001 19.91 37 ,0.000214 11.17 61 ,0.0073 7.09 37 ,0.0347 11.43 24 ,0.0071 9.65 69 ,0.013421 11.65 36 ,0.0077 24.33 43 ,0.0004<strong>The</strong> highest test statistics (F-ratios) <strong>and</strong> <strong>the</strong>ir positions (centimorgans) for all effects significant at <strong>the</strong> chromosomewide level(P chr , 0.05) are shown. This was independently tested in 23 families.
GHR <strong>and</strong> PRLR Genes in Milk Production 2159Figure 3.—Ninety-five percent normalC.I. for SNP genotype effects onyield traits estimated from <strong>the</strong> imputedfamily data. <strong>The</strong> SNPs are presented bynumbers on <strong>the</strong> x-axis in <strong>the</strong>ir presumedorder in <strong>the</strong> genome. For eachSNP <strong>the</strong> estimates are given for genotypes‘‘11’’ (d) <strong>and</strong> ‘‘12’’ (n) in relationto genotype ‘‘22,’’ whose effect is setto 0. <strong>The</strong> GHR snp1 (F279Y ) genotypes‘‘11’’ <strong>and</strong> ‘‘22’’ st<strong>and</strong> for FF <strong>and</strong> YY. Respectively,<strong>the</strong> PRLR snp5 (S18N ) genotype‘‘11’’ st<strong>and</strong>s for NN <strong>and</strong> ‘‘22’’ for SS.On <strong>the</strong> y-axis <strong>the</strong> effects are indicated inkilograms.for protein content (P chr , 0.00004) in family 21. Estimatedbest QTL positions for those families vary considerablybetween 53 <strong>and</strong> 61 for MY, 36 <strong>and</strong> 45 for F%,<strong>and</strong> 24 <strong>and</strong> 43 for P%, as well as 31 <strong>and</strong> 69 for PY. Infamily 12 <strong>the</strong> estimated substitution effect for F% is0.49ŝ p <strong>and</strong> for P% it is 0.64. In family 21, <strong>the</strong> substitutioneffects for F% <strong>and</strong> P% were 0.67- <strong>and</strong> 0.91ŝ p ,respectively. In 2002 data, <strong>the</strong> ŝ p for F% is 0.244 percentageunits <strong>and</strong> for P% 0.12 units. Some caution shouldbe taken with <strong>the</strong> interpretation <strong>of</strong> <strong>the</strong> substitution effectsin individual families because <strong>the</strong> effects are likelyto be overestimated, particularly with limited family size.<strong>The</strong> size <strong>of</strong> <strong>the</strong> families is presented in Table 5.In addition, we tested <strong>the</strong> effects <strong>of</strong> individual SNPsby fitting <strong>the</strong>m as fixed effects one at <strong>the</strong> time in <strong>the</strong>linkage model (QTLExpress, results available upon request).GHR F279Y explains most <strong>of</strong> <strong>the</strong> QTL variancefor content traits <strong>and</strong> some <strong>of</strong> <strong>the</strong> QTL variance for milkyield. PRLR S18N explains part <strong>of</strong> <strong>the</strong> QTL variance formilk yield <strong>and</strong> protein yield. <strong>The</strong> o<strong>the</strong>r SNPs have noeffect on QTL variance for any <strong>of</strong> <strong>the</strong> traits.Effect <strong>of</strong> <strong>the</strong> GHR <strong>and</strong> PRLR polymorphism <strong>and</strong>model selection: <strong>The</strong> estimated effects <strong>of</strong> SNP genotypesbased on 125 evaluations <strong>of</strong> <strong>the</strong> full model areshown in Figures 3 <strong>and</strong> 4. Results for <strong>the</strong> first <strong>and</strong> <strong>the</strong>combined later lactations remain in good agreement,showing that for each trait 3 lactation combination <strong>the</strong>largest impact on milk production traits is due to genotypevariation in snp1 <strong>of</strong> GHR <strong>and</strong> snp5 <strong>of</strong> PRLR,while <strong>the</strong> effects <strong>of</strong> genotype variation in <strong>the</strong> remainingSNPs are close to zero. In particular, snp1 has <strong>the</strong>highest influence on P% <strong>and</strong> F% while snp5 markedlyinfluences PY <strong>and</strong> FY. For both <strong>the</strong> content <strong>and</strong> <strong>the</strong>yield, <strong>the</strong> two SNPs exhibit somewhat higher effect onprotein than on fat.<strong>The</strong> fit <strong>of</strong> <strong>the</strong> full model including effects <strong>of</strong> all SNPs<strong>and</strong> <strong>the</strong> interaction term between snp1 <strong>and</strong> snp5 genotypeswas tested against a series <strong>of</strong> various possiblesubmodels (expressed by various vectors b) using l <strong>and</strong>BIC as testing criteria. <strong>The</strong> gene effects have ra<strong>the</strong>rbroad C.I.’s, when point estimates are considered inmodel selection <strong>and</strong> many SNPs are selected into <strong>the</strong>
2160 S. Viitala et al.Figure 4.—Ninety-five percent normalC.I. for SNP genotype effects oncontent traits estimated from <strong>the</strong> imputedfamily data. <strong>The</strong> SNPs are presentedby numbers on <strong>the</strong> x-axis in<strong>the</strong>ir presumed order in <strong>the</strong> genome.For each SNP <strong>the</strong> estimates are givenfor genotypes ‘‘11’’ (d) <strong>and</strong> ‘‘12’’ (n)in relation to genotype ‘‘22,’’ whose effectis set to 0. <strong>The</strong> GHR snp1 (F279Y)genotypes 11 <strong>and</strong> 22 st<strong>and</strong> for FF<strong>and</strong> YY. Respectively, <strong>the</strong> PRLR snp5(S18N ) genotype 11 st<strong>and</strong>s for NN<strong>and</strong> 22 for SS. On <strong>the</strong> y-axis <strong>the</strong> effectsare indicated in percentages (<strong>of</strong> protein<strong>and</strong> fat in milk).model. Note that <strong>the</strong> set <strong>of</strong> selected SNPs also dependson <strong>the</strong> model selection statistics considered, so that <strong>the</strong>LRT ‘‘chooses’’ different models than <strong>the</strong> BIC.Table 8 summarizes best models, i.e., <strong>the</strong> most parsimoniousmodels with sufficiently good fit, while results<strong>of</strong> all <strong>the</strong> comparisons are available upon request. Generally,both <strong>of</strong> <strong>the</strong> applied model selection criteriaselect different models, with l preferring models withmore parameters than BIC. Considering l it can be seenthat for most <strong>of</strong> <strong>the</strong> trait 3 lactation combinations, <strong>the</strong>variation in a single SNP genotype is not sufficientto explain <strong>the</strong> nonpolygenic part <strong>of</strong> <strong>the</strong> observed traitvariation. <strong>The</strong> effect <strong>of</strong> interaction between GHR <strong>and</strong>PRLR is significant for most <strong>of</strong> <strong>the</strong> models. With rankingbased on <strong>the</strong> BIC it is noteworthy that <strong>the</strong> PRLR SNPsare especially important in describing variation <strong>of</strong> yieldtraits, so that snp5 is sufficient for PY 1st , while for FY 1stmodels fitting only snp5 <strong>and</strong> snp6 are ranked, respectively,as <strong>the</strong> third- <strong>and</strong> <strong>the</strong> second-best models. Consideringcontent traits, it is <strong>the</strong> snp1 model that showspredominant impact, since snp1 is sufficient for P% 1st ,P% later , <strong>and</strong> F% 1st <strong>and</strong> for F% later <strong>the</strong> model is ranked atsecond place.Effect <strong>of</strong> <strong>the</strong> GHR <strong>and</strong> PRLR polymorphisms in anindependent sample—a confirmation: <strong>The</strong> effects <strong>of</strong><strong>the</strong> GHR F279Y <strong>and</strong> PRLR S18N on milk yield <strong>and</strong>composition were estimated in an independent sample(data set II) <strong>of</strong> <strong>the</strong> general dairy cattle population. <strong>The</strong>model comparison <strong>of</strong> <strong>the</strong> importance <strong>of</strong> GHR F279Y<strong>and</strong> PRLR S18N on different traits provides <strong>the</strong> sameconclusions as were obtained for <strong>the</strong> family data. <strong>The</strong>effect <strong>of</strong> PRLR S18N (snp5) predominates on yield traits<strong>and</strong> GHR F279Y on content traits. <strong>The</strong> best modelsselected by l <strong>and</strong> BIC are presented in Table 9. <strong>The</strong> results<strong>of</strong> all <strong>the</strong> comparisons are available upon request.For most yield traits (MY 1st ,PY 1st ,MY later ,PY later , <strong>and</strong>FY later ) <strong>the</strong> best model is <strong>the</strong> interaction model, whilefor FY 1st both SNPs are important but interaction is notneeded. <strong>The</strong> BIC criterion prefers snp5 to snp1 in allyield traits. This was seen especially on PY, where <strong>the</strong>likelihood for <strong>the</strong> model with only snp1 is much lowercompared to <strong>the</strong> model with only snp5 (Figure 5). <strong>The</strong>best model for P% 1st requires only snp1. For P% later bothSNPs are needed; however, <strong>the</strong> likelihood for <strong>the</strong> modelwith only snp5 is quite low. <strong>The</strong> BIC criterion stronglyprefers snp1 to snp5. <strong>The</strong> best model for F% 1st <strong>and</strong>F% later is <strong>the</strong> interaction model but as in P% <strong>the</strong> snp1effect is very important.DISCUSSIONWe herein report significant association <strong>of</strong> GHR<strong>and</strong> PRLR polymorphism for milk production traits inFinnish Ayrshire dairy cattle. <strong>The</strong> result is partly in goodagreement with <strong>the</strong> recently reported association <strong>of</strong> achromosomal region including GHR F279Y substitutionwith milk production traits in Holstein–Friesian cattle(Blott et al. 2003). In <strong>the</strong> Finnish Ayrshire population,GHR F279Y is associated with milk yield, proteinpercentage, <strong>and</strong> fat percentage. Moreover, <strong>the</strong> PRLRsubstitution S18N is clearly associated with milk yield,protein yield, <strong>and</strong> fat yield whereas no evidence for <strong>the</strong>association <strong>of</strong> PRLR variation <strong>and</strong> milk production was
GHR <strong>and</strong> PRLR Genes in Milk Production 2161TABLE 8Effects in data set I contained by vector b in <strong>the</strong> best modelas selected by l <strong>and</strong> BICTrait Criterion First lactationMilk yield l m s1 11 s1 12 s1 22 s2 11 s2 12 s2 22 s5 11s5 12 s5 22 s6 11 s6 12 s6 22 s13s6Milk yield BIC m s1 11 s1 12 s1 22 s2 11 s2 12 s2 22 s4 11s4 12 s4 22 s5 11 s5 12 s5 22 s6 11s6 12 s6 22Protein yield l m s1 11 s1 12 s1 22 s2 11 s2 12 s2 22 s4 11s4 12 s4 22 s5 11 s5 12 s5 22 s6 11 s6 12s6 22 s13s6Protein yield BIC m s5 11 s5 12 s5 22Fat yield l, BIC m s1 11 s1 12 s1 22 s2 11 s2 12 s2 22 s5 11s5 12 s5 22 s6 11 s6 12 s6 22Protein content l m s1 11 s1 12 s1 22 s4 11 s4 12 s4 22 s5 11s5 12 s5 22 s13s5Protein content BIC m s1 11 s1 12 s1 22Fat content l, BIC m s1 11 s1 12 s1 22Trait Criterion Later lactationsMilk yield l m s1 11 s1 12 s1 22 s2 11 s2 12 s2 22 s5 11s5 12 s5 22 s6 11 s6 12 s6 22 s13s6Milk yield BIC m s5 11 s5 12 s5 22Protein yield l m s1 11 s1 12 s1 22 s2 11 s2 12 s2 22 s5 11s5 12 s5 22 s6 11 s6 12 s6 22 s13s5Protein yield BIC m s5 11 s5 12 s5 22Fat yield l m s1 11 s1 12 s1 22 s4 11 s4 12 s4 22 s5 11s5 12 s5 22 s6 11 s6 12 s6 22 s13s5Fat yield BIC m s1 11 s1 12 s1 22 s2 11 s2 12 s2 22 s4 11s4 12 s4 22 s5 11 s5 12 s5 22 s6 11s6 12 s6 22Protein content l m s1 11 s1 12 s1 22 s2 11 s2 12 s2 22 s5 11s5 12 s5 22 s13s5Protein content BIC m s1 11 s1 12 s1 22Fat content l, BIC m s1 11 s1 12 s1 22 s2 11 s2 12 s2 22 s4 11s4 12 s4 22sX ij represents effects <strong>of</strong> <strong>the</strong> ijth genotype <strong>of</strong> <strong>the</strong> Xth SNP,s1 3 s5 <strong>and</strong> s1 3 s6 represent effects <strong>of</strong> interaction betweensnp1 <strong>and</strong>, respectively, snp5 <strong>and</strong> snp6.found in Holstein–Friesian cattle (Blott et al. 2003). Itis possible that <strong>the</strong> latter association exists in FinnishAyrshire but not in Holstein–Friesians. <strong>The</strong> discrepancy<strong>of</strong> <strong>the</strong> results might, however, originate ei<strong>the</strong>r from adifferent type <strong>of</strong> analysis or from <strong>the</strong> map position <strong>of</strong>PRLR used. In our study two PRLR SNPs causing <strong>the</strong>amino acid substitutions S18N <strong>and</strong> L186P were used inassociation analysis, whereas in Blott et al. (2003) aPRLR haplotype built from <strong>the</strong> PRLR S18N <strong>and</strong> fewintronic SNPs was used in combined linkage <strong>and</strong> LDanalysis. In addition, we provide here a new map positionfor PRLR differing from <strong>the</strong> one used in Blottet al. (2003).In Finnish Ayrshire four amino acid substitutionswere detected in GHR. F279Y stood out as <strong>the</strong> mostpromising c<strong>and</strong>idate for <strong>the</strong> effect because accordingto <strong>the</strong> multiple sequence alignments <strong>the</strong> phenylalanineTABLE 9Effects in data set II contained by vector b in <strong>the</strong> best modelas selected by l <strong>and</strong> BICTrait Criterion First lactationMilk yield l, BIC m s1 11 s1 12 s1 22 s5 11 s5 12 s5 22 s1 3 s5Protein yield l, BIC m s1 11 s1 12 s1 22 s5 11 s5 12 s5 22 s1 3 s5Fat yield l, BIC m s1 11 s1 12 s1 22 s5 11 s5 12 s5 22Protein content l, BIC m s1 11 s1 12 s1 22Fat content l, BIC m s1 11 s1 12 s1 22 s5 11 s5 12 s5 22 s1 3 s5Trait Criterion Later lactationsMilk yield l, BIC m s1 11 s1 12 s1 22 s5 11 s5 12 s5 22 s1 3 s5Protein yield l, BIC m s1 11 s1 12 s1 22 s5 11 s5 12 s5 22 s1 3 s5Fat yield l, BIC m s1 11 s1 12 s1 22 s5 11 s5 12 s5 22 s1 3 s5Protein content l, BIC m s1 11 s1 12 s1 22 s5 11 s5 12 s5 22Fat content l, BIC m s1 11 s1 12 s1 22 s5 11 s5 12 s1 3 s5sX ij represents effects <strong>of</strong> <strong>the</strong> ijth genotype <strong>of</strong> <strong>the</strong> Xth SNP,s1 3 s5 represents effect <strong>of</strong> interaction between snp1 <strong>and</strong>snp5.(F ) residue is highly conserved among mammals. Moreover,3 <strong>of</strong> 4 sires that are segregating for <strong>the</strong> QTL areheterozygous for <strong>the</strong> F279Y substitution. <strong>The</strong> remaining18 sires are homozygous for <strong>the</strong> F-allele. <strong>The</strong> amino acidpositions <strong>of</strong> o<strong>the</strong>r substitutions (N528T, A541S, <strong>and</strong>S555G) were less conserved among studied species;however, <strong>the</strong> serine residue at position 541 <strong>and</strong> <strong>the</strong>glycine residue at position 555 have been observedonly in B. taurus. In <strong>the</strong> Finnish Ayrshire population, <strong>the</strong>GHR amino acid substitutions exist as six differenthaplotypes (F-N-S-S, F-N-A-S, F-T-A-G, F-T-A-S, Y-N-A-S,<strong>and</strong>Y-T-A-G), two <strong>of</strong> which account for 71% <strong>of</strong> <strong>the</strong> chromosomes(F-N-A-S <strong>and</strong> F-T-A-S).In PRLR two contiguous SNPs generate an amino acidsubstitution S18N in <strong>the</strong> signal peptide <strong>of</strong> <strong>the</strong> protein<strong>and</strong> a single SNP in <strong>the</strong> extracellular domain leads to anamino acid substitution L186P. According to sequencealignment PRLR S18N was not as promising as <strong>the</strong> GHRF279Y because both serine <strong>and</strong> asparagine residues arecommonly seen at that position in different species. <strong>The</strong>second substitution L186P on <strong>the</strong> o<strong>the</strong>r h<strong>and</strong> seemedpromising because at <strong>the</strong> position <strong>of</strong> substitution glycineresidue is highly conserved among studied vertebratesexcept artiodactyls. However, 15 <strong>of</strong> 21 sires wereheterozygous for <strong>the</strong> L186P substitution.As a first step, conventional multimarker regressionanalysis with one- <strong>and</strong> two-QTL models was performed(Viitala et al. 2003). For that purpose a new densermarker map with additional microsatellites, GHR haplotype,<strong>and</strong> PRLR S18N was built. <strong>The</strong> GHR haplotypewe use in this study is not exactly <strong>the</strong> same as in Blottet al. (2003) because we have used only <strong>the</strong> SNPs causingamino acid substitutions in Finnish Ayrshire. <strong>The</strong> resultconfirms that, like in Holstein–Friesians, in FinnishAyrshire, <strong>the</strong>re is a QTL with strong effect on protein
2162 S. Viitala et al.Figure 5.—<strong>The</strong> natural logarithm<strong>of</strong> <strong>the</strong> likelihood for fitted models, respectively,from left to right: (a) modelwith b ¼ [m s1 (11) s1 (12) s1 (22) s5 (11)s5 (12) s5 (22) s1 3 s5] T , (b) model withb ¼ [m s1 (11) s1 (12) s1 (22) s5 (11) s5 (12)s5 (22) ] T , (c) model with b ¼ [m s1 (11)s1 (12) s1 (22) ] T , (d) model with b ¼ [ms5 (11) s5 (12) s5 (22) ] T , (e) model withb ¼ m. For each trait <strong>the</strong> left bar indicates<strong>the</strong> first lactation <strong>and</strong> <strong>the</strong> rightbar indicates later lactations.<strong>and</strong> fat content segregating on chromosome 20. Inaddition, in Finnish Ayrshire a QTL effect is also seen onmilk yield, protein yield, <strong>and</strong> fat yield. <strong>The</strong> effects couldbe due to two distinct QTL, as suggested by <strong>the</strong> two-QTLmodel.In <strong>the</strong> analysis <strong>of</strong> individual families four segregatingfamilies were identified. <strong>The</strong> gr<strong>and</strong>sires 12 <strong>and</strong> 14 arehalf-sibs <strong>and</strong> heterozygous for both c<strong>and</strong>idate genes(GHR haplotype, PRLRs S18N <strong>and</strong> L186P). In family 12<strong>the</strong> QTL effect is seen in MY, F%, <strong>and</strong> P% <strong>and</strong> in family14 in MY, F%, P%, <strong>and</strong> PY (Table 7). <strong>The</strong> genotypes <strong>of</strong>GHR haplotype are F-N-S-S/Y-N-A-S for gr<strong>and</strong>sire 12 <strong>and</strong>F-N-S-S/Y-T-A-G for gr<strong>and</strong>sire 14. In family 21 <strong>the</strong> effectis seen in F% <strong>and</strong> P%. Gr<strong>and</strong>sire 21 is heterozygous onlyfor <strong>the</strong> GHR haplotype (F-N-A-S/Y-N-A-S). <strong>The</strong> differencein <strong>the</strong> QTL effects between families 12 <strong>and</strong> 14 vs.21 may reflect <strong>the</strong> presence <strong>of</strong> different numbers <strong>of</strong>QTL segregating in <strong>the</strong>se families.In family 5 <strong>the</strong> QTL effect is seen in MY <strong>and</strong> PY. Thisfamily does not fit to <strong>the</strong> c<strong>and</strong>idate gene hypo<strong>the</strong>sissince <strong>the</strong> sire is homozygous for both genes for <strong>the</strong> allelescommon in <strong>the</strong> population (GHR, F-N-A-S/F-N-A-S<strong>and</strong> PRLR, S/S <strong>and</strong> L/L). A closer look at <strong>the</strong> data revealsthat <strong>the</strong> effect might originate from <strong>the</strong> maternalchromosomes (data not shown). It seems that a relativelylarge number <strong>of</strong> sons have inherited <strong>the</strong> rare GHR(Y-N-A-S or Y-T-A-G) <strong>and</strong>/or PRLR S18N (N)allelefrom<strong>the</strong>dam. By chance <strong>the</strong>se sons fall within <strong>the</strong> group havinginherited <strong>the</strong> same paternal chromosomal segment. Thisis probably causing a spurious effect within <strong>the</strong> family.Blott et al. (2003) suggested that <strong>the</strong> GHR F279Ysubstitution observed in Holstein–Friesians is ei<strong>the</strong>rdirectly responsible for <strong>the</strong> QTL effect or tightly associatedwith <strong>the</strong> causal mutation. <strong>The</strong> association <strong>of</strong> <strong>the</strong>GHR F279Y substitution (snp1) with milk content inFinnish Ayrshire is in good agreement with <strong>the</strong> observationsin Holstein–Friesian cattle. <strong>The</strong> snp1 effect wasclearly detected on protein [P% 1st , 2.04ŝ p <strong>and</strong> 1.35ŝ p ;P% later , 1.79ŝ p <strong>and</strong> 1.08ŝ p for genotypes FF (‘‘11’’) <strong>and</strong>FY (‘‘12’’), respectively] <strong>and</strong> fat percentages [F% 1st ,1.16ŝ p <strong>and</strong> 0.58ŝ p ;F% later , 1.25ŝ p <strong>and</strong> 0.61ŝ p for genotypesFF (11) <strong>and</strong> FY (12), respectively, as compared toYY (22)] <strong>and</strong> to some extent on milk yield at first lactation,where ŝ p is expressed by <strong>the</strong> observed st<strong>and</strong>arddeviations <strong>of</strong> DYDs. <strong>The</strong> o<strong>the</strong>r yield traits were notmarkedly affected by <strong>the</strong> F279Y mutation.In Finnish Ayrshire PRLR S18N mutation is significantlyassociated with all <strong>the</strong> yield traits, comprisingprotein [PY 1st , 1.41ŝ p <strong>and</strong> 1.17ŝ p ;PY later , 1.83ŝ p <strong>and</strong>2.02ŝ p for genotypes NN (11) <strong>and</strong> NS (12), respectively,as compared with SS (22)], fat [FY 1st , 0.93ŝ p <strong>and</strong> 1.46ŝ p ;FY later , 0.72ŝ p <strong>and</strong> 2.11ŝ p for genotypes NN (11) <strong>and</strong> NS(12), respectively] <strong>and</strong> milk [MY 1st , 0.91ŝ p <strong>and</strong> 1.22ŝ p ;MY later , 1.39ŝ p <strong>and</strong> 1.84ŝ p for genotypes NN (11) <strong>and</strong> NS(12), respectively]. <strong>The</strong> causal effects <strong>of</strong> <strong>the</strong> substitutionsare difficult to prove. According to <strong>the</strong> multiplesequence alignment <strong>the</strong> S18N substitution in <strong>the</strong> signalpeptide <strong>of</strong> PRLR is quite common in <strong>the</strong> studied species.<strong>The</strong> amino acid sequences <strong>of</strong> signal peptides arenot generally very conserved, except a certain hydrophobicpattern, which is not altered by <strong>the</strong> substitution.Ano<strong>the</strong>r tightly linked polymorphism could contribute<strong>the</strong> observed effects on yield traits, as well.As suggested by model comparison results it is possiblethat an interaction between GHR F279Y <strong>and</strong> PRLRS18N exists. <strong>The</strong> incorporation <strong>of</strong> interaction effect
GHR <strong>and</strong> PRLR Genes in Milk Production 2163into <strong>the</strong> model markedly influenced estimates <strong>of</strong> marginalSNP effects. On <strong>the</strong> o<strong>the</strong>r h<strong>and</strong>, because <strong>of</strong> lowfrequencies <strong>of</strong> genotypes with <strong>the</strong> less frequent allele,we anticipate that in our family data <strong>the</strong> power <strong>of</strong>detecting interaction <strong>and</strong> proper partitioning betweenmarginal <strong>and</strong> interaction effects is very low.In our family data seven sires are heterozygous forPRLR S18N but <strong>the</strong> QTL effect is segregating in only two<strong>of</strong> <strong>the</strong>se families. In <strong>the</strong>se families <strong>the</strong> sires are heterozygousalso for <strong>the</strong> GHR F279Y <strong>and</strong> thus one explanationcould be that <strong>the</strong> second QTL acts only as a modifier <strong>of</strong><strong>the</strong> first QTL so is detectable only through a model withQTL interaction.<strong>The</strong> association <strong>of</strong> GHR F279Y <strong>and</strong> PRLR S18N polymorphismwith milk production traits was confirmed onan independent sample <strong>of</strong> progeny-tested bulls (dataset II) not included in <strong>the</strong> family data. <strong>The</strong> result clearlymimics <strong>the</strong> genetic effects observed in data set I: <strong>the</strong>effect <strong>of</strong> PRLR S18N (snp5) predominates on yield traits<strong>and</strong> that <strong>of</strong> GHR F279Y (snp1) on content traits. <strong>The</strong>model with interaction terms is selected as a best modelin most <strong>of</strong> <strong>the</strong> traits.Blott et al. (2003) concluded that it is unlikely that<strong>the</strong> F279Y or tightly associated polymorphism accountsfor <strong>the</strong> entire chromosome 20 QTL effect in <strong>the</strong>Holstein–Friesian population. We herein suggest thatPRLR S18N or a polymorphism in strong LD with PRLRS18N is partly responsible for <strong>the</strong> effect seen in milktraits in Finnish Ayrshire. However, we cannot exclude<strong>the</strong> possibility that also additional loci are involved inchromosome 20 QTL effect.In this study <strong>the</strong> main focus is on <strong>the</strong> coding region<strong>of</strong> GHR <strong>and</strong> PRLR. In both cases <strong>the</strong> coding sequenceis only a minor part <strong>of</strong> <strong>the</strong> 80- to 100-kb gene, <strong>and</strong><strong>the</strong>refore <strong>the</strong> majority <strong>of</strong> <strong>the</strong> sequence remains unanalyzed.If <strong>the</strong> genomic orientation <strong>of</strong> bovine GHR <strong>and</strong>PRLR genes corresponds to <strong>the</strong> orientation <strong>of</strong> <strong>the</strong>human <strong>and</strong> mouse genes, <strong>the</strong>n it is possible that in <strong>the</strong>bovine genome <strong>the</strong> 59-untranslated regions <strong>of</strong> GHR <strong>and</strong>PRLR are facing on opposite str<strong>and</strong>s, at 7 Mb distancefrom each o<strong>the</strong>r. <strong>The</strong> 59 regulatory region <strong>of</strong> GHR islarge (.30 kb). For example, in bovine GHR threealternative promoters with untranslated exons have beenwell characterized (Hauser et al. 1990; Heap et al. 1996;Lucy et al. 1998; Jiang et al. 1999) <strong>and</strong> <strong>the</strong> existence <strong>of</strong>six o<strong>the</strong>r variants has been suggested (Jiang <strong>and</strong> Lucy2001). In this study we have sequenced <strong>the</strong> three wellcharacterizedpromoters <strong>of</strong> GHR without finding anysequence polymorphism in Finnish Ayrshire. Even though<strong>the</strong> majority <strong>of</strong> <strong>the</strong> GHR <strong>and</strong> PRLR sequences still needto be analyzed it is possible that o<strong>the</strong>r genes are atleast partly responsible for <strong>the</strong> effect. In <strong>the</strong> human genomicsequence <strong>the</strong>re are still tens <strong>of</strong> genes betweenGHR <strong>and</strong> PRLR, some with known <strong>and</strong> some withunknown functions.An interesting fact pointed out by Blott et al. (2003)is that <strong>the</strong> administration <strong>of</strong> growth hormone in lactatingcows affects mainly protein yield. <strong>The</strong> F279Y mutationis associated with milk yield, protein percentage,<strong>and</strong> fat percentage in Finnish Ayrshire but not withprotein yield. An association between yield traits <strong>and</strong>PRLR S18N was, however, observed. Both GH <strong>and</strong> PRLare essential hormonal factors regulating <strong>the</strong> development<strong>and</strong> differentiation <strong>of</strong> functional mammary gl<strong>and</strong>(reviewed by Kelly et al. 2002). <strong>The</strong> genes encodingPRL <strong>and</strong> GH have evolved from a common ancestralgene <strong>and</strong> <strong>the</strong>ir receptors (PRLR, GHR) are also closelyrelated. <strong>The</strong>se multifunctional hormones <strong>and</strong> <strong>the</strong>irreceptors have numerous actions <strong>and</strong> very complicatedregulation. Even though GH <strong>and</strong> PRL have clear <strong>and</strong>distinct hormonal functions <strong>the</strong>re appears to be extensiveoverlap in many respects (reviewed by Bole-Feysotet al. 1998 <strong>and</strong> Frank 2001). Interesting features make ittempting to speculate about <strong>the</strong> potential role <strong>of</strong> GH<strong>and</strong>/or PRL receptors in <strong>the</strong> observed associations.In <strong>the</strong> mammary gl<strong>and</strong>, PRL is <strong>the</strong> hormone primarilyresponsible for <strong>the</strong> syn<strong>the</strong>sis <strong>of</strong> milk proteins, lactose,<strong>and</strong> lipids, all major components <strong>of</strong> milk (see Bole-Feysot et al. 1998). This could <strong>of</strong>fer an explanation for<strong>the</strong> observed association with yield. <strong>The</strong> osmotic nature<strong>of</strong> milk lactose on <strong>the</strong> o<strong>the</strong>r h<strong>and</strong> <strong>of</strong>fers a temptingexplanation for <strong>the</strong> effect on milk yield <strong>and</strong> percentagetraits, because <strong>the</strong> percentage traits might reflect <strong>the</strong>amount <strong>of</strong> water in milk as <strong>the</strong> increase in milk watercontent decreases <strong>the</strong> proportion <strong>of</strong> milk solids. This is<strong>of</strong> course highly speculative.We herein report new evidence that <strong>the</strong> QTL effectson milk production traits on chromosome 20 in a FinnishAyrshire population can be explained by variation intwo distinct genes, GHR <strong>and</strong> PRLR. <strong>The</strong> result <strong>of</strong> ourmultimarker regression analysis suggests that in FinnishAyrshire two QTL segregate on <strong>the</strong> chromosomal regionincluding GHR <strong>and</strong> PRLR. Two substitutions showed anassociation with milk production traits: <strong>the</strong> previouslyreported F-to-Y substitution in <strong>the</strong> transmembrane domain<strong>of</strong> GHR <strong>and</strong> an S-to-N substitution at position 18 in<strong>the</strong> signal peptide <strong>of</strong> PRLR. <strong>The</strong> results provide strongevidence that <strong>the</strong> effect <strong>of</strong> PRLR S18N substitution isdistinct from <strong>the</strong> GHR F279Y effect. In particular, GHRF279Y has <strong>the</strong> highest influence on protein percentage<strong>and</strong> fat percentage while PRLR S18N markedly influencesprotein <strong>and</strong> fat yield. In addition, association analysissuggests interaction between <strong>the</strong>se two substitutions.We herein suggest that <strong>the</strong> observed substitutions areei<strong>the</strong>r directly responsible for <strong>the</strong> QTL effect or tightlyassociated with causal mutation.This work was funded by <strong>the</strong> Ministry <strong>of</strong> Agriculture <strong>and</strong> Forestry <strong>of</strong>Finl<strong>and</strong> (grant 5100/39/98), <strong>the</strong> European Union (grant BIO4-98-0471), <strong>and</strong> <strong>the</strong> Finnish Animal Breeding Association.LITERATURE CITEDArranz, J.-J., W. Coppieters, P.Berzi, N.Cambisano, B.Grisartet al., 1998 A QTL affecting milk yield <strong>and</strong> composition maps
2164 S. Viitala et al.to bovine chromosome 20: a confirmation. Anim. Genet. 29:107–115.Blott, S., J.-J. Kim,S.Moisio,A.Schmidt-Küntzel,A.Cornet et al.,2003 Molecular dissection <strong>of</strong> a quantitative trait locus: a phenylalanine-to-tyrosinesubstitution in <strong>the</strong> transmembrane domain <strong>of</strong><strong>the</strong> bovine growth hormone receptor is associated with a majoreffect on milk yield <strong>and</strong> composition. <strong>Genetics</strong> 163: 253–266.Bogdan, M., J. K. Ghosh <strong>and</strong> R. W. Doerge, 2004 Modifying <strong>the</strong>Schwarz Bayesian information criterion to locate multiple interactingquantitative trait loci. <strong>Genetics</strong> 167: 989–999.Bole-Feysot, C., V. G<strong>of</strong>fin, M.Edery, N.Binart <strong>and</strong> P. A. Kelly,1998 Prolactin (PRL) <strong>and</strong> its receptor: actions, signal transductionpathways <strong>and</strong> phenotypes observed in PRL receptor knockout mice. Endocrinol. Rev. 19: 225–268.Churchill, G. A., <strong>and</strong> R. W. Doerge, 1994 Empirical thresholdvalues for quantitative trait mapping. <strong>Genetics</strong> 138: 963–971.Dekkers, J. C. M., 2003 Commercial application <strong>of</strong> marker- <strong>and</strong> geneassistedselection in livestock: strategies <strong>and</strong> lessons, p. 4 in <strong>The</strong>Book <strong>of</strong> Abstracts <strong>of</strong> <strong>the</strong> 54th Annual Meeting <strong>of</strong> <strong>the</strong> European Associationfor Animal Production, edited by Y. van der Honing. WageningenAcademic Publishers, Wageningen, <strong>The</strong> Ne<strong>the</strong>rl<strong>and</strong>s.Frank, S. J., 2001 <strong>Growth</strong> hormone signalling <strong>and</strong> its regulation:preventing too much <strong>of</strong> a good thing. <strong>Growth</strong> Horm. IGF Res.11: 201–212.Georges,M.,D.Nielsen,M.Mackinnon,A.Mishra <strong>and</strong> R. Okimoto,1995 Mapping quantitative trait loci controlling milk productionin dairy cattle by exploiting progeny testing. <strong>Genetics</strong> 139: 907–920.Gibson, J. P., 2003 Incorporating molecular genetic information ina global approach to genetic improvement for low <strong>and</strong> mediuminput systems, p. 1 in <strong>The</strong> Book <strong>of</strong> Abstracts <strong>of</strong> <strong>the</strong> 54th AnnualMeeting <strong>of</strong> <strong>the</strong> European Association for Animal Production, editedbyY. van der Honing. Wageningen Academic Publishers, Wageningen,<strong>The</strong> Ne<strong>the</strong>rl<strong>and</strong>s.Green, P., K. Falls <strong>and</strong> S. Crooks, 1990 CRI-MAP DocumentationVersion 2.4 (http: /linkage.rockefeller.edu/s<strong>of</strong>t/crimap/).Grisart, B., W. Coppieters, F.Farnir, L.Karim, C.Ford et al.,2002 Positional c<strong>and</strong>idate cloning <strong>of</strong> a QTL in dairy cattle:identification <strong>of</strong> a missense mutation in <strong>the</strong> bovine DGAT1 genewith major effect on milk yield <strong>and</strong> composition. Genome Res.12: 222–231.Hauser, S. D., M. F. McGrath, R. J. Collier <strong>and</strong> G. G. Krivi,1990 Cloning <strong>and</strong> in vivo expression <strong>of</strong> bovine growth hormonereceptor mRNA. Mol. Cell. Endocrinol. 72: 187–200.Heap, D., R. J. Collier, C.K.Boyd <strong>and</strong> M. C. Lucy, 1996 Expression<strong>of</strong> alternate growth hormone receptor messenger RNAin ovary <strong>and</strong> uterus <strong>of</strong> cattle. Domest. Anim. Endocrinol. 13:421–430.Jiang,H.,<strong>and</strong>M.C.Lucy, 2001 Variants <strong>of</strong> <strong>the</strong> 59-untranslated region<strong>of</strong> <strong>the</strong> bovine growth hormone receptor mRNA: isolation, expression<strong>and</strong> effects on translational efficiency. Gene 265: 45–53.Jiang, H., C. S. Okamura <strong>and</strong> M. C. Lucy, 1999 Isolation <strong>and</strong> characterization<strong>of</strong> a novel promoter for <strong>the</strong> bovine growth hormonereceptor gene. J. Biol. Chem. 274: 7893–7900.Kelly, P. A., A. Bachelot, C. Kedzia, L. Hennighausen, C. J.Orm<strong>and</strong>y et al., 2002 <strong>The</strong> role <strong>of</strong> prolactin <strong>and</strong> growth hormonein mammary gl<strong>and</strong> development. Mol. Cell. Endocrinol.197: 127–131.Khatkar, M. S., P. C. Thomson, I. Tammen <strong>and</strong> H. Raadsma,2004 Quantitative trait loci mapping in dairy cattle: review<strong>and</strong> meta-analysis. Genet. Sel. Evol. 36: 163–190.Knott, S. A., J. M. Elsen <strong>and</strong> C. S. Haley, 1996 Methods formultiple-marker mapping <strong>of</strong> quantitative trait loci in half-sib populations.<strong>The</strong>or. Appl. Genet. 93: 71–80.Lidauer, M., E. A. Mäntysaari, I. Str<strong>and</strong>én <strong>and</strong> J. Pösö,2000 Multiple-trait r<strong>and</strong>om regression test-day model for all lactations.INTERBULL Open Meeting, Bled, Slovenia, May 14–15.Bulletin <strong>of</strong> <strong>the</strong> 25th International Bull Evaluation Service, Uppsala,Sweden, pp. 81–86.Lucy, M. C., C. K. Boyd, A.T.Koenigsfeld <strong>and</strong> C. S. Okamura,1998 Expression <strong>of</strong> somatotropin receptor messenger ribonucleicacid in bovine tissue. J. Dairy Sci. 81: 1889–1895.Meuwissen, T. H., A. Karlsen, S. Lien, I. Olsaker <strong>and</strong> M. E.Goddard, 2002 Fine mapping <strong>of</strong> a quantitative trait locus fortwinning rate using combined linkage <strong>and</strong> linkage disequilibriummapping. <strong>Genetics</strong> 161: 373–379.Mosig, M. O., E. Lipkin, G. Khutoreskaya, E. Tchourzyna,M. Soller et al., 2001 A whole genome scan for quantitativetrait loci affecting milk protein percentage in Israeli-Holstein cattle,by means <strong>of</strong> selective milk DNA pooling in a daughter design,using an adjusted false discovery rate criterion. <strong>Genetics</strong> 157:1683–1698.Mrode, R. A., <strong>and</strong> G. J. T. Swanson, 2004 Calculating cow <strong>and</strong>daughter yield deviations <strong>and</strong> partitioning <strong>of</strong> genetic evaluationsunder a r<strong>and</strong>om regression model. Livest. Prod. Sci. 86: 253–260.Schwarz, G., 1978 Estimating <strong>the</strong> dimension <strong>of</strong> a model. Ann. Stat.6: 461–464.Seaton, G.,C.S.Haley, S.A.Knott, M.Kearsey <strong>and</strong> P. M. Visscher,2002 QTL Express: mapping quantitative trait loci in simple<strong>and</strong> complex pedigrees. Bioinformatics 18: 339–340.Spelman, R. J., W. Coppieters, L.Karim, J.A.van Arendonk <strong>and</strong>H. Bovenhuis, 1996 Quantitative trait loci analysis for five milkproduction traits on chromosome six in <strong>the</strong> Dutch Holstein–Friesian population. <strong>Genetics</strong> 144: 1799–1808.Velmala, R. J., H. J. Vilkki,K.T.Elo, D.-J. de Koning <strong>and</strong> A. V. Maki-Tanila, 1999 A search for quantitative trait loci for milk productiontraits on chromosome 6 in Finnish Ayrshire cattle. Anim.Genet. 30: 136–143.Verbeke, G., <strong>and</strong> G. Molenberghs, 1997 Linear Mixed Models inPractice. A SAS Oriented Approach. Springer, New York.Viitala, S. M., N. F. Schulman, D.-J. de Koning, K.Elo, R.Kinoset al., 2003 Quantitative trait loci affecting milk productiontraits in Finnish Ayrshire dairy cattle. J. Dairy Sci. 86: 1828–1836.Vilkki, H. J., D. J. de Koning, K.Elo, R.Velmala <strong>and</strong> A. Maki-Tanila, 1997 Multiple marker mapping <strong>of</strong> quantitative traitloci <strong>of</strong> Finnish dairy cattle by regression. J. Dairy Sci. 80: 198–204.Warren, W., T. P. Smith, C.E.Rexroad, III, S. C. Fahrenkrug,T. Allison et al., 2000 Construction <strong>and</strong> characterization <strong>of</strong>a new bovine bacterial artificial chromosome library with 10genome-equivalent coverage. Mamm. Genome 11: 662–663.Zadworny, D., <strong>and</strong> U. Kuhnlein, 1990 <strong>The</strong> identification <strong>of</strong> kappacaseingenotype in Holstein dairy cattle using <strong>the</strong> polymerasechain reaction. <strong>The</strong>or. Appl. Genet. 80: 631–634.Communicating editor: C. Haley