2010 - Characterization of Tensile Properties of Optical Fibers ... - DSM
2010 - Characterization of Tensile Properties of Optical Fibers ... - DSM
2010 - Characterization of Tensile Properties of Optical Fibers ... - DSM

You also want an ePaper? Increase the reach of your titles
YUMPU automatically turns print PDFs into web optimized ePapers that Google loves.
fiber (pullout force) are two key properties which affect opticalfiber performance. Testing results for these two key properties areshown in Figure 1.The primary coating in-situ modulus for fibers X1-3 and X2-3 aremuch lower than that for other fibers and are in the range between0.3 and 0.4 MPa. These two fibers have the same coating system3. The coating system 2 on fiber X1-2 and X2-2 has a primarycoating in-situ modulus around 1MPa while the coating system 1on fiber X1-1 and X4-1 has a primary coating in-situ modulus1.2MPa or above.It is also interesting to see the relatively good correlation betweenprimary coating in-situ modulus and primary coating adhesion toglass fiber for these 6 fibers. For example, fiber X2-3 have thelowest pullout force <strong>of</strong> 0.92lbs and lowest primary coating in-situmodulus <strong>of</strong> 0.35MPa. The implication <strong>of</strong> low primary coating insitumodulus and low adhesion force to glass fiber will berevisited in the later section for optical fiber tensile test.Results for secondary coating in-situ modulus and strip force areillustrated in Figure 2 since secondary coating plays a dominanteffect on optical fiber strip force. It makes sense to look at themtogether to get a more comprehensive view <strong>of</strong> secondary coatingproperties.system 3 as X1-3, has the highest n d value <strong>of</strong> 28.3. X4-1 has thelowest n d value <strong>of</strong> 19.5. S.E.E., which is shown in Table 3 and 4,or Standard Error <strong>of</strong> the Estimated slope is computed by using alinear model to regress the log <strong>of</strong> failure stress vs. the log <strong>of</strong> thestress rate. Low S.E.E. values (>0.0017). It is very interesting to see that all 3 sites could not getmeaningful fatigue result due to the complications happenedduring the testing. In addition to dynamic fatigue results fromtensile testing, Table 4 also included dynamic fatigue results fromtwo-point bending for the ease <strong>of</strong> comparison.Relatively good correlation <strong>of</strong> dynamic fatigue results, althoughnot very consistent, between two-point bending and tensile testingwas found. For example, similar low n d values (~20) wereobtained for X4-1 from these two types <strong>of</strong> testing. It is interestingto see that X1-2 and X2-2 have a n d value about 25 from tensiletest at all three sites. However, the n d values from 2-point bendingfor X1-2 and X2-2 show significant difference.The relatively high n d values for most fibers are probably relatedto their relatively long aging time (more than 1 year after drawn).International Wire & Cable Symposium 244 Proceedings <strong>of</strong> the 59th IWCS/IICIT
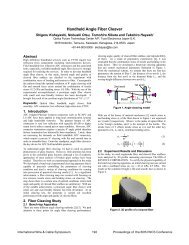
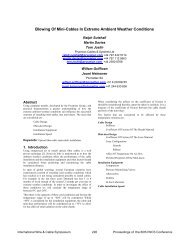
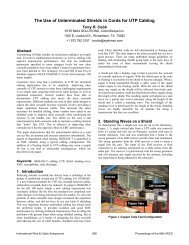
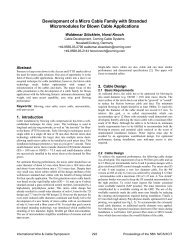
<strong>Tensile</strong> strength results are shown in Figure 3 and 4. The moststriking observation for Figure 3 is the big difference <strong>of</strong> medianstrength for X2-3 between site A, and site B or C. Similarly, forX1-3, which has the same coating system as X2-3, median tensilestrength at site A is significantly higher than that for site B or C.Such a trend can not apply to other fibers (coating systems). Thelow m (Weibull dynamic shape parameter) values for X1-3 andX2-3 shown in Figure 4 suggest that more data scattering wereobserved for fibers coated with coating system 3 (new generationcoating system). The relatively higher median tensile strength forX1-3 and X2-3 at sites A is probably related to its capstandiameter and clamping method. To gain more insight to thisobservation, a comparison <strong>of</strong> tensile strength for X2-3 between 3sites (see Figure 5) illustrates the difference. It is clear that site Bhad most data scattering and description <strong>of</strong> the results with theWeibull statistics is questionable.appendix to FOTP-28 covering various suggestions on thesubject, but was directly seen to be a bigger difficulty for s<strong>of</strong>tprimary coatings when site A made the change to new generationcoating system.5.550% tensile strength [GPa]m (Weibull dynamic shape parameter)5.04.54.03.53.0A B C A B C A B C A B C A B C A B CX1-1 X1-2 X1-3 X2-2 X2-3 X4-1Figure 3. Median tensile strength (at strain rate <strong>of</strong>2.5%/min) comparison at different testing sites1<strong>2010</strong>0806040200A B C A B C A B C A B C A B C A B CX1-1 X1-2 X1-3 X2-2 X2-3 X4-1Figure 4. Weibull dynamic shape parameter(at strain rate<strong>of</strong> 2.5%/min) comparison at different testing sitesIt has been found that the optical fiber having s<strong>of</strong>t primary coating(primary coating in-situ modulus < 0.4 MPa) highlighted a testingdifficulty, namely how best to grip the fiber in the tensile testingapparatus and so to obtain an accurate Weibull break stressdistribution. This problem is not reserved specifically for fiberwith low modulus primary coating, as illustrated by the largeFigure 5. X2-3 tensile strength (at strain rate <strong>of</strong> 2.5%/min)comparison between sitesSite A conducts the 0.5 meter tensile test at 5%/min strain rate.Formerly, 60mm capstans were attached to the fixed plates andthe moving plates <strong>of</strong> the tensile testing machine. With the olderhigh modulus primary coatings this arrangement was not found toaffect the Weibull distribution measured by the test. When thes<strong>of</strong>t primary coatings were in development, the results <strong>of</strong> tensiletests showed that an artificial effect was introduced into theWeibull distribution, so that the median tensile strength wassignificantly reduced.In the test, the fiber specimens are wrapped around each capstan 4to 5 turns and the ends taped down. Then, as the fiber is strainedto break the increasing tension in the fiber places the fiber in astate <strong>of</strong> increasing stress directed radially towards the capstans.The simple relation for this radial pressure <strong>of</strong> the fiber on thecapstan isP = T(1)Rwhere P is the linear pressure the fiber exerts on the capstan, T thetension in the fiber and R the capstan radius.Linear pressure is plotted versus fiber tension in Figure 6 for twocapstan sizes, the 60 mm diameter capstan that was in use and fora 100 mm capstan diameter.The green region in Figure 6 is set on the X-axis in the generalrange in which the fiber with s<strong>of</strong>t primary coating was observedto be breaking. Normally the range had been 62~66 N with highermodulus coatings. It is seen that this region corresponds to amaximum linear pressure on the capstan in the general range <strong>of</strong>1600 to 1800 N/m. That linear pressure was taken to be the levelwhere destruction <strong>of</strong> the s<strong>of</strong>t primary dual coating system couldoccur, opening the bare fiber to the atmosphere, causingpremature breaking <strong>of</strong> the fiber in the test.International Wire & Cable Symposium 245 Proceedings <strong>of</strong> the 59th IWCS/IICIT
Linear Pressure, N/m300028002600240022002000180016001400120010008006004002000LINEAR PRESSURE ON FIBER WITH 2 MANDREL SIZES60 mm diameter100 mm diameter0 10 20 30 40 50 60 70Fiber Tension, NFigure 6. Linear pressure <strong>of</strong> the fiber on the capstan inthe last turn before the gauge length, plotted as afunction <strong>of</strong> increasing fiber tension (two capstandiameters are considered)To solve the problem, the capstan diameter was increased to100 mm. Figure 6 shows that the linear pressure region thatdamages the coating is not reached until well above 70Nwith this diameter capstan. In practice, the fiber with s<strong>of</strong>tcoating could be tested successfully at 5%/min strain rate aslong as this diameter capstan was used, and would givetensile strength similar to observed with the older highmodulus coatings.Table 2 shows that site B uses the capstan with the smallestdiameter <strong>of</strong> 80 mm among the three sites. This seems toexplain the problem experienced at site B with this newgeneration coating system (coating system 3). Although siteA and C use capstans with the same diameter <strong>of</strong> 100mm, theclamping method in site A might give it an edge to handlethe more challenging coating system 3. According to AnnexC <strong>of</strong> FOTP-28, a double-sided tape is recommended forcovering the capstan. Any slippage <strong>of</strong> the fiber then tends tobe steady due to the viscous nature <strong>of</strong> the adhesion. Nonadhesivefriction tape can lead to stick-slip conditions.Figure 7. X1-2 site B dynamic fatigue raw data curves at25%/min strain rateIn summary, testing issue was found for fibers coated withcoating system 3 (new generation coating system). This testingissue is more significant at lower strain rate.3.3 DiscussionTo better understand the tensile testing difficulty fordynamic fatigue, raw data curves at different strain rates areshown in Figure 7, 8, and 9.Almost perfect curves were obtained with X1-2 by site B atthe strain rate <strong>of</strong> 25%/min (see Figure 7). However, site Bstarted to experience problem with X1-3 (new generationcoating system) at the strain rate <strong>of</strong> 2.5%/min. Some curvesin Figure 8 suggest irregular slipping happened during thetest. The worst situation was observed for X1-3 at the strainrate 0.025%/min in Figure 9. Most raw data curves in Figure9 show slipping problem. Similar observation for X2-3 wasreported from site B.Figure 8. X1-3 site B dynamic fatigue raw data curves at2.5%/min strain rateDynamic fatigue result overlay, shown in Figure 10 and 11,confirmed similar observation in site A and C to that in site B.X2-2 results were included to use as the reference. It is clear thatX2-2 behave normally at both site A and C. However, X2-3,which was coated with new generation coating system 3, showsclear testing issue. It happens at all 4 strain rates. Similar to siteB, this testing issue is more significant at lower strain rate.International Wire & Cable Symposium 246 Proceedings <strong>of</strong> the 59th IWCS/IICIT
Figure 9. X1-3 site B dynamic fatigue raw data curves at0.025%/min strain rateFigure 11. Site C dynamic fatigue results overlay for X2-3and X2-2Based on observations in 3 testing sites, fibers (X1-3 and X2-3)show similar tensile testing issues at all three sites. The testingissue is more obvious at lower strain rate. It seems to relate tonew generation coating system (coating system 3).If we recall in-situ properties <strong>of</strong> these fibers, lower primarycoating in-situ modulus and lower pullout force are the mostsignificant difference <strong>of</strong> coating system 3 from other coatingsystems.Figure 12 and 13 are microscopic pictures <strong>of</strong> a section <strong>of</strong> X2-3,which was taken from the capstan after tensile test. A spiraltype <strong>of</strong> deformation <strong>of</strong> coating layer can be observed on Figure12. The dark "ribbon" like structure suggest delamination <strong>of</strong>primary coating from glass fiber. The spiral structure suggeststhat this section <strong>of</strong> fibers was undergoing a combineddeformation <strong>of</strong> slipping and twisting on top <strong>of</strong> the capstan.Figure 13 shows another typical problem experienced duringthe test. A section <strong>of</strong> coating layers was stripped <strong>of</strong>f from theglass fiber. This reminded us <strong>of</strong> the observation from a typicalpull out force test where the glass fiber slips through thecoatings. The dark area between primary coating layer and glassfiber at the right hand side <strong>of</strong> pictures <strong>of</strong> Figure 13 suggests thatdelamination happened in that area. These observations suggestthat the observed testing issue with coating system 3 is relatedto the delamination <strong>of</strong> coating layer from glass fiber due to thevery larger shear stress applied during the tensile test. However,more investigation is needed to understand the mechanismsrelated to all failure modes.Figure 10. Site A dynamic fatigue results overlay for X2-3and X2-2Figure 12. Delamination and deformation <strong>of</strong> coatinglayers <strong>of</strong> X2-3 after tensile test at 2.5%/min strain rate(40X, picture on the left; 100X, picture on the right)International Wire & Cable Symposium 247 Proceedings <strong>of</strong> the 59th IWCS/IICIT
Table 5. <strong>Tensile</strong> strength results <strong>of</strong> X2-3Figure 13. Tube-<strong>of</strong>f and delamination <strong>of</strong> coating layers <strong>of</strong>X2-3 after tensile test at 2.5%/min strain rate (40X, pictureon the left; 100X, picture on the right)A testing method proposed by Dr. John Matthewson (FiberSigma) helped us correctly characterize the tensile properties <strong>of</strong>the most challenging fiber (X2-3) at strain rate <strong>of</strong> 2.5%/min. Adiagram <strong>of</strong> this method is shown in Figure 14.Figure 15. X2-3 tensile strength (at strain rate <strong>of</strong>2.5%/min) comparison between sites (updated withresults obtained with a new method)Figure 14. Schematic <strong>of</strong> an improved tensile test set up(courtesy <strong>of</strong> Dr. John Matthewson <strong>of</strong> Fiber Sigma)Two pieces <strong>of</strong> masking tape were used in the schematic shown inFigure 14. The first piece is adhesive out and the second pieceadhesive in so that the fiber is sandwiched between both adhesivesurfaces. After the fiber breaks one can pull the tape apart to seewhere it failed (it is pretty obvious where the origin is). Thismethod effectively reduces the chance that the fibers arescratched on the capstan, especially where the fiber goes onto thecapstan.Figure 15 is an updated chart <strong>of</strong> Figure 5 with the results obtainedby this improved method. Legend "Site C improved" denotes forthe results with the improved test method. It clearly demonstratedthat this improved method effectively reduced data scattering andincreased failure stress. The summary <strong>of</strong> tensile strength results <strong>of</strong>X2-3 in Table 5 shows that 50% tensile strength <strong>of</strong> X2-3 isimproved from 4.01 GPa to 5.03 GPa at site C through theimproved test method. A Weibull dynamic shape parameter <strong>of</strong>116.2 suggests that the issue with data scattering is essentially"removed".A continued effort is ongoing to evaluate X2-3 tensile propertiesat other strain rates to decide stress corrosion parameter nd.4. ConclusionsThis study compared dynamic fatigue behavior between differentcoating systems, different test methods, and different sites. <strong>Fibers</strong>coated with a new generation coating system performed best with2-point bending test. It was very difficult to obtain meaningful n dvalue due to the testing issue with tensile test. This testing issuewas confirmed at all three testing sites and is believed to relate tothe unique property <strong>of</strong> this new generation coating system. Animproved test method was able to effectively address the testingissue, at least at the strain rate <strong>of</strong> 2.5%/min. More effort isongoing to evaluate this new method.Although relatively good correlation between 2-point bendingmethod and tensile method was found, it is wise to use 2-pointbending method to characterize dynamic fatigue performance,especially for fibers coated with new generation coating system.The additional scatter introduced by the traditional tensilemethods detracts from the accuracy <strong>of</strong> the fatigue parameterestimate. However, with proper modification to address thegripping <strong>of</strong> fiber, as shown in Section 3, this test may yet yieldsimilar results to that <strong>of</strong> 2-point bending. In addition, for bendinsensitive fiber, the bending mode by 2-point bending methodsimulates the field application condition.International Wire & Cable Symposium 248 Proceedings <strong>of</strong> the 59th IWCS/IICIT
5. AcknowledgmentsThis collective study would not be possible without thecollaboration <strong>of</strong> many people. The authors would like to thankMike Scianna, Todd Gantt, Hersh Agnihotri, Tracy Woodward,Loretta Lawrence, Todd Anderson, Kate Roberts, and Ken Dakefor their help in testing.Jackie Zhao, Brett Register, and Jonathan Spragg provided help toset up tensile test in Elgin site. We greatly appreciate their help.The authors would also like to express their appreciation to Dr.Bertil Arvidsson (<strong>Fibers</strong>on AB), Dr. John Matthewson (FiberSigma), Dr. Paul Steeman, and Dr. Huimin Cao for the insightthey provided through discussions. We especially appreciate Dr.John Matthewson whose unique test setup not only helped uscorrectly evaluate tensile properties <strong>of</strong> optical fiber coated with anewest generation coating but also provide insightful info tounderstand the failure mode during tensile test.6. References[1] G. M. Camilo, “Qualitative Comparison Between 2-PointBending and <strong>Tensile</strong> Tests in <strong>Optical</strong> <strong>Fibers</strong>”, SBMO/IEEEMTT-S IMOC 1999 Proceedings, pp. 286-289 (1999).[2] Vincenzo V Rondinella and M. John Matthewson, “Effect<strong>of</strong> Loading Mode and Coating on Dynamic Fatigue <strong>of</strong> <strong>Optical</strong>Fiber in Two-Point Bending”, J. Am. Ceram. Soc. 76(1), pp.139-144 (1993).[3] C.P. Chen, T.H. Chang, “Fracture mechanics evaluation <strong>of</strong>optical fibers”, Materials Chemistry and Physics, 77, pp. 110–116 (2002).[4] S. Bhaumik, “Effect <strong>of</strong> humidity <strong>of</strong> drawing environmenton dynamic fatigue <strong>of</strong> polymer coated high strength silicaoptical fiber”, White Paper WP0013, Sterlite TechnologiesLimited.[5] P. Steeman, J. Slot, H. van Melick, A. Ven, H. Cao, R.Johnson, “Mechanical Analysis <strong>of</strong> the In-Situ Primary CoatingModulus Test for <strong>Optical</strong> <strong>Fibers</strong>”, 52th IWCS Proceedings,246-251 (2003).7. Author InformationDr. Long Han is a seniorscientist in the Fiber OpticMaterials Group and a six sigmablack belt. He joined <strong>DSM</strong>Desotech in 2005 and wasinvolved in the liquid and solidrheological characterization,statistical analysis and design <strong>of</strong>experiments. He has a Ph.D.degree in Chemical Engineeringfrom West Virginia Universityin 2005, an M.S. Degree in Statistics from West Virginia Universityand a B.S. Degree in Chemical Engineering from TsinghuaUniversity.Dr. Xiaosong Wu had a B.Sc. in Polymer Chemistryfrom University <strong>of</strong> Scienceand Technology <strong>of</strong> China in1993. In 2000, he obtained aPh.D. in PhotochemicalSciences from BowlingGreen State University inOhio. In the same year, hejoined <strong>DSM</strong> Desotech, Inc.as a research scientist. Currently, he is the Technical Team Leaderin the department <strong>of</strong> Fiber <strong>Optical</strong> Materials (FOM).Steve Schmid is currentlyDirector <strong>of</strong> Research andDevelopment for the FiberOptic Materials Group.Previously, he held positionsin product management,market development andbusiness management. Heholds a B.S. Degree inChemistry from the University<strong>of</strong> Illinois, a M.S. Degree in Chemistry from the University <strong>of</strong>Houston and M.B.A. from IIT. He has over 30 years experiencein the UV coatings industry and has authored over a dozen papers,been awarded 10 patents and made several internationalpresentations. He was a co-recipient <strong>of</strong> an IR100 Award in 1987and also a co-recipient <strong>of</strong> <strong>DSM</strong>’s Special Inventor Award in 2001.Pratik Shah is a Global TechnicalServices and ApplicationsManager in the Fiber OpticMaterials Group. He has a B.S. inPolymer engineering from PuneUniversity, MS in Plasticsengineering from University <strong>of</strong>Massachusetts and an M.B.A.degree from Anderson School <strong>of</strong>Management. He is a winner <strong>of</strong>R&D 100 award in the year2008. He is (co)author <strong>of</strong> 4 U.S. patents and 10 publications.Bob Overton is a SeniorPrincipal Scientist with DrakaCommunications. He holds aBS in Chemistry from MercerUniversity and a MS inChemical Engineering fromthe Georgia Institute <strong>of</strong>Technology. He worked withAT&T Bell Laboratories from1980 to 1991 in optical fibercoatings and cable materials.From 1991 to the present hehas managed the Coatings Technology Group with Alcatel andDraka Communications, and the Cable Materials TechnologyGroup from 2002 to 2008. He has received 40 patents in thefields <strong>of</strong> optical fiber coatings, cable materials, and processes.Email: bob.overton@draka.comInternational Wire & Cable Symposium 249 Proceedings <strong>of</strong> the 59th IWCS/IICIT