PDF - 1MB - Truworths
PDF - 1MB - Truworths
PDF - 1MB - Truworths
You also want an ePaper? Increase the reach of your titles
YUMPU automatically turns print PDFs into web optimized ePapers that Google loves.
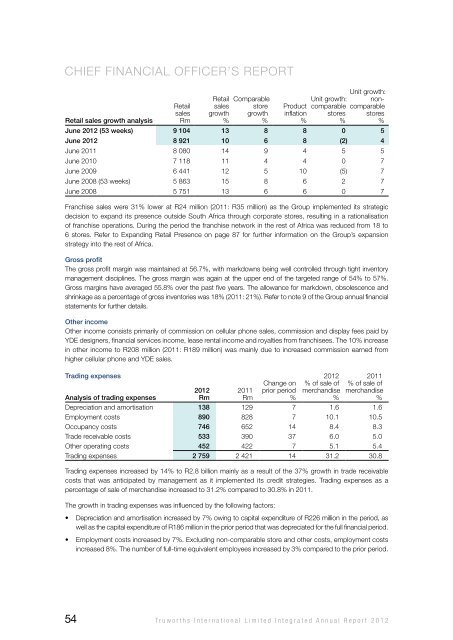
Chief financial officer’s reportRetailsalesgrowth%Comparablestoregrowth%Unit growth:comparablestores%Unit growth:noncomparablestores%Retail sales growth analysisRetailsalesRmProductinflation%June 2012 (53 weeks) 9 104 13 8 8 0 5June 2012 8 921 10 6 8 (2) 4June 2011 8 080 14 9 4 5 5June 2010 7 118 11 4 4 0 7June 2009 6 441 12 5 10 (5) 7June 2008 (53 weeks) 5 863 15 8 6 2 7June 2008 5 751 13 6 6 0 7Franchise sales were 31% lower at R24 million (2011: R35 million) as the Group implemented its strategicdecision to expand its presence outside South Africa through corporate stores, resulting in a rationalisationof franchise operations. During the period the franchise network in the rest of Africa was reduced from 18 to6 stores. Refer to Expanding Retail Presence on page 87 for further information on the Group’s expansionstrategy into the rest of Africa.Gross profitThe gross profit margin was maintained at 56.7%, with markdowns being well controlled through tight inventorymanagement disciplines. The gross margin was again at the upper end of the targeted range of 54% to 57%.Gross margins have averaged 55.8% over the past five years. The allowance for markdown, obsolescence andshrinkage as a percentage of gross inventories was 18% (2011: 21%). Refer to note 9 of the Group annual financialstatements for further details.Other incomeOther income consists primarily of commission on cellular phone sales, commission and display fees paid byYDE designers, financial services income, lease rental income and royalties from franchisees. The 10% increasein other income to R208 million (2011: R189 million) was mainly due to increased commission earned fromhigher cellular phone and YDE sales.Trading expensesAnalysis of trading expenses2012Rm2011RmChange onprior period%2012% of sale ofmerchandise%2011% of sale ofmerchandise%Depreciation and amortisation 138 129 7 1.6 1.6Employment costs 890 828 7 10.1 10.5Occupancy costs 746 652 14 8.4 8.3Trade receivable costs 533 390 37 6.0 5.0Other operating costs 452 422 7 5.1 5.4Trading expenses 2 759 2 421 14 31.2 30.8Trading expenses increased by 14% to R2.8 billion mainly as a result of the 37% growth in trade receivablecosts that was anticipated by management as it implemented its credit strategies. Trading expenses as apercentage of sale of merchandise increased to 31.2% compared to 30.8% in 2011.The growth in trading expenses was influenced by the following factors:• Depreciation and amortisation increased by 7% owing to capital expenditure of R226 million in the period, aswell as the capital expenditure of R186 million in the prior period that was depreciated for the full financial period.• Employment costs increased by 7%. Excluding non-comparable store and other costs, employment costsincreased 8%. The number of full-time equivalent employees increased by 3% compared to the prior period.54<strong>Truworths</strong> International Limited Integrated Annual Report 2012


