PDF - 1MB - Truworths
PDF - 1MB - Truworths
PDF - 1MB - Truworths

Create successful ePaper yourself
Turn your PDF publications into a flip-book with our unique Google optimized e-Paper software.
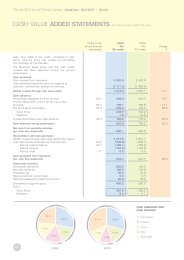
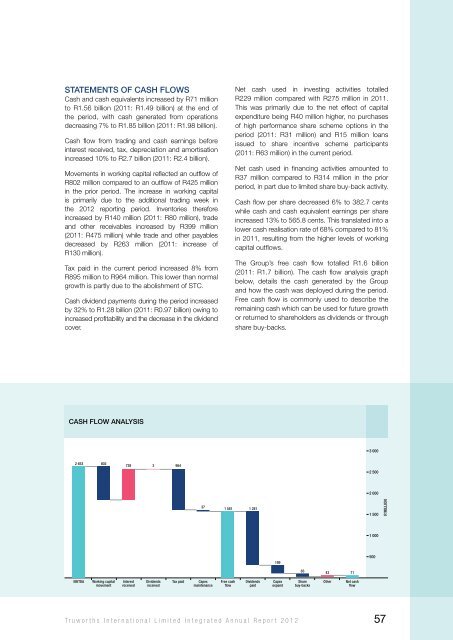
STATEMENTS OF CASH FLOWSCash and cash equivalents increased by R71 millionto R1.56 billion (2011: R1.49 billion) at the end ofthe period, with cash generated from operationsdecreasing 7% to R1.85 billion (2011: R1.98 billion).Cash flow from trading and cash earnings beforeinterest received, tax, depreciation and amortisationincreased 10% to R2.7 billion (2011: R2.4 billion).Movements in working capital reflected an outflow ofR802 million compared to an outflow of R425 millionin the prior period. The increase in working capitalis primarily due to the additional trading week inthe 2012 reporting period. Inventories thereforeincreased by R140 million (2011: R80 million), tradeand other receivables increased by R399 million(2011: R475 million) while trade and other payablesdecreased by R263 million (2011: increase ofR130 million).Tax paid in the current period increased 8% fromR895 million to R964 million. This lower than normalgrowth is partly due to the abolishment of STC.Cash dividend payments during the period increasedby 32% to R1.28 billion (2011: R0.97 billion) owing toincreased profitability and the decrease in the dividendcover.Net cash used in investing activities totalledR229 million compared with R275 million in 2011.This was primarily due to the net effect of capitalexpenditure being R40 million higher, no purchasesof high performance share scheme options in theperiod (2011: R31 million) and R15 million loansissued to share incentive scheme participants(2011: R63 million) in the current period.Net cash used in financing activities amounted toR37 million compared to R314 million in the priorperiod, in part due to limited share buy-back activity.Cash flow per share decreased 6% to 382.7 centswhile cash and cash equivalent earnings per shareincreased 13% to 565.8 cents. This translated into alower cash realisation rate of 68% compared to 81%in 2011, resulting from the higher levels of workingcapital outflows.The Group’s free cash flow totalled R1.6 billion(2011: R1.7 billion). The cash flow analysis graphbelow, details the cash generated by the Groupand how the cash was deployed during the period.Free cash flow is commonly used to describe theremaining cash which can be used for future growthor returned to shareholders as dividends or throughshare buy-backs.CASH FLOW ANALYSIS3 0002 653 802728 3 9642 5002 000371 581 1 2811 500R’MILLION1 0001895008343 71EBITDAWorking capitalmovementInterestreceivedDividendsreceivedTax paidCapexmaintenanceFree cashflowDividendspaidCapexexpandSharebuy-backsOtherNet cashflow<strong>Truworths</strong> International Limited Integrated Annual Report 2012 57