Insight Psychometrics Technical Manual - Canadian Test Centre
Insight Psychometrics Technical Manual - Canadian Test Centre
Insight Psychometrics Technical Manual - Canadian Test Centre

You also want an ePaper? Increase the reach of your titles
YUMPU automatically turns print PDFs into web optimized ePapers that Google loves.
<strong>Insight</strong><strong>Technical</strong> <strong>Manual</strong>Richard Wolfe
Table of contentsTable of contents...............................................................................................................iTable of figures ................................................................................................................iiGeneral description .........................................................................................................1Development steps...........................................................................................................4Calibration, equating, scaling.........................................................................................7Norming and reporting..................................................................................................11Statistical analyses........................................................................................................14Item statistics.............................................................................................................14Scale statistics............................................................................................................15Confidence bounds for the national percentile ranks ..............................................16Validity analyses ...........................................................................................................18Check on gender bias .................................................................................................18Concurrent validity....................................................................................................19Internal correlation structure ...................................................................................20Connection to CAT·4..……………………….……………………………………….............22References…………....……………………….……………………………………….............25Appendix A. Item locations and standard errors by subtest and level.......................26Appendix B. Smoothed distributions of theta and composite scores by age...............33Appendix C. Item-age regressions for Gc, Gv, and Gf .................................................48Appendix D. NPR lower and upper confidence bounds by subtest and summary score........................................................................................................................................62i
Table of figuresFigure 1 <strong>Test</strong> levels and grade ranges............................................................................1Figure 2 Subtests and number of items by level............................................................1Figure 3 Item overlaps for a typical subtest ..................................................................2Figure 4 Composite scores...............................................................................................2Figure 5 Discrepancy scores and reports .......................................................................3Figure 6 Ability/achievement discrepancy .....................................................................3Figure 7 Subtests and number of items by level for the initial development forms....4Figure 8 Subtests and number of items by level for the later development forms ......4Figure 9 Development/norming sample sizes ................................................................5Figure 10 Geographic distribution of norming samples................................................5Figure 11 Regional Anglophone populations, samples, and weights............................6Figure 12 Illustration of Rasch model for vertical scaling ............................................8Figure 13 Glr regression by age and level....................................................................10Figure 14 Transformation of standard scores to NPR and stanine ............................12Figure 15 Example of an item regressed on age and level..........................................14Figure 16 Distributions of standard scores of subtests and summaries ....................15Figure 17 Correlation of age and subtest and summary standard scores..................16Figure 18 Example of graph of NPR confidence bounds .............................................17Figure 19 Differential item functioning in the final development items in Gc, Gv,and Gf......................................................................................................................19Figure 20 <strong>Insight</strong> compared to WISC IV and Woodcock-Johnson III.........................20Figure 21 Internal correlations for Rasch thetas and standard subtest scores .........21Figure 22 Correlations of <strong>Insight</strong> and CAT·4 and age.................................................22Figure 23 Partial correlations of <strong>Insight</strong> and CAT·4 controlling age .........................22Figure 24 Regression analyses of CAT·4 standard scores on <strong>Insight</strong> subtests ..........23Figure 25 Standard errors of measurement for CAT·4 standard scores by level.......24ii
General descriptionThe <strong>Canadian</strong> <strong>Test</strong> <strong>Centre</strong>, in conjunction with Dr. A. Lynne Beal, Psychologist, hascreated <strong>Insight</strong> (Beal, 2011), an innovative cognitive abilities assessment. <strong>Insight</strong> isbased on the widely accepted Cattell-Horn-Carroll (CHC) theory of cognitive abilitiesand is designed to be used as a group-administered screening instrument. <strong>Insight</strong> iseffective for assessing CHC-defined abilities critical to developing reading, writtenlanguage, and mathematics skills. See the author’s description of the model andtheory behind <strong>Insight</strong>, and the abilities measured by each subtest, athttp://www.ctcinsight.com/About/index.html.Three levels of <strong>Insight</strong> are available, each appropriate for use with a particulargrade span as shown in Figure 1. The tests are normed depending on student agerather than grade, and the results from the three levels are statistically linked(vertically equated) and thereby comparable across the full range of grades.Figure 1: <strong>Test</strong> levels and grade ranges<strong>Test</strong> levelGrade spanLevel 1 Grades 2 and 3Level 2 Grades 4 and 5Level 3 Grades 6 and 7The <strong>Insight</strong> assessment is divided into seven subtests determined by the CHCtheory. The number of items by subtest and level is given in Figure 2.Figure 2: Subtests and number of items by levelNumber of itemsLevel 1 Level 2 Level 3Crystallized Knowledge (Gc) 30 30 30Visual Processing (Gv) 30 30 30Fluid Reasoning (Gf) 30 30 30Short-Term Memory (Gsm) 20 23 20Long-Term Memory Retrieval (Glr) 36 48 72Auditory Processing (Ga) 19 22 24Processing Speed (Gs) 42 49 49The test items used in a subtest overlap to some extent between levels. Thisallows vertical linkage of the test results and assures appropriatemeasurement across the ability range, within and between levels. Thearrangement for one of the subtests (Gc) is shown in Figure 3. A line betweencircles indicates the same item. For example, Item 30 in Level 1 is also Item1
29 in Level 2. Notice that some items occur in all three levels, such as theitem found as Item 29 in Level 1, Item 27 in Level 2, and Item 29 in Level 3.Figure 3: Item overlaps for the Gc subtestItem Level 1 Level 2 Level 3302928272625242322212019181716151413121110987654321<strong>Insight</strong> score reports provide the composite scores described in Figure 4 tosummarize a student’s cognitive abilities. In calculating each index score,equal weights are applied to the standardized subtest scores.Figure 4: Composite scores<strong>Insight</strong> Ability Score (IAS)<strong>Insight</strong> General Ability Index (gI)<strong>Insight</strong> Thinking Index (ITI)<strong>Insight</strong> Memory/Processing Index (IMPI)Subtest componentsall subtestsGc, Gv, GfGv, Gf, Glr, GaGsm, Gs2
An individual Interpretive Report provides information about possiblediscrepancies within the student’s profile of subtest and composite scores. InFigure 5 discrepancy scores are indicated. The first is a difference betweentwo composite scores, the second is a difference between two subtest scores,and the third is a difference between two pairs of subtest scores, where eachpair is the average of two standard scores.The last two discrepancy scores consider the cultural and linguistic demandsof the subtests. These discrepancy scores are based on the work of Ortiz andhis colleagues (Flanagan, D.P., Ortiz, S.O. & Alfonso, V.C., 2007). They showwhether for a student the particular sets of subtest scores or averages show anumeric trend of increasing or decreasing as the linguistic demand increasesor as the cultural loading increases.Figure 5: Discrepancy scores and reportsIntentional cognitive processing vs.automatic cognitive processingLearning new material in the testsession vs. learning over time at homeand at schoolMemory and Learning skills vs. abilityto solve problems with novelinformationDegree of Linguistic DemandDegree of Cultural LoadingComparisonITI vs IMPIGlr vs GcGsm,Glr vs Gf,GvGv, Gf < Gsm, Glr, Gs < Ga, GcGv, Gsm, Gf, Gs < Glr, Ga < GcWhen a student has taken <strong>Insight</strong> as well as certain tests from the fourthedition of the <strong>Canadian</strong> Achievement <strong>Test</strong>s (CAT·4), the discrepancy betweenachievement and ability is reported. This requires the student’s scores from<strong>Insight</strong> on subtests Gc, Gv, and Gf. The discrepancy analysis is doneseparately for three CAT·4 tests: Reading, Writing Conventions, andMathematics, as indicated in Figure 6. Age is a covariate, since CAT·4 has avertical developmental scale while <strong>Insight</strong> is age normed.Figure 6: Ability/achievement discrepancyReadingWriting ConventionsMathematicsPredictionCAT4 scales ~ Gc, Gv, Gf and age3
Development stepsThe items were written by Dr. A. Lynne Beal and Dr. Rhia Roberts. The items ineach subtest pool were subsequently assigned to three different difficulty levelsbased on the apparent relative difficulties of the items. (After the first field test,items were assigned to levels based on empirically based difficulty estimates.) Thedistribution of items by level and subtest for the current (final) <strong>Insight</strong> test formsare given in Figure 2 above. During the development and norming stages of <strong>Insight</strong>,there were two earlier sets of forms. In the initial development forms, most subtestshad substantially more items, as shown in Figure 1, because an important goal wasto gain information about many items and then use the information to constructmore efficient smaller forms.Figure 1: Subtests and number of items by level for the initial developmentformsNumber of itemsLevel 1 Level 2 Level 3Crystallized Knowledge (Gc) 50 50 50Visual Processing (Gv) 50 50 50Fluid Reasoning (Gf) 30 40 50Short-Term Memory (Gsm) 50 50 50Long-Term Memory Retrieval (Glr) 36 48 72Auditory Processing (Ga) 50 50 50Processing Speed (Gs) 49 56 70In the next stage, a careful selection of items was made, keeping those that had thebest statistical properties (e.g., high discrimination). This led to a new set ofdevelopment forms, with items by subtest and level as show in Figure 2.Figure 2: Subtests and number of items by level for the later developmentformsNumber of itemsLevel 1 Level 2 Level 3Crystallized Knowledge (Gc) 35 40 40Visual Processing (Gv) 30 30 30Fluid Reasoning (Gf) 42 47 47Short-Term Memory (Gsm) 20 24 24Long-Term Memory Retrieval (Glr) 36 48 72Auditory Processing (Ga) 20 24 24Processing Speed (Gs) 42 49 494
The data for the initial and later development forms were collected in fourwaves: Fall 2009, Winter 2010, Spring 2010, and Fall 2010. The initialdevelopment forms were used in the first two waves and the laterdevelopmental forms were used in the last two waves. There were large<strong>Canadian</strong> samples in all cases, as indicated in Figure 9.Figure 9: Development/norming sample sizesLevel 1 Level 2 Level 3Fall 2009 1371 1511 2121Winter 2010 1752 1630 2023Spring 2010 3203 2151 4151Fall 2010 1183 1256 869Total 7509 6548 9164The total set of item and test form development data was used for thenorming of <strong>Insight</strong>. This was possible because there were common itemsbetween levels and between the initial development forms and the laterdevelopment forms. As a result, all the items could be jointly calibrated andequated. The norming sample was national, with the division by provincesshown in Figure 10. The total sample size was 23,221.Figure 10: Geographic distribution of norming samplesSample size in each development stageSample location Initial LaterAB 1765 2591BC 3683 585MB 20 928NB 169 38NL 0 101NS 169 1111NT 303 298ON 3778 5008QC 223 938SK 298 1215Total 10408 12813To provide national representation in the <strong>Insight</strong> norming, as describedbelow, the development sample data were re-weighted in the analysis. Thiswas done by regions as shown in Figure 11.5
Figure 11: Regional Anglophone populations, samples, and weightsCensuspopulation<strong>Insight</strong> samplesizesReweightingfactorsproportions InitialstageLaterstageInitialstageLaterstageAtlantic 0.0824 338 1250 2.537 0.845Quebec 0.0295 223 938 1.377 0.403Ontario 0.4961 3778 5008 1.367 1.269West 0.3873 5766 5319 0.699 0.933Territories 0.0047 303 298 0.161 0.202Information from the norming study data was used to select items for thefinal form at each of the three levels. For each subtest at each level, itemswere selected after considering a number of criteria. Some of the moreimportant criteria are as follows:1. It was desirable to select as many items as possible that woulddiscriminate well among the abilities of students at the lowest part of thenormal distribution and among the abilities of the students at the highestpart of the normal distribution, as the scores would ultimately be used toscreen students for exceptionalities. In other words, selecting as many itemsas possible that were either very easy or very difficult at a particular levelwas desirable.2. Items were selected so as to avoid (or counterbalance) items that showedgender bias. When choosing an item that showed gender bias, an attempt wasmade to counterbalance the bias by selecting another item with similardifficulty that showed a similar amount of bias in the opposite direction (i.e.,favouring the opposite gender).3. Items that showed poor item discrimination of students’ overall ability(point-biserial correlations) were avoided.6
Calibration, equating, scalingThe Rasch item response theory (IRT) model provided the basis forcalibrating the <strong>Insight</strong> assessment battery. This model defines a scale thatunifies the statistical properties of the test items with the statisticalmeasurement of the examinees. Specifically, for each item i there ischaracteristic difficulty i and for each examinee j a characteristic ability jand these together determine ij , the probability of correct response of theexaminee to the item in a log-linear fashion:log( ij / (1 – ij) ) = j – iThe Rasch model states that these probabilities are effectively independentfor any set of items given to an examinee with a given ability. From theRasch model flows an important set of consequences that permit coherentcalibration and scaling of complex tests such as <strong>Insight</strong>.The estimated ability of an examinee is a non-linear function of thenumber of items answered correctly; the function can be calculatedfrom the difficulty parameters of the included items.The standard errors of measurement of the abilities can also becalculated from the number of items answered correctly, as a functionof the difficulty parameters of the items.Examinee ability can be estimated consistently on the same scaleregardless of the set of items that is used.Item difficulty can be estimated consistently on the same scaleregardless of the set of examinees that is used in calibration.The prospect of using different item sets for different examinee samples hasbeen important to the development and implementation of <strong>Insight</strong>. From theearly to the later development forms to the final form, there are commonitems in each subtest, so consistent scaling is obtained (horizontal equating).Similarly, within a subtest from Level 1 to 2 to 3 there are common items, sothere is a consistent, equated scale across levels (vertical equating).The Rasch model and analysis provides consistent, equated results acrosslevels and forms. The key objective in the test design—that is, the selection ofitems for each level—is to provide accurate scores. Score accuracy is a matterof matching item difficulty to examinee ability, assuring that examinees ofdifferent abilities, and of different ages and grades, are tested using asufficient number of appropriate items, which means items with difficultymeasures numerically close to examinees’ ability measures.7
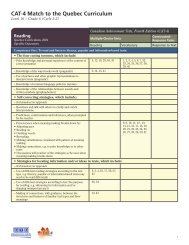
Practically, this means that the Level 1 forms include relatively more easy items,Level 2 forms include more medium items, and Level 3 forms include more difficultitems. Also, subtests intended to focus on low-ability examinees will includerelatively more easy items, subtests intended to focus on high-ability examinees willinclude relatively more difficult items, and subtests that are expected todiscriminate well across the whole range of abilities will include items distributedover the whole range. The situation is illustrated in Figure 12. The verticaldimension represents the Rasch ability scale, with the examinee ability distributionshown on the right. For the three levels, the positions of the items are shown on thesame scale. Since students taking Level 1 will usually have lower ability, there is agreater concentration of items in the lower part of the scale, and conversely forLevel 3, while Level 2 has more items in the middle of the scale.Figure 12: Illustration of Rasch model for vertical scalingItem DifficultyStudent AbilityLevel 1Level 2Level 390%75%50%25%10%---------8
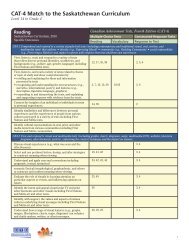
The Rasch score estimated for an individual examinee is not the true score ofthe individual but rather the true score plus measurement error. The truescore would be obtained, in theory, from a very long test or from averagingmany repeated testings. The measurement error results from specificknowledge and skill of the individual on specific items, from increased ordecreased attention during testing, from guessing, etc. In theory,measurement errors are random, and therefore should average out to zeroover the many items in a test, but they leave some residual variation, whichis represented as the standard error of measurement (the standard deviationof the measurement errors). In the Rasch model, the standard error is foundto be a function of the location of the individual ability and it depends on therelative position of the item difficulties. If there are few items near the ability,the error will be high, but if there are many, the error will be low.For the final <strong>Insight</strong> forms, the relationship of the examinee ability, thestandard error of measurement, and the locations of the items are shown inAppendix A for each subtest and level.There are two special cases among the <strong>Insight</strong> assessment subtests.1) The Gs (Processing Speed) subtest is the only part of <strong>Insight</strong> that is aspeed test. The score obtained is the number of correct answers by theexaminee in the timed administration. There are 49 items in Levels 2and 3 and they are the same. The first 42 of the items are used inLevel 1, reflecting the expectation that Level 1 examinees will answerfewer than 42 items. The score for Gs is simply the number of correctresponses. There is no equating needed.2) The Glr (Long-Term Memory Retrieval) subtest uses one set of 36items for Level 1, another set of 48 items for Level 2, and then thosesame 48 items plus an additional 24 items for Level 3. Consequently, itis possible to use the Rasch equating methodology to put the Level 2and Level 3 tests on the same scale, using the 48 common items. Thereis no formal way to connect Level 1 with the other levels, since thereare no common items. This is inconvenient for the purpose of agenorming, since some examinees have ages that might put them inLevel 1 or Level 2 testing. The solution has been to (a) calibrate theLevel 1 data, (b) calibrate and equate the Level 2 and Level 3 data, (d)regress the Level 1 and the Levels 2-3 scores so that the regressions onage are homogenous. The regressions are shown in Figure 13, wherethe X-axis is age (in months) and the Y-axis is Glr theta (j ). Therescaling of Glr in Level 1 to make it align with Levels 2 and 3 is givenin the figure, where the X-axis is age (in months) and the Y-axis is jfor Glr.9
Figure 13: Glr regression by age and levelGlr by age and levelSeparate regressions for L1 and L2&3Projection of L1 onto L2&3 lineGlr theta-4 -3 -2 -1 0 1L1L2&3New L1New Glr for Level 1 = old Glr * 0.242026 + -0.94397980 100 120 140 160 180age10
Norming and reportingThe Rasch-based theta scores used in the development, calibration, andequating of <strong>Insight</strong> are not reported directly in <strong>Insight</strong> score reports. Instead,all the scores are normed with reference to examinee age in months. That is,each examinee score is referenced to the distribution of scores obtained byexaminees of the same age, to the month. The norm referencing proceeds inthese steps for each subtest:1) Separate distributions of theta scores are calculated for each month.2) For each month, the quantiles of the distribution are calculated bycorresponding to the 15.9, 50, and 84.1 percentiles, which correspondin the normal distribution to –1, 0, and +1 standard deviations fromthe mean. The use of quantiles reduces the effects of outliers.3) Each of three quantiles is plotted against the ages and a lowess (r=.4)regression is applied to obtain a smoothed value for each age. Theseare given in Appendix B.4) For a student at the given age, the theta score is compared to thesmoothed middle quantile (i.e., at 50%). If theta is at the middle, it isconverted to a standardized score of zero. If the theta is above themiddle, the distance from the middle quantile to the upper (84.1%)quantile is taken as a standard deviation and, using that, theta isconverted to a standard score. Similarly, if the theta is below themiddle, the distance from the middle quantile to the lower (15.9%)quantile is taken as a standard deviation and theta is converted to anegative standard score.5) At this point, the standardized scores are referenced to the normaldistribution with a mean of zero and a standard deviation of one forexamines at the age. These are reset to the final subtest scores byrescaling to a mean of 100 and standard deviation of 15 and rounded.If any scores are above 135, they are truncated to 135, and if anyscores are below 65, they are truncated to 65. (A standard score of 135is 2⅓ standard deviations above the mean, identifying the top 1% ofthe student population. Similarly, a standard score of 65 identifies thebottom 1% of the student population.)11
6) From the final scores, national percentile ranks (NPR) and Stanineranks (Stn) are calculated by lookup from the normal distribution, asindicated in Figure 14. The column “X” is the standard subtest score(mean 100, standard deviation 15) as calculated above. NPR is theestimated percentage of examinees in the age group (month) who areat that score and below. Stanine is a conventional simplified version ofNPR.Figure 14: Transformation of standard scores to NPR and stanineX NPR Stn X NPR Stn X NPR Stn X NPR Stn65 1 1 81 10 2 101 53 5 121 92 866 1 1 82 12 3 102 55 5 122 93 867 1 1 83 13 3 103 58 5 123 94 868 2 1 84 14 3 104 61 6 124 95 869 2 1 85 16 3 105 63 6 125 95 870 2 1 86 18 3 106 66 6 126 96 971 3 1 87 19 3 107 68 6 127 96 972 3 1 88 21 3 108 70 6 128 97 973 4 1 89 23 4 109 73 6 129 97 974 4 1 90 25 4 110 75 6 130 98 975 5 2 91 27 4 111 77 6 131 98 976 5 2 92 30 4 112 79 7 132 98 977 6 2 93 32 4 113 81 7 133 99 978 7 2 94 34 4 114 82 7 134 99 979 8 2 95 37 4 115 84 7 135 99 980 9 2 96 39 4 116 86 797 42 5 117 87 798 45 5 118 88 799 47 5 119 90 8100 50 5 120 91 8The standard score ranges (95% confidence intervals) for the subtest scoresand the NPRs are calculated by repeating steps 4–6 above, using theindividual theta value plus and minus 1.96 times the individual standarderror from the Rasch estimation.A similar process is used for presenting results for the three discrepancyscores, ITI vs IMPI, Glr vs Gc, and Gsm,Glr vs Gf,Gv. The age-specificempirical distributions of the discrepancies are examined and smoothedestimates of the age-specific quantiles corresponding to normal quantiles of–1, 0, and 1 are calculated. (See the last pages of Appendix B.) Then, whenthe discrepancy for an examinee is determined, its normal equivalent12
percentile is determined and this produces the frequency of occurrence andsignificance for reporting.The indications of Degree of Linguistic Demand and Degree of CulturalLoading are simply based on the numeric values of the correspondingstandard scores.13
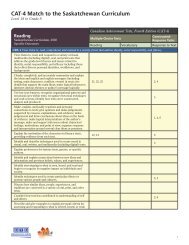
Statistical analysesItem statisticsDuring the developmental steps of the <strong>Insight</strong> assessment, careful selectionwas given to classical item statistics—difficulty, discrimination, distracterfunctioning. Items that showed problems were rewritten or discarded andreplacement items were chosen. (As mentioned, the initial development poolswere much larger than needed for the final test.)In the final construction of the subtests, the principal goal was to put itemsin each subtest at each level that would provide appropriate accuracy overthe whole range for tests such as Gc, and especially at extremes for tests suchas Ga. The decisions about item selection were informed mainly by the itemdifficulty: the Rasch beta parameter.Further guidance was obtained from graphical regressions of the classicalitem difficulties (percent correct) on age, differentiated by level. A completeset of graphs for the Gc, Gv and Gf subtests is given in Appendix C, with onegraph for each item included in the final <strong>Insight</strong> assessment. An example ofa graph is given in Figure 15.Figure 15: Example of an item regressed on age and level14
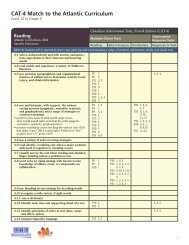
This is the fifth item plotted for the Gc subtest (the numbering here isarbitrary). As indicated in the title, this item was used in the finalassessment Levels 1 and 2. The Y-axis shows the difficulty (proportioncorrect) observed for the item for examinees of different ages (in years). Theplotting symbols indicate the test level, where 1, 2, and 3 are used for thelater development data and a, b, and c are used for the initial developmentdata. This item was used only in Level 1 for the initial development and inLevels 1 and 2 for the later development. It is an easy item and discriminatesby age within Level 1 and discriminates generally between Level 1 and 2. Forthis reason, it was included in both the Level 1 and Level 2 final test forms.Scale statisticsThe reported subtest and index scores for <strong>Insight</strong> are standardized scores(SS) and are age-normed. This implies that they each have an overalldistribution, within ages and across ages, with a mean of 100 and a standarddeviation of 15, as seen in Figure 16, which shows boxplots for each subtestand index.Figure 16: Distributions of standard scores for subtests and indicesStandard score distribution70 80 90 100 110 120 130Gc Gv Gsm Glr Gf Ga Gs IAS gI ITI IMPISubtest and summary scoresEach subtest is administered independently of the others and consists of it’sown set of items, but the subtests are correlated because the underlyingpsychological constructs are correlated. The summary scores (composite indexscores) are correlated highly with the subtests that compose them andcorrelated with one another because of the common subtests and also because15
of the correlations of the underlying constructs. Neither subtests nor indexscores are correlated with age. This would be expected, given that standardscores are conditional upon age. Figure 17 shows the correlation matrix ofage and the standard scores for subtests and composites.Figure 17: Correlation of age and subtest and summary standard scoresAge Gc Gv Gsm Glr Gf Ga Gs IAS gI ITI IMPIAge .00 –.01 .00 .02 –.01 –.01 .01 –.01 .00 .00 –.01Gc .00 .24 .22 .28 .26 .34 .12 .58 .66 .40 .22Gv –.01 .24 .18 .25 .29 .23 .16 .57 .73 .65 .22Gsm .00 .22 .18 .21 .19 .28 .20 .54 .25 .30 .80Glr .02 .28 .25 .21 .25 .32 .13 .57 .33 .64 .21Gf –.01 .26 .29 .19 .25 .25 .11 .57 .72 .64 .19Ga –.01 .34 .23 .28 .32 .25 .10 .61 .35 .67 .25Gs .01 .12 .16 .20 .13 .11 .10 .40 .16 .16 .72IAS –.01 .58 .57 .54 .57 .57 .61 .40 .81 .89 .61gI .00 .66 .73 .25 .33 .72 .35 .16 .81 .80 .27ITI .00 .40 .65 .30 .64 .64 .67 .16 .89 .80 .30IMPI –.01 .22 .22 .80 .21 .19 .25 .72 .61 .27 .30Confidence bounds for the national percentile ranksAll individual student scores for <strong>Insight</strong> are presented with confidence rangesshowing the interval in which it can be assumed with 95% confidence thatthe true value falls. The calculation of ranges was described on page 12. Aposteriori analysis was conducted to demonstrate the effective size of thenational percentile rank ranges. This is given in Appendix D and one of thegraphs is given below in Figure 18.Each graph refers to one of the subtests or index scores. The horizontal axiscorresponds to the NPR (national percentile rank). Since these are agenormedresults, the NPRs are compatible over student ages and over testlevels, so all the data are merged for this analysis. (Actually, this is basedonly on the data from the later development forms.)The diagonal black line is simply the NPR repeated. The blue line above thediagonal is the average upper bound for the NPR, and red line below thediagonal is the average lower bound.For all subtests and indices, the bounds are wide in the middle of thedistribution and converge to narrow at the lower and upper extreme. Thetests with higher reliability have narrower bounds. These generally are thecomposite tests. For example, the Gc, Gv, and Gf each have 30 items and so16
the confidence bounds are relatively wide. But gI combines those and has 90items and the confidence interval is relatively narrower.In interpreting this analysis, the following points should be kept in mind:1. This is a group-administered test where all examinees take the sameitems (except that different levels are used for grades 2–3, 4–5, and6–7). Conventional individually-administered tests are often effectivelymore accurate when variable starting points and discontinue pointsallow focus on an individual’s ability.2. The traits being evaluated are (approximately) normally distributed sothat large differences in percentile consequently occur with smalldifferences in tested measurements in the centre of the distribution.That is where the widest confidence intervals are found, but it is just aconsequence of there being, in fact, little measurable differencebetween individuals who are at, say, the 40 th and 60 th percentiles. Thisis true for both group-administered and individually-administeredassessments.Figure 18: Example of graph of NPR confidence bounds17
Validity analysesCheck on gender biasIn each of the stages of item and test development, statistical tests werecarried out to identify any items that seemed to be biased according togender; that is, any items that had particularly higher probabilities of correctresponses for boys or for girls, controlling for ability. Items that showedproblems were eliminated from consideration when the statistical evidencewas strong and when the differences were considered to demonstrate bias.The “differential item functioning” or DIF statistic is calculated for each itemas the standardized difference in Rasch difficulty comparing boys (positive)with girls (negative). Items that had DIF statistic values equal to or larger than 2standard errors were omitted from the final forms whenever possible. Items showingthis degree of bias that couldn’t be omitted were usually counterbalanced with anitem of comparable difficulty and a comparable degree of bias in the other direction.For example, an item with DIF statistic around −2 was usually counterbalancedwith an item of comparable difficulty and a DIF statistic around +2.For the final development forms at each level for subtests Gc, Gv, and Gf, thedistribution of DIF statistics is shown over all items in Figure 19. Most itemsare in the normal range between +/– 2. There are some items that showsignificant DIF, but the fact that they are about evenly balanced betweenbias in favour of boys and bias in favour of girls suggests that there is littleoverall bias in the tests.18
Figure 19: Differential item functioning in the final development items in Gc,Gv, and Gf.Differential item functionning−10 −5 0 5 10Gc 1 Gc 2 Gc 3 Gv 1 Gv 2 Gv 3 Gf 1 Gf 2 Gf 3Scale and levelConcurrent validityFor subsamples of examinees in the initial development sample of <strong>Insight</strong>,information was also obtained for the WISC IV test (N=75) and for theWoodcock- Johnson III <strong>Test</strong>s of Cognitive Abilities (N=72). In Figure 20 acomparison is made of the most general scores: the Woodcock-Johnson IIIGeneral Intellectual Ability, the WISC IV Full Score, and the <strong>Insight</strong> AbilityScore (IAS) from <strong>Insight</strong>. More detailed analysis with these small subsamplesdid not seem to be warranted. Generally, the correlation of <strong>Insight</strong> IAS andWISC IV Full Score is very high (r=.88), practically at the limit of what canbe expected given the measurement errors in the two tests. The correlationwith Woodcock-Johnson III is lower (r=.62) and, from the scatterplot, it seemsthat there is some difference in the scaling and that some part of thesubsample is not following the trend line. This requires further data forinvestigation, but given the high correlation of <strong>Insight</strong> and WISC IV, it mightbe useful to have data that has all three scores on the same sample ofexaminees.19
Figure 20: <strong>Insight</strong> compared to WISC IV and Woodcock-Johnson IIIWJ.GENERAL.INTELLECTUAL60 80 100 120 140WISC.FULL.SCALE60 80 100 120 14060 80 100 120 140IAS60 80 100 120 140IASInternal correlation structureThe intercorrelations of the <strong>Insight</strong> standard scores (age normed) werepresented earlier in Figure 17. These are repeated in Figure 21, together withthe intercorrelations of the original vertically equated and unnormed Raschtheta scores. The purpose of this juxtaposition is to consider the internalfactor structure of the <strong>Insight</strong> subtest set of scores. The standard scorecorrelations show relatively low and homogeneous correlations, which areconsistent with independent traits with a common underlying factor. Onlythe Processing Speed subtest, Gs, has a substantially lower correlation withthe others. The Rasch thetas have higher intercorrelation, and this due to thecommon effect of growth and change with age.20
Figure 21 Internal correlations for Rasch thetas and standard subtest scoresRasch Gc Gv Gsm Glr Gf Ga GsthetasGc .37 .43 .33 .37 .32 .33Gv .37 .32 .31 .35 .26 .27Gsm .43 .32 .29 .28 .30 .36Glr .33 .31 .29 .28 .35 .18Gf .37 .35 .28 .28 .26 .21Ga .32 .26 .30 .35 .26 .12Gs .33 .27 .36 .18 .21 .12StandardscoresGc .24 .22 .28 .26 .34 .12Gv .24 .18 .25 .29 .23 .16Gsm .22 .18 .21 .19 .28 .20Glr .28 .25 .21 .25 .32 .13Gf .26 .29 .19 .25 .25 .11Ga .34 .23 .28 .32 .25 .10Gs .12 .16 .20 .13 .11 .1021
Connection to <strong>Canadian</strong> Achievement <strong>Test</strong>s (CAT·4)One optional result from <strong>Insight</strong> is an individual discrepancy analysisbetween CAT·4 scores and those scores predicted from <strong>Insight</strong> scores and age.This requires information on the three <strong>Insight</strong> subtests Gc, Gv, and Gf and amatch between <strong>Insight</strong> and CAT·4 scores. The CAT·4 standard scores forReading, Writing Conventions, and Mathematics are used. The analysis isdone separately, so results can be provided for any or all of them.The prediction equations were developed from a sample of 4,329 cases withmatching data for <strong>Insight</strong> and CAT·4 found across the four developmentalsamples (see Figure 9). For this population, the correlations between andacross <strong>Insight</strong> and CAT·4 and with age are shown in Figure 22. Allcorrelations are statistically significant, except for those between age and the<strong>Insight</strong> subtests, which are age-normed.Figure 22: Correlations of <strong>Insight</strong> and CAT·4 and ageAge CAT·4ReadingCAT·4W ConvCAT·4Math<strong>Insight</strong>Gc<strong>Insight</strong>Gv<strong>Insight</strong>GfAge .61 .43 .63 .00 –.01 –.01Reading .61 .75 .78 .49 .28 .32W Conv .43 .75 .72 .49 .31 .40Math .63 .78 .72 .42 .40 .40Gc .00 .49 .49 .42 .34 .37Gv –.01 .28 .31 .40 .34 .42Gf –.01 .32 .40 .40 .37 .42Since CAT·4 is developmental with age and <strong>Insight</strong> is age-normed, a betterindication of the cross-correlations is obtained by partialling by age, as shown inFigure 23. All the partial correlations are higher than the simple correlations.Figure 23: Partial correlations of <strong>Insight</strong> and CAT·4 controlling ageCAT·4ReadingCAT·4W ConvCAT·4Math<strong>Insight</strong>Gc<strong>Insight</strong>Gv<strong>Insight</strong>GfReading .69 .64 .60 .35 .42W Conv .69 .64 .55 .36 .47Math .64 .64 .51 .50 .52Gc .60 .55 .51 .34 .37Gv .35 .36 .50 .34 .42Gf .42 .47 .52 .37 .4222
The correlations and partial correlations reported in the figures above arebased on linear relationships with Age in whole years.To provide formulas to predict the three CAT·4 standard scores from thethree <strong>Insight</strong> subtests, a separate multiple regression was calculated for eachCAT·4 score using the <strong>Insight</strong> variables as predictors along with dummyvariables for each of the ages 7 to 14 and no intercept. The multiplecorrelations were .81, .71, and .82 for Reading, Writing Conventions, andMathematics respectively. All <strong>Insight</strong> subtests were significant in eachregression.The regression prediction formulas and the standard errors of predictionseparated by age are given in Figure 24.Figure 24: Regression analyses of CAT·4 standard scores on <strong>Insight</strong> subtestsMultipleregressionCAT·4ReadingCAT·4WritingConventionsCAT·4MathematicsAge 7 218.2 87.6 183.9Age 8 240.6 100.3 216.7Age 9 275.4 138.4 249.0Age 10 297.9 174.2 266.7Age 11 308.4 183.8 274.9Age 12 318.4 198.1 288.1Age 13 325.5 222.5 305.6Age 14 333.2 209.7 307.5<strong>Insight</strong> Gc 1.376 1.720 .877<strong>Insight</strong> Gv .156 .196 .716<strong>Insight</strong> Gf .543 1.137 .785Standard errorsof predictionAge 7 39.9 83.7 44.7Age 8 33.7 51.8 39.1Age 9 36.1 57.9 33.4Age 10 31.7 48.6 27.8Age 11 30.5 41.1 27.4Age 12 26.2 42.4 26.4Age 13 27.3 52.9 29.8Age 14 29.7 60.5 31.0A further set of information needed for the CAT·4 discrepancy analysis wasthe standard errors of measurement of the CAT·4 standard scores. This wascalculated from the published CAT·4 <strong>Technical</strong> <strong>Manual</strong>, which included thestandard deviation and reliability by CAT·4 level. The results of thecalculation are given in Figure 25.23
Figure 25: Standard errors of measurement for CAT·4 standard scores bylevelLevelCAT·4ReadingCAT·4WritingConventionsCAT·4Mathematics10 17.4 24.611 15.4 16.012 15.4 25.5 12.313 14.1 25.5 12.314 12.1 18.9 9.915 12.1 19.9 10.516 12.1 21.8 9.917 12.1 20.8 9.918 12.7 18.0 9.919 12.1 18.9 10.520 21.8This information is used for reporting purposes as follows:1. Upper and lower confidence bounds for the CAT·4 score are based onthe normal distribution with the standard errors of measurement asgiven in Figure 25.2. The predicted CAT·4 score is calculated from Age in years and the<strong>Insight</strong> subtests using the regression formulas given in the top part ofFigure 24.3. Upper and lower confidence bounds for that prediction (assuming thatthe student received an actual CAT·4 score which is the same score aspredicted when s/he wrote the same level of CAT·4) based again on thestandard error of measurement given in Figure 25.4. The percentile of the discrepancy between CAT·4 and the prediction,based on normal distribution and the standard error of regressions asgiven in the bottom part of Figure 24.5. The significance (.05) of the residual deviation of the CAT·4 predictionfrom the actual is tested, based on percentile discrepancy.24
ReferencesBeal, A. Lynne (2011). <strong>Insight</strong> <strong>Test</strong> of Cognitive Abilities. Markham, ON:<strong>Canadian</strong> <strong>Test</strong> <strong>Centre</strong>.Flanagan, D.P., Ortiz, S.O. & Alfonso, V.C. (2007). Essentials of Cross-Battery Assessment, Second Edition. Hoboken, New Jersey: John Wiley &Sons, Inc.25
Appendix A. Item locations and standard errors bysubtest and level26
Appendix B. Smoothed distributions of theta andcomposite scores by age33
Appendix C. Item-age regressions for Gc, Gv, and Gf48
Appendix D. NPR lower and upper confidence bounds bysubtest and summary score62