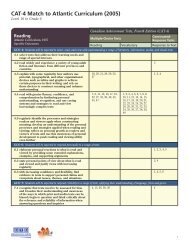
The Rasch score estimated for an individual examinee is not the true score ofthe individual but rather the true score plus measurement error. The truescore would be obtained, in theory, from a very long test or from averagingmany repeated testings. The measurement error results from specificknowledge and skill of the individual on specific items, from increased ordecreased attention during testing, from guessing, etc. In theory,measurement errors are random, and therefore should average out to zeroover the many items in a test, but they leave some residual variation, whichis represented as the standard error of measurement (the standard deviationof the measurement errors). In the Rasch model, the standard error is foundto be a function of the location of the individual ability and it depends on therelative position of the item difficulties. If there are few items near the ability,the error will be high, but if there are many, the error will be low.For the final <strong>Insight</strong> forms, the relationship of the examinee ability, thestandard error of measurement, and the locations of the items are shown inAppendix A for each subtest and level.There are two special cases among the <strong>Insight</strong> assessment subtests.1) The Gs (Processing Speed) subtest is the only part of <strong>Insight</strong> that is aspeed test. The score obtained is the number of correct answers by theexaminee in the timed administration. There are 49 items in Levels 2and 3 and they are the same. The first 42 of the items are used inLevel 1, reflecting the expectation that Level 1 examinees will answerfewer than 42 items. The score for Gs is simply the number of correctresponses. There is no equating needed.2) The Glr (Long-Term Memory Retrieval) subtest uses one set of 36items for Level 1, another set of 48 items for Level 2, and then thosesame 48 items plus an additional 24 items for Level 3. Consequently, itis possible to use the Rasch equating methodology to put the Level 2and Level 3 tests on the same scale, using the 48 common items. Thereis no formal way to connect Level 1 with the other levels, since thereare no common items. This is inconvenient for the purpose of agenorming, since some examinees have ages that might put them inLevel 1 or Level 2 testing. The solution has been to (a) calibrate theLevel 1 data, (b) calibrate and equate the Level 2 and Level 3 data, (d)regress the Level 1 and the Levels 2-3 scores so that the regressions onage are homogenous. The regressions are shown in Figure 13, wherethe X-axis is age (in months) and the Y-axis is Glr theta (j ). Therescaling of Glr in Level 1 to make it align with Levels 2 and 3 is givenin the figure, where the X-axis is age (in months) and the Y-axis is jfor Glr.9
Figure 13: Glr regression by age and levelGlr by age and levelSeparate regressions for L1 and L2&3Projection of L1 onto L2&3 lineGlr theta-4 -3 -2 -1 0 1L1L2&3New L1New Glr for Level 1 = old Glr * 0.242026 + -0.94397980 100 120 140 160 180age10