Trading WITH OR AGAINST the Skew - ISE.com
Trading WITH OR AGAINST the Skew - ISE.com
Trading WITH OR AGAINST the Skew - ISE.com

You also want an ePaper? Increase the reach of your titles
YUMPU automatically turns print PDFs into web optimized ePapers that Google loves.
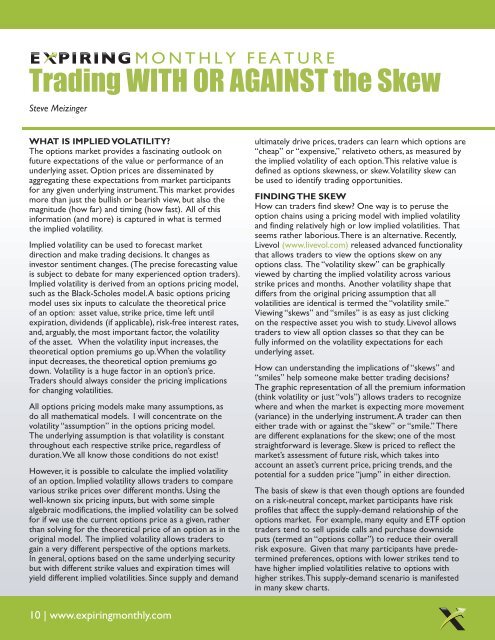
MONTHLY FEATURE<strong>Trading</strong> <strong>WITH</strong> <strong>OR</strong> <strong>AGAINST</strong> <strong>the</strong> <strong>Skew</strong>Steve MeizingerWHAT IS IMPLIED VOLATILITY?The options market provides a fascinating outlook onfuture expectations of <strong>the</strong> value or performance of anunderlying asset. Option prices are disseminated byaggregating <strong>the</strong>se expectations from market participantsfor any given underlying instrument.This market providesmore than just <strong>the</strong> bullish or bearish view, but also <strong>the</strong>magnitude (how far) and timing (how fast). All of thisinformation (and more) is captured in what is termed<strong>the</strong> implied volatility.Implied volatility can be used to forecast marketdirection and make trading decisions. It changes asinvestor sentiment changes. (The precise forecasting valueis subject to debate for many experienced option traders).Implied volatility is derived from an options pricing model,such as <strong>the</strong> Black-Scholes model.A basic options pricingmodel uses six inputs to calculate <strong>the</strong> <strong>the</strong>oretical priceof an option: asset value, strike price, time left untilexpiration, dividends (if applicable), risk-free interest rates,and, arguably, <strong>the</strong> most important factor, <strong>the</strong> volatilityof <strong>the</strong> asset. When <strong>the</strong> volatility input increases, <strong>the</strong><strong>the</strong>oretical option premiums go up.When <strong>the</strong> volatilityinput decreases, <strong>the</strong> <strong>the</strong>oretical option premiums godown. Volatility is a huge factor in an option’s price.Traders should always consider <strong>the</strong> pricing implicationsfor changing volatilities.All options pricing models make many assumptions, asdo all ma<strong>the</strong>matical models. I will concentrate on <strong>the</strong>volatility “assumption” in <strong>the</strong> options pricing model.The underlying assumption is that volatility is constantthroughout each respective strike price, regardless ofduration.We all know those conditions do not exist!However, it is possible to calculate <strong>the</strong> implied volatilityof an option. Implied volatility allows traders to <strong>com</strong>parevarious strike prices over different months. Using <strong>the</strong>well-known six pricing inputs, but with some simplealgebraic modifications, <strong>the</strong> implied volatility can be solvedfor if we use <strong>the</strong> current options price as a given, ra<strong>the</strong>rthan solving for <strong>the</strong> <strong>the</strong>oretical price of an option as in <strong>the</strong>original model. The implied volatility allows traders togain a very different perspective of <strong>the</strong> options markets.In general, options based on <strong>the</strong> same underlying securitybut with different strike values and expiration times willyield different implied volatilities. Since supply and demandultimately drive prices, traders can learn which options are“cheap” or “expensive,” relativeto o<strong>the</strong>rs, as measured by<strong>the</strong> implied volatility of each option.This relative value isdefined as options skewness, or skew.Volatility skew canbe used to identify trading opportunities.FINDING THE SKEWHow can traders find skew? One way is to peruse <strong>the</strong>option chains using a pricing model with implied volatilityand finding relatively high or low implied volatilities. Thatseems ra<strong>the</strong>r laborious.There is an alternative. Recently,Livevol (www.livevol.<strong>com</strong>) released advanced functionalitythat allows traders to view <strong>the</strong> options skew on anyoptions class. The “volatility skew” can be graphicallyviewed by charting <strong>the</strong> implied volatility across variousstrike prices and months. Ano<strong>the</strong>r volatility shape thatdiffers from <strong>the</strong> original pricing assumption that allvolatilities are identical is termed <strong>the</strong> “volatility smile.”Viewing “skews” and “smiles” is as easy as just clickingon <strong>the</strong> respective asset you wish to study. Livevol allowstraders to view all option classes so that <strong>the</strong>y can befully informed on <strong>the</strong> volatility expectations for eachunderlying asset.How can understanding <strong>the</strong> implications of “skews” and“smiles” help someone make better trading decisions?The graphic representation of all <strong>the</strong> premium information(think volatility or just “vols”) allows traders to recognizewhere and when <strong>the</strong> market is expecting more movement(variance) in <strong>the</strong> underlying instrument.A trader can <strong>the</strong>nei<strong>the</strong>r trade with or against <strong>the</strong> “skew” or “smile.” Thereare different explanations for <strong>the</strong> skew; one of <strong>the</strong> moststraightforward is leverage. <strong>Skew</strong> is priced to reflect <strong>the</strong>market’s assessment of future risk, which takes intoaccount an asset’s current price, pricing trends, and <strong>the</strong>potential for a sudden price “jump” in ei<strong>the</strong>r direction.The basis of skew is that even though options are foundedon a risk-neutral concept, market participants have riskprofiles that affect <strong>the</strong> supply-demand relationship of <strong>the</strong>options market. For example, many equity and ETF optiontraders tend to sell upside calls and purchase downsideputs (termed an “options collar”) to reduce <strong>the</strong>ir overallrisk exposure. Given that many participants have predeterminedpreferences, options with lower strikes tend tohave higher implied volatilities relative to options withhigher strikes.This supply-demand scenario is manifestedin many skew charts.10 | www.expiringmonthly.<strong>com</strong>
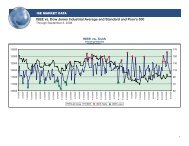
Steve MeizingerMONTHLY FEATURE <strong>Trading</strong> <strong>WITH</strong> <strong>OR</strong> <strong>AGAINST</strong> <strong>the</strong> <strong>Skew</strong>Without specific preferences, all strike prices and expirationmonths would trade at <strong>the</strong> same implied volatility.<strong>Skew</strong> is created by differences in supply and demand in<strong>the</strong> options marketplace and is best identified using skewcharts. If you believe <strong>the</strong> skew is “wrong,” <strong>the</strong> market isei<strong>the</strong>r underestimating or overestimating <strong>the</strong> probabilityof a large upside or downside move in <strong>the</strong> underlyinginstrument.An assessment of <strong>the</strong> relative risk/rewardtradeoff should always be considered prior to implementingany options strategy.EXAMPLES OF STRIKE SKEWLet me share a few examples of volatility skew using <strong>the</strong>Livevol.<strong>com</strong> skew tool.As a personal preference, whenI am looking to analyze <strong>the</strong> U.S. equity market, I use <strong>the</strong>S&P 500 ETF (symbol SPY) as a proxy for <strong>the</strong> market. In<strong>the</strong> example below, SPY is exhibiting significant negativestrike skew. This means that <strong>the</strong> lower <strong>the</strong> option strikeprice, <strong>the</strong> greater both <strong>the</strong> implied volatility and <strong>the</strong>perceived volatility of <strong>the</strong> market.The negative skew hastraditionally been normal for equity markets, although notnearly as steep as in this example. Interestingly enough,<strong>the</strong> shortest dated options had <strong>the</strong> lowest volatilities (redand yellow), predicting less movement in <strong>the</strong> short-termrelative to <strong>the</strong> intermediate-term.The second example is Apple (symbol AAPL). In thisinstance, <strong>the</strong> strike skew is evident but not nearly asextreme (<strong>the</strong> slope of <strong>the</strong> line is less). In fact, <strong>the</strong> longestdated options (shown in purple) have a moderate negativestrike skew.Again, shorter dated options were predictingless variance than intermediate-term options. If you<strong>com</strong>pare AAPL to SPY,AAPL was expected to have more“upside” volatility relative to SPY.In <strong>the</strong> third example – a gold ETF (GLD) – <strong>the</strong> strike skewwas not evident. In this case, GLD is a good example ofan option “smile.” The “smile” is apparent when both <strong>the</strong>higher strikes and <strong>the</strong> lower strikes have nearly identicalimplied volatilities. Depending on <strong>the</strong> time horizon, <strong>the</strong>smile is ei<strong>the</strong>r nearly perfect or a bit towards a negativeskew, with <strong>the</strong> upside calls having a slightly lower impliedvolatility relative to <strong>the</strong> downside puts. Generally, GLDwas more of an option “smile” graph of implied volatilities.SIGNIFICANT NEGATIVESTRIKE SKEW - SPYMODERATE NEGATIVE STRIKESKEW - AAPLOPTION SMILE - GLD11 | www.expiringmonthly.<strong>com</strong>
Steve MeizingerMONTHLY FEATURE <strong>Trading</strong> <strong>WITH</strong> <strong>OR</strong> <strong>AGAINST</strong> <strong>the</strong> <strong>Skew</strong>The fourth example is a EUR/USD currency pair value(symbol EUU). Currencies price money in relative termsas equities price future earnings capabilities. In this example,<strong>the</strong> strike skew is negative, especially in <strong>the</strong> secondand third months (yellow and green lines). Intermediatetermoptions have just a slight negative skew, meaning thatin <strong>the</strong> shorter term <strong>the</strong> EUR/USD might be more volatileto <strong>the</strong> downside. However, over <strong>the</strong> intermediate term<strong>the</strong>re is just a slight preference to more variance if EURweakened in value relative to USD.The final example is a bio-tech <strong>com</strong>pany, Dendreon Corp.(symbol DNDN).The short-term months (red and yellow)had very low implied volatilities relative to intermediatetermoptions. Can you believe <strong>the</strong> gap? This is truly aunique situation that manifests itself when <strong>the</strong> optionsmarket is expecting news that is likely to move <strong>the</strong> stockin a dramatic way in a few months’ time, but not in <strong>the</strong>shorter term. One potential explanation for this behaviormight be an FDA ruling about a certain drug/product thatwould significantly hurt <strong>the</strong> <strong>com</strong>pany if <strong>the</strong> drug/productwere not approved.The greater negative skew in <strong>the</strong>longer-dated options illustrates this market perspectiveDECIDING TO TRADE <strong>WITH</strong> <strong>OR</strong> <strong>AGAINST</strong>THE SKEWYour trading tactics should be based on your predictionfor market movement, or lack <strong>the</strong>reof, relative to marketexpectations (in <strong>the</strong> time period you select). Understandingmarket skewness, or variance from symmetrical pricingmodels, can help you select <strong>the</strong> best options strategy.In order to manage options positions effectively, it is veryimportant to recognize <strong>the</strong> conditions where a strategymight fail.How does a trader decide to trade with <strong>the</strong> skew oragainst it? <strong>Trading</strong> with <strong>the</strong> skew is defined as buyinghigher valuation options and selling lower valuationoptions.<strong>Trading</strong> against <strong>the</strong> skew is defined as buyinglower valuation options and selling higher valuationoptions. Instinctively, many traders believe that to takeadvantage of skew opportunities <strong>the</strong>y should plan to buy“undervalued” options and sell“overvalued” options.What does it mean to say that an option is undervaluedor overvalued? The valuation of most assets is normallyapproached on a relative basis. Recall <strong>the</strong> Black-Scholesassumption for options pricing, that volatility is assumedto be constant throughout various strike prices andexpiration terms.SLIGHT NEGATIVE STRIKESKEW - EUUSIGNIFICANT NEGATIVE STRIKESKEW - DNDN12 | www.expiringmonthly.<strong>com</strong>
Steve MeizingerMONTHLY FEATUREThat's a nice assumption, but it is rarely (if ever) true.Assuming <strong>the</strong>re is a trading skew in most options classes,is it better (more effective) to buy options with lowerimplied volatilities versus options with higher impliedvolatilities? Though volatility differentials tend toexpand or contract over different strike prices and expirationsmonths, <strong>the</strong>se movements are actually tradingopportunities where you can implement your views in<strong>the</strong> marketplace. Traders should be wary of making blindassumptions about options being “undervalued” or“overvalued.” Your trading tactics should never be basedsolely on <strong>the</strong> implied volatilities, but also on your forecastfor <strong>the</strong> underlying asset considering <strong>the</strong> risk and rewardtradeoffs offered by <strong>the</strong> marketplace.What are <strong>the</strong> trading implications for trading "with" <strong>the</strong>skew? In this scenario, <strong>the</strong> market is willing to “overpay”for a certain strike price or time frame.A trader canpurchase <strong>the</strong> higher implied volatility and sell a differentstrike price or month at a lower implied volatility. Whywould you want to purchase higher-valued options andsell lower-valued options? Your market forecast couldmirror <strong>the</strong> options market (more demand relative tosupply creates <strong>the</strong> skew) where you “give away <strong>the</strong>oreticaledge.” Alternatively, you can trade "against" <strong>the</strong> skew,assuming you forecasted a symmetric event and wantedto “gain <strong>the</strong>oretical edge” by selling higher-valued optionsand buying lower-valued options. <strong>Trading</strong> against <strong>the</strong> skewis a "reversion to <strong>the</strong> mean" strategy, meaning that you areimplementing an options strategy that benefits from amore normalized trading scenario (think of symmetricalra<strong>the</strong>r than asymmetric underlying moves).Remember,“cheap” or “expensive” attributions arebased on a symmetric ma<strong>the</strong>matical options model. Forexample, if you believe <strong>the</strong> market will remain calm in <strong>the</strong>near-term but that, in <strong>the</strong> <strong>com</strong>ing months, it’s going tobe<strong>com</strong>e more volatile, you can implement a long calendarposition.This is considered trading with <strong>the</strong> skew if <strong>the</strong>shorter-dated options are priced much cheaper than <strong>the</strong>longer-dated options.There are many variations of tradingwith <strong>the</strong> skew.The only requirement is that <strong>the</strong> optionyou sold has a lower implied volatility than <strong>the</strong> optionyou purchased.TRADING ADVANTAGES OF THE SKEWIf traders have an understanding of current marketsentiment, better trading decisions can be made. Withinsight into market expectations, traders can choose totrade “with” <strong>the</strong> skew/smile or “against” it. Optionstraders need to be cognizant of <strong>the</strong> important functionimplied volatility plays, not only in pricing, but also as anindicator of potential out<strong>com</strong>es for an underlying asset.The options skew is priced to reflect <strong>the</strong> market’sassessment of future risk. <strong>Skew</strong> is <strong>the</strong> impact of leverageon an options portfolio. Traders should draw <strong>the</strong>ir ownconclusions based on <strong>the</strong>ir financial goals and risktolerance, and should learn how to be as efficient aspossible in selecting not only assets to trade, but also<strong>the</strong>ir strategies. Livevol’s skew charts are one tool traderscan use to manage <strong>the</strong>ir options portfolios moreeffectively.Options can help lock in your gains and keep your lossesto a minimum. To learn how, go to OptionsEducation.orgor contact your Financial Advisor.Free Options Help Desk | Free Local Seminars | Software | Online Classes | Position Simulator | Strategy ScreenerOptions involve risk and are not suitable for all investors. Individuals should not enter into Options transactions until <strong>the</strong>y have read and understood <strong>the</strong> risk disclosure document, Characteristics and Risks of Standardized Options,available by calling 1-888-OPTIONS or by visiting OptionsEducation.org. None of <strong>the</strong> information in this ad should be construed as a re<strong>com</strong>mendation to buy or sell a security or to provide investment advice. ©2010 The OptionsIndustry Council. All rights reserved.13 | www.expiringmonthly.<strong>com</strong>