Research Matters: January 2007 - Cambridge Assessment
Research Matters: January 2007 - Cambridge Assessment
Research Matters: January 2007 - Cambridge Assessment

Create successful ePaper yourself
Turn your PDF publications into a flip-book with our unique Google optimized e-Paper software.
Critical Thinking comprises the mental processes, strategies, andrepresentations people use to solve problems, make decisions, andlearn new concepts.Thus, one expects from psychologists a more descriptive account ofCritical Thinking, rather than an aspirational account.Psychologists’ definitions and taxonomies of Critical Thinking tend toemphasise problem solving rather than logic. Sternberg‘s psychologicaltaxonomy of Critical Thinking skills involves metacomponents(e.g. formulating a strategy, monitoring progress in solving a problem),performance components (e.g. inductive and deductive reasoning, spatialvisualisation) and knowledge-acquisition components (e.g. encoding andorganising information). Interestingly, Critical Thinking tests which stemout of the cognitive tradition do not always separate out Critical Thinkingfrom intelligence (e.g. Sternberg’s Triarchic Test of Intellectual Skills).Unsurprisingly, representatives from each tradition counter attack. Paul(quoted in Benderson) rejects the psychological account on the basis thatthe puzzles posed by psychologists as critical thinking teaching aids areself-contained or ‘monological’, that is, are simplistic in that they have asingle correct answer and involve adopting just one frame of reference(‘weak sense’ Critical Thinking). ‘True’ Critical Thinking should involve‘multilogical’ problems, involving multiple frames of reference orargument networks with no single correct answer; only then can astudent reflect upon and evaluate their own beliefs. However, Sigel, anETS researcher notes that ‘Philosophers tend not to be empiricists…they just use themselves as sources of authorities. The psychologist is anempiricist who wants to create data that educators can then validatewith their own experience.’ (quoted in Benderson 1990)Is there any definition to which the majority of experts wouldsubscribe? Possibly the definition derived from a Delphi study 1 conductedin the United States by Facione (1990). In this study, 46 Critical Thinkingexperts, consisting of 24 panellists associated with philosophy (includingEnnis and Paul), 9 associated with the social sciences, 2 with physicalsciences and 10 with education formed a consensus on many aspects ofCritical Thinking, including a definition and list of critical skills. Thedefinition, quoted in full, reads as follows:We understand Critical Thinking to be purposeful, self-regulatoryjudgement which results in interpretation, analysis, evaluation, andinference, as well as explanation of the evidential, conceptual,methodological, criteriological, or contextual considerations uponwhich that judgement is based. CT [sic] is essential as a tool of inquiry.As such, CT is a liberating force in education and a powerful resource inone’s personal and civic life. While not synonymous with good thinking,CT is a pervasive and self-rectifying human phenomenon. The idealcritical thinker is habitually inquisitive, well-informed, trustful ofreason, open-minded, flexible, fair-minded in evaluation, honest infacing personal biases, prudent in making judgements, willing toreconsider, clear about issues, orderly in complex matters, diligent inseeking relevant information, reasonable in the selection of criteria,focused in inquiry, and persistent in seeking results which are as preciseas the subject and the circumstances of inquiry permit. Thus, educatinggood critical thinkers means working toward this ideal. It combines1. Briefly, the Delphi Method involves the formation of a panel of experts, who participate in anumber of rounds of questions involving them sharing opinions. The experts can reconsider themin the light of comments offered by other experts. The overall agenda is to move towards aposition of consensus (if not unanimity) on a particular subject.developing CT skills with nurturing those dispositions whichconsistently yield useful insights and which are the basis of a rationaland democratic society.It is worth noting that this definition has two dimensions to it:cognitive skills and affective dispositions. Facione also provides a detailedtaxonomy of skills and sub-skills which helps to define the outer limits ofCritical Thinking. However, some commentators regard the list as overinclusiveespecially with regard to affective dispositions. Fisher andScriven (1997) comment that the work is flawed in defining the CriticalThinker rather than Critical Thinking. Certainly, cognitive skills are morereadily assessed than affective dispositions in traditionally styledexaminations but perhaps, logically, if one wanted to assess the degree towhich someone is a Critical Thinker, a personality test would be moreappropriate?Some issues in Critical Thinking literatureregarding the construct and their implicationsfor pedagogy and assessmentThinking which is not Critical Thinking?The corollary to disagreement about what is Critical Thinking, isdifferences of opinion concerning what isn’t. There tend not to be clearlydefined outer-edges of the construct. The Facione Delphi study givessome clues:Not every useful cognitive process should be thought of as CT. Notevery valuable thinking skill is [a] CT skill. CT is one among a family ofclosely related forms of higher-order thinking, along with, for example,problem solving, decision making and creative thinking. The complexrelationships among the forms of higher-order thinking have yet to beexamined satisfactorily.It may matter less to Critical Thinking teachers than to Critical Thinkingtest-writers as to what defines the outer limits of the discipline. Testwritersface criticisms of construct validity, for example, that their test isreally testing the candidates’ ideology, common or backgroundknowledge, intelligence or creative thinking rather than, for example,inference, analysis or interpretation skills.Critical Thinking pedagogy: separate or infused?Not only is there some lack of clarity in the literature over what toinclude within a Critical Thinking curriculum, there is also someinconsistency concerning how the curriculum should be constructed.Is Critical Thinking:(a) something which should be taught as a separate discipline, or(b) something which is embedded or infused, either implicitly orexplicitly, within other subject domains?Whilst all Critical Thinking protagonists support the view that CriticalThinking should be part of students’ educational experience, the conflictis whether its provision should be embedded in subject domains or standalone as a separate academic discipline. Certainly, McPeck (1981) would,if anything, support the former view, asserting that:To the extent that Critical Thinking is not about a specific subject, X,it is both conceptually and practically empty. The statement “I teachCritical Thinking”, simpliciter, is vacuous because there is nogeneralised skill properly called Critical Thinking.RESEARCH MATTERS : ISSUE 3 / JANUARY <strong>2007</strong> | 3
PREDICTIVE VALIDITYDifficulties in evaluating the predictive validity ofselection testsJohn F. Bell <strong>Research</strong> DivisionWhen assessments are used for selection purposes there is a need toestablish their predictive validity. Although there is literature on thepredictive power of school examinations, much of it fails to appreciatethe complexity of the issues involved leading Wood (1991) to commentthat ‘the question has proved a seductive topic for statistical dilettantes’.More recently, there has been a growth in the use of tests to assist inthe admissions process of universities. There are two major reasons forthis growth: the need to ensure fair access and the current inability ofA-levels to distinguish between high attaining candidates (Bell, 2005a).The most selective higher education institutions have been findingthat the existing school examination system is no longer providingevidence of differences in individual merit for the highest attainingcandidates. An important question that is asked of selection tests is ‘dothey predict future performance?’Textbooks on educationalmeasurement usually recommend assessing this ‘predictive validity’ bycalculating the correlation coefficient between scores on the selectiontest and scores on an outcome variable such as degree classification, orthe score on a test at the end of the first year of the degree course.One of the most important problems associated with evaluating thepredictive validity of a selection test is that the outcome variable is onlyknown for the selected applicants. Ideally, to evaluate predictive validity arandom sample of applicants would be used. There are obvious difficultiesin practice (a selective university is never likely to replace an existingselection procedure with a lottery). It is almost always going to be thecase that there will be rejected candidates who will not have an outcomescore.To illustrate the effect of selection, a simulated data set of onethousand applicants was created (fuller details of this data set and theanalyses described here can be found in Bell 2006, in preparation). It wasassumed that the outcome, for example an examination mark, wasrelated to an underlying trait and that the two selection methods arealso related to the trait, that is, both tests correlate positively with theactivity measure and with each other. One test will be referred to as theselection test (which is being evaluated) and the other as the originalmethod (e.g. examination grades or interviews scores).Table 1 : Correlations between selection methods and outcomeSelection Test Original Method OutcomeSelection test 1.00Original method 0.28 1.00Outcome 0.56 0.54 1.00The correlations in Table 1 have been set at what can be considered tobe a realistic level. There are many factors that can determine outcomesin the real world that are not measured by any one test (indeed someinfluences can be the results of events that occur after the applicant hasbeen admitted). The low correlation between the two selection methodsindicates that they measure different traits and that both are importantpredictors.There are a number of different types of selection procedure. The firsttype is a simple lottery, referred to as RANDOM. When lotteries havebeen used for selection they have either been used with other methods,either in the form of weighted lotteries, for example Dutch medicalschool admissions (ten Cate and Hendrix, 2001), or one stage in amedical admission (lotteries are used at one UK medical school to reducethe number of applicants to a manageable size).The next type uses only the original method. This involves taking the nhighest scoring applicants on the original method where n is the numberof available places (taking the best n applicants is assumed for all theremaining rules). This is the situation when a selection test is beingpiloted so it is referred to as a PILOT because it corresponds to a pilotyear where the results of the selection test play no part in admissionsdecisions.The next method will be referred to as EVAL and involves only usingthe selection test and ignoring the original method. This would representthe situation when a test that is the sole method of selection is beingevaluated. Both PILOT and EVAL are examples of single hurdle rules.The remaining methods involve combining test scores. The first usesmultiple hurdles and will be referred to as HURDLES. This involvesselecting a fixed proportion of the entry with one test (e.g. the top 40%on the selection test) and then repeating this with another test (takingthe 50% with the highest scores on the original method from the top40% on the selection test). Multiple hurdles can be used when using allthe selection methods on all applicants is prohibitively expensive so thefirst test is used to reduce the number of applicants for the secondassessment. In this case, there are obviously multiple rules that could beapplied depending on the percentages used for the first hurdle.The next method of combining scores is compensatory and will bereferred to as COMPEN. This involves taking a weighted sum of thescores. In this article, equal weights have been used but obviously otherscould be used. The effect of changing the weights is to change the slopeof the line in panel (e) of Figure 1. In a compensatory method a very poorperformance on one test can be compensated by a very goodperformance on another. This differs from the multiple hurdles methodwhich guarantees a level of performance on all tests.Finally, there are hybrid methods which use both hurdles andcompensation and will be referred to as HYBRID (Figure 1(f)). These areprobably the most realistic in practice (e.g. a University admissionsdecision might depend on obtaining at least a grade B for a particularlyrelevant subject – a hurdle – and exceeding a particular UCAS score –a compensatory method). In the example used in this article, a hurdle isset taking the top 40% using the selection test and then the top 20%using the compensatory rule described above.RESEARCH MATTERS : ISSUE 3 / JANUARY <strong>2007</strong> | 5
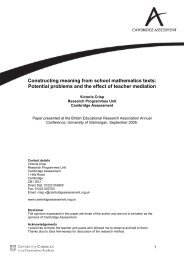
1009010090Figure 2 :Results of the selection80807070Outcome6050403020Outcome60504030102000102030405060708010102030405060708090100Selection testSelection test(a) RANDOM(b) PILOT`10090100908080Outcome70605040Outcome70605030402030105060708090100205060708090100Selection testSelection test(c) EVAL(d) HURDLES100100909080807070Outcome6050Outcome6050404030302030 40 50607080 90100205060708090100Selection testSelection test(e) COMPEN(f) HYBRIDIn the real world, only outcome data for the selected applicants isavailable. Scatter plots for the selected candidates are presented asFigure 2. Each part figure consists of a scatter plot of outcome againstselection test for the selected applicants with a lowess smoothed lineadded. An inspection of the figures suggests that there is considerablevariation in the strength of the relationship depending on the selectionmethod used (this is most noticeable in the increasing spread of pointseven allowing for the changes in the axes).RESEARCH MATTERS : ISSUE 3 / JANUARY <strong>2007</strong> | 7
Table 1 : Comparison of different selection methodsStatistics Correlations Grades—————————————— ——————————————— ————————————————————————Method N Mean Sd X1 X2 Xmean A B C D EAll 1000 45 17 0.56 0.54 0.69 20 40 60 80 100RANDOM 200 45 17 0.55 0.64 0.72 23 37 59 80 100PILOT200 58 15 0.55 0.27 0.57 48 70 88 99 100EVAL 200 58 15 0.35 0.52 0.55 45 73 87 96 100COMPEN 200 60 14 0.49 0.31 0.51 50 79 92 99 100HURDLES 200 60 14 0.49 0.31 0.51 50 79 92 99 100HYBRID 199 60 13 0.35 0.28 0.47 52 80 94 99 100RANORIG 199 53 15 0.55 0.39 0.61 34 59 80 95 100RANCOM 200 54 14 0.32 0.33 0.48 36 62 80 86 100(Note some rules involved ties so fewer than 200 were accepted)In Table 1 some summary statistics about the different selectionmethods have been presented: the number selected, the mean andstandard deviation of scores on the outcome variable for the selectedapplicants, correlations of the outcome with the selection test (X1),the original method (X2) and the mean of X1 and X2 (Xmean)respectively, and finally, the remaining five columns show the cumulativegrade distribution for the selected applicants by dividing all the candidatesinto five equally sized groups based on the outcome scores.Thus, themean score for the whole entry of 1,000 applicants is 45 with standarddeviation of 17 and the correlations with three selection measures are0.56, 0.54 and 0.69. By definition, 200 applicants in the whole entryobtained a grade A so a perfect selection method would give 100% Agrade applicants. Inspecting the table reveals that the three methods thatcombine scores are the most successful at selecting good candidates(note it would be wrong to draw a general conclusion because neither cutscoresnor weights have been optimised). It is important to note that thepredictive validity as measured by the uncorrected correlation coefficientdeclines as the selection methods become more effective.Clearly, considering the correlation without considering the selectionprocess can be very misleading. Suppose that the administration of aninstitution using the hybrid method squared the correlation and thenconcluded that the selection test only accounted for a relatively small12% of the variation in the outcome and so abolished the selection test.If there were no change in the entry so the selection for the next yearwould generate results similar to the ones generated by the PILOTmethod, the percentage of grade A and B students would fall from 80%to 70%. This example suggests that the effectiveness of a selectionprocedure is better evaluated by considering the change in performanceon the outcome variable rather than the correlation between scores onthe outcome variable and the selection test.One alternative to the simple correlation is to use a correctedcorrelation. However, the corrections vary with selection method and theavailability of data. Sackett and Yang (2000) produce a very useful reviewof these methods. The correction not only depends on the selectionmethod but also on the availability of the data on the original selectionmethods. In all cases, assumptions are made about the performance ofthe rejected applicants, the shapes of the relationships and thedistribution of the errors.More recently, research has been based on the fact that a selectionmethod can be thought of as a missing data mechanism. With selectiontests data are Missing Not At Random, abbreviated MNAR, and themissingness mechanism is termed non-ignorable. This has been appliedto research into compensatory rules. In Sweden there is a complicatedhigher education admittance to higher education. This compensatorysystem involves applicants either being admitted on the basis of anadmissions test or their school leaving certificate. Gustafsson andReuterberg (1998) investigated modelling incomplete data (Muthén,Kaplan and Hollis, 1987) and found it to be a very efficient method forestimating the predictive validity of selection tests.So far the assumption has been that if an applicant is accepted thenthey will take up the place at the institution. For most institutions this isnot the case, since the most able applicants, although offered places,often choose to go to another institution. This is sometimes referred toas self-selection. It can have serious consequences when evaluatingselection procedures. Consider two institutions P and Q. It is assumedthat institution P is trying to select the best 20% and every one offered aplace will take the place. Thus the second institution (Q) is only able toselect from the remaining 80% of the sample. For the purposes ofdiscussion, results for four decision rules have been generated:SELF1: The top 20% and the next 20% are selected by the originalmethod (as in Figure 3(a)).SELF2: The top 20% and the next 40% are selected by thecompensatory method (as in Figure 3(b)).RANSELF1: A random selection is made from the 80% remainingafter 20% is selected by the original method.RANSELF2: A random selection is made from the 80% remainingafter 20% is selected by the compensatory method.In Figure 3 the crosses represent the applicants selected by institutionP, the circles represent the applicants selected by institution Q and thepluses represent the rejected applicants. The two selections are verydifferent. In the first the applicants attending Q have very varied scoreson the selection test but do not vary much on the score from the originalmethod. In the second the two scores are inversely related with anapplicant with a high score on the original method having a low score onthe selection test and vice versa. The effect on the outcomes is thatpredicted gains from having a high score on the original method will becancelled out by the losses associated with a low score on the selectiontest. Obviously in the real world the effect of self-selection is not so clearcut because applicants apply to more institutions and do not necessarilyapply to the best institution where they could have gained a place orhave taken up the place if they applied and were successful.8 | RESEARCH MATTERS : ISSUE 3 / JANUARY <strong>2007</strong>
validity is the best basis for evaluating a selection test. The objective ofthe selection test is to select the students who will perform best on theoutcome measures. This leads to the conclusion that it might be better toevaluate the predictive validity of a selection procedure in terms of theimprovement in the quality of those selected. This could be based on achange in mean score or proportion of satisfactory students. The case ofa binary outcome is discussed in more detail in Bell (2005b, c).This article shows that it is possible that by using simplistic analysesthe benefits of using selection tests may have been underestimated. Forexample, in the late 1960s there was an experiment using a SAT-styletest in the United Kingdom (Choppin et al., 1972; Choppin and Orr,1976). The results of the experiments were considered to be somethingof a disappointment despite the fact that the test had been carefullydesigned. There was a considerable degree of selection, for example, only26% of those who sat the test were admitted to universities. The authorsof the reports used simple correlations and regression to analyse thedata. It is interesting to note the patterns of results for individualinstitutions for mathematics. The institution with the highestmathematics scores (presumably an institution not affected by selfselection)and so a very high degree of selection, had a correlation of0.36 for both the mathematics and verbal scores. However, thecorrelations were much lower and in some cases slightly negative for aninstitution which would have been selective and been affected by selfselection.From the simulation it is clear these results are consistent withan effective selection test, although it is also true this need not be thecase. The problem is that the analyses are based on simple correlations.This is not a criticism of the authors of both reports. Both theory and thetechnology have advanced a long way from the 1970s. However, it isreasonable to conclude that there is a possibility that the conclusionsabout the ineffectiveness of this test were erroneous.In conclusion, when a researcher makes a sweeping claim about theineffectiveness of an admissions test but bases their argument on anuncorrected correlation or a simple regression analysis and does notconsider the effects of selection, then there is a distinct possibility thatsuch a claim is mistaken. Higher education admissions are important andit is vital that care is taken with them. Thus it is vital that research intoadmissions tests address in full the complexities of the data that arisefrom their use.AcknowledgementsThe translations from Dutch were made by a colleague, Mark Claessen.ReferencesBell, J.F. (2005a). Gold standards and silver bullets: Assessing high attainment.<strong>Research</strong> <strong>Matters</strong>: A <strong>Cambridge</strong> <strong>Assessment</strong> Publication, 1, 16–19.Bell, J.F. (2005b). Evaluating the predictive validity of a selection test.Part 1 – Replacing an existing procedure. Submitted for publication.Bell, J.F. (2005c). Evaluating the predictive validity of a selection test.Part 2 – Supplementing an existing procedure. Submitted for publication.Bell, J.F. (2006). The effect of the selection method on the evaluation of thepredictive validity of a selection test. In preparation.Choppin, B.H.L., Orr, L., Kurle, S.D.M., Fara, P. & James, G. (1973). Prediction ofacademic success. Slough: NFER Publishing.Choppin, B. & Orr, L. (1976). Aptitude testing at eighteen-plus. Slough: NFERPublishing.Gustafsson, J.-E. & Reuterberg, S.-E. (2000). Metodproblem vid studier avHögskole-provets prognosförmåga – och deras lösning. [Methodologicalproblems in studies of the prognostic validity of the Swedish ScholasticAptitude Test (SweSAT) – and their solution] Pedagogisk Forskning i Sverige, 5,4, 273–284. (In Swedish with extensive English summary)Linn, R.L. & Dunbar, S.B. (1982). Predictive validity of admissions measures:correction for selection on several variables. Journal of College StudentPersonnel, 23, 222–226.Muthén, B., Kaplan, D. & Hollis, M. (1987). On structural equation modeling withdata that are not missing completely at random. Psychometrika, 42, 431–462.Sackett, P.R. & Yang, H. (2000). Correction for range restriction: An expandedtypology. Journal of Applied Psychology, 85, 112–118.ten Cate, T.J.T. & Hendrix, H.L. (2001). De eerste ervaringen me slectie [Initialexperience with selection procedures for admission to medical school].Nederlands tijdschrift voor geneeskunde, 14 Juli:145, 28, 1364–1368.Wood, R. (1991). <strong>Assessment</strong> and Testing: A survey of research. <strong>Cambridge</strong>:<strong>Cambridge</strong> University Press.Yang, H., Sackett, P.R. & Nho,Y. (2004). Developing a procedure to correct forrange restriction that involves both institutional selection and applicants'rejection of job offers. Organisational <strong>Research</strong> Methods, 7, 4, 442–455.PREDICTIVE VALIDITYUsing Thinking Skills <strong>Assessment</strong> in UniversityadmissionsJoanne Emery and John F. Bell <strong>Research</strong> DivisionIn the first issue of <strong>Research</strong> <strong>Matters</strong>, the difficulties involved in assessinghigh attaining candidates were discussed (Bell, 2005a). A particularproblem is that elite institutions are faced with selecting amongcandidates with the same grades on existing qualifications. Mostapplicants to the University of <strong>Cambridge</strong> are predicted, or have already,at least three grade As at A-Level. <strong>Cambridge</strong> University admissions stafftherefore requested that <strong>Cambridge</strong> <strong>Assessment</strong> (then known as UCLES)develop a ‘Thinking Skills <strong>Assessment</strong>’ (TSA) to assist in makingadmissions' decisions. When first proposed, the TSA was seen as a testthat would form part of the admissions interview process so that it couldbe taken by applicants during their interview visits to <strong>Cambridge</strong>. This hasthe advantage in the <strong>Cambridge</strong> context of allowing the use of the test10 | RESEARCH MATTERS : ISSUE 3 / JANUARY <strong>2007</strong>
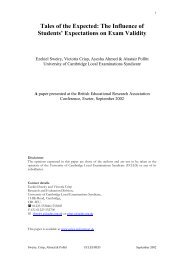
on a college-by-college and a subject-by-subject basis. At the time ofwriting, most <strong>Cambridge</strong> colleges use the TSA during the admissionsprocess and the range of subjects for which it is used varies from collegeto college. The test provides supplementary information for use in helpingto make admissions decisions. Obviously, to be meaningful, any suchselection tool must be able to predict future performance. This issue ofpredictive validity is the focus of this article.The <strong>Cambridge</strong> Thinking Skills <strong>Assessment</strong> (TSA) provides anassessment of two kinds of thinking: Problem Solving and CriticalThinking. Problem Solving describes reasoning using numerical, graphicaland spatial skills. It requires developing strategies for tasks throughthought and planning. Critical Thinking is often defined as ‘reasonable,reflective thinking that is focussed on deciding what to believe or do’(Ennis, 1996). Central to Critical Thinking are the concepts of argumentand evaluation. It requires the ability to interpret, summarise, analyse andevaluate arguments and ideas. With the TSA, the aim is to provide anassessment of Thinking Skills: intellectual skills that are independent ofsubject content and are generalisable to a wide range of subject areas.For example, the skill of Critical Thinking can be useful in subject areasranging from the Humanities (interpreting documents and evaluatingtheir arguments) and the Arts (following the reasoning of great thinkers)right through to the Sciences (appreciating advances in scientificdevelopment).<strong>Cambridge</strong> <strong>Assessment</strong> has a long history of developing tests underthe general heading of ‘Thinking Skills’. An item bank of former ThinkingSkills questions (items) was built up for this purpose. This gave anexcellent starting point for the development of the TSA. The test consistsof 50 multiple-choice questions, each with 5 possible answers, and has atime limit of 90 minutes. Questions assessing Problem Solving andCritical Thinking skills are mixed throughout the test and there are nopenalties for incorrect responses. In December 2001, 289 ComputerScience applicants took the TSA. This expanded to 472 in December 2002with more colleges and more subjects taking part.Up to this point the objective of the TSA work was the developmentand evaluation of the test itself but in <strong>January</strong> 2003 <strong>Cambridge</strong><strong>Assessment</strong> added a second objective: that of experimental onlinedelivery of the test. This software was developed specifically for<strong>Cambridge</strong> <strong>Assessment</strong> as a prototyping system. Both objectives weresuccessfully achieved: there was a greatly enhanced take-up of the test,with 23 colleges taking part involving 4 main subjects (ComputerScience, Engineering, Natural Sciences and Economics), and theadministration procedures were based around the online system we haddeveloped. A total of 1,551 tests were administered in that year: 1,114paper tests and 437 online tests. An especially valuable feature was theadministrative website used for making entries (registration) andreturning results. Online tests were marked automatically and paper testswere marked using scanning technology with intelligent characterrecognition. A website (http:// tsa.ucles.org.uk) is available giving detailsof the TSA with example and practice materials.This article reports on the 2003 TSA scores and the subsequent 1styear (Part 1A) examination results of Computer Science students (takenin Summer 2005). Of the 1551 candidates who sat the TSA in 2003, 238applied to study Computer Science. Of these, 94 received an offer of aplace and 144 were rejected. TSA scores are reported as a total calibratedscore and as separate calibrated Problem Solving and Critical Thinkingsub-scores. The calibration process allows the results of candidates takingdifferent versions of the test to be reported on a common interval scale.Figure 1 : Dot density plots showing the TSA 2003 score distributions ofcandidates who were offered a place (conditional or unconditional) andcandidates who were rejected for the Computer Science course20 30 40 50 60 70 80 90 100TSA Total Score20 30 40 50 60 70 80 90 100TSA Problem Solving Score20 30 40 50 60 70 80 90 100TSA Critical Thinking ScoreAdmissions DecisionAcceptedRejectedPlots showing the TSA score distributions of Computer Sciencecandidates who were offered a place (conditional or unconditional) andcandidates who were rejected are shown in Figure 1. These plots areparticularly helpful in evaluating whether the TSA is likely to be useful asa preliminary hurdle to reduce the number of interviews given (at thetime of writing it is rare for an applicant not to be interviewed). It can beseen that few of the accepted candidates had low scores. If the test wereRESEARCH MATTERS : ISSUE 3 / JANUARY <strong>2007</strong> | 11
selection procedure was essentially random (this is not plausible if thelogistic regression for selected applicants is positive). In practice, theconfidence level is not known. However, it is possible to investigate thepredictive validity of the test by considering a range of confidence values.Table 3 : Tau analyses comparing the probable success rates achieved using new(TSA-only) versus existing selection methodscomputer science part 1a 2005confidence in existing system: k=0.75New Predictor Measure————————————————–—TSA Total TSA Problem TSA CriticalScore Solving Score Thinking ScoreNumber of applicants 210 210 210Number accepted 67 67 67Number selected with new method 67 70 67Actual number of firsts achieved 16 16 16Predicted firsts for new method 16.2 16.3 16.4Observed success rate 0.24 0.24 0.24Predicted success rate of new method 0.24 0.23 0.24new/existing 1.0 1.0 1.0new/random 2.5 2.3 2.4existing/random 2.4 2.3 2.3confidence in existing system: k=0.5New Predictor Measure————————————————–—TSA Total TSA Problem TSA CriticalScore Solving Score Thinking ScoreNumber of applicants 210 210 210Number accepted 67 67 67Number selected with new method 68 67 67the colleges and for whom the number of 1st class results is known.The ‘selected’ group are those who would have been chosen on the basisof the TSA alone (the total score or its subscales). The ‘random’ group isakin to using a lottery method: its success rate considers the probablenumber of 1st class results for the entire applicant pool. The success ratesand ratios presented above compare the proportion or likely proportionof students gaining a 1st class outcome using the old, new and randomselection methods.The results suggest that, even when confidence in the existing systemis high, using the total TSA score alone would have resulted in at least thesame success rate as was obtained using the existing selection methods.If confidence is lower (k=0.5) then the total TSA score and the CriticalThinking component both outperform the existing selection system.However, it is not necessarily the case that the same candidates wouldhave been accepted. The comparison of existing versus new methodsshows the effect of changing from using all the information, including theTSA, to using the TSA alone. The success rates for both methods,however, are vastly superior to a random selection of candidates from theapplicant pool.In this article we have demonstrated that a Thinking Skills <strong>Assessment</strong>is useful in the University admissions process as an additional source ofevidence. Correlations with subsequent examination performance areimpressive, given the problems of restricted score ranges in such highlyselected candidates. Students attaining higher examination classestended to have achieved higher TSA scores and the tau analyses suggestthat selecting on the basis of the TSA alone would have produced atleast the same number of Class 1 results. In conclusion, there aresubstantive differences in Thinking Skills between candidates with threegrade As at A-Level and these differences predict their futureperformance. Thus a selection process involving the assessment ofThinking Skills is necessary.Actual number of firsts achieved 16 16 16Predicted firsts for new method 17.2 16.4 17.7Observed success rate 0.24 0.24 0.24Predicted success rate of new method 0.25 0.24 0.26new/existing 1.1 1.0 1.1new/random 2.1 1.9 2.1existing/random 2.0 1.8 1.9(Note: any differences between the numbers accepted and numbers selected with the new methodare due to tied ranks in TSA scores)The tau tables presented above show the case where k=0.75 (thusassuming high confidence in the existing system) and the case wherek=0.5. The ‘accepted’ candidates are those who were actually selected byReferencesBell, J. F. (2005a). Gold standards and silver bullets: Assessing high attainment.<strong>Research</strong> <strong>Matters</strong>: A <strong>Cambridge</strong> <strong>Assessment</strong> Publication, 1, 16–19.Bell, J. F. (2005b). Evaluating the predictive validity of a selection test.Part 1 – Replacing an existing procedure. Submitted for publication.Bell, J. F. (2005c). Evaluating the predictive validity of a selection test.Part 2 – Supplementing an existing procedure. Submitted for publication.Ennis, R.H. (1996). Critical Thinking. New York: Prentice-Hall.US Department of Labor, Employment Training and Administration (1999).Employer’s guide to good practices. (accessed at:http://www.chrysaliscorporation.com/pdf/Testing_and_<strong>Assessment</strong>_Guide.pdf)RESEARCH MATTERS : ISSUE 3 / JANUARY <strong>2007</strong> | 13
EXAMINATIONS RESEARCHFactors affecting examination success at A-levelCarmen L.Vidal Rodeiro and John F. Bell <strong>Research</strong> DivisionIntroductionPrevious research has shown that background information aboutstudents (such as gender or ethnicity) is an important predictor ofattainment (e.g. Gray et al. 1990, Haque and Bell 2001, Bell 2003, OECD2004 or Raffe et al. 2006). This previous research has also providedevidence of links between socio-economic characteristics of students andtheir educational attainment, for example, measures of socio-economicstatus, parents’ educational background, family structure and incomehave been shown to be important predictors of attainment at secondarylevel. Such factors have also been found to be strongly related tomeasures of prior attainment at entry to school.In this research we are going to use information from differentdatabases in order to investigate the contribution of students’ attainmentat GCSE, family background, schooling and neighbourhood to theirsuccess in GCE A-levels. We will focus on the students’ performance inGCE A-level in Chemistry.DataData on students’ examination results for the cohort of students thatwere 17 years old in 2004 were used. These data have been combinedwith the National Pupil Database (NPD) which incorporates ethnic group,first language, free school meals eligibility (FSM) and special educationneeds (SEN). A description of the NPD data is given in Vidal Rodeiro(2006).The inclusion of students’ previous attainment as an explanatoryvariable in a model allows the investigation of the effect of backgroundfactors on relative levels of attainment. The prior attainment of thestudents was based on the mean of their GCSE results using the usualpoints scale (A*=8, A=7, B=6, etc).School characteristics were derived using data from the awardingbodies’ national centre database and the 16+/18+ databases for theentire A-level entry in England in 2004. Schools offering GCE A-levelsubjects were classified into five categories: comprehensive andsecondary modern schools, further education (FE) and tertiary colleges,grammar schools, independent schools and sixth form colleges. Inaddition, the attainment group of the schools was computed as themean of the attainment of their students which was based on theirA-level points score. To compute this score, all students in the 2004cohort with at least three A-level results, excluding general studies, wereselected. The A-level grades for these students were converted into pointsusing the UCAS old tariff (A=10, B=8, C=6, etc) and the sum of thepoints of their three best A-levels was computed. Schools were thenallocated into five attainment groups.Table 1 shows the attainment group by school type. Around 83% ofthe grammar schools and 89% of the independent schools are in thehighest attainment group. This compares to the 10% of comprehensiveTable 1 : School attainment group by school type (column percentages)School Comprehensive Grammar Independent Sixth form FE/TertiaryAttainment schools schools schools colleges collegesGroupGroup I (Low) 4.2 0.0 0.2 0.4 17.2Group II 14.4 0.1 0.8 10.5 46.9Group III 29.5 1.3 2.8 44.3 21.2Group IV 41.8 15.2 7.7 28.1 14.6Group V (High) 10.1 83.4 88.6 16.7 0.0schools or the 17% of sixth form colleges. No FE/Tertiary colleges are inthe highest attainment group.A female ratio per school was computed (number of females takingA-levels in the school over the total number of students in the school;see Malacova, 2006, for details). If the female ratio was 1, the school wasconsidered a ‘Girls only’ school. If the female ratio was 0, then the schoolwas considered a ‘Boys only’ school. The rest of the schools wereconsidered coeducational or mixed schools. Sixth forms were alsoclassified into five groups according to their size (based on the number ofstudents in the upper sixth form): less than 30, 30 to 59, 60 to 119, 120to 239, and more than 240.Not everything that might have an influence on the students’success in a particular examination is the result of their previousattainment and the school characteristics. Students’ motivation andsubject preference, for example, might be important too. Further researchis being carried out by <strong>Cambridge</strong> <strong>Assessment</strong> about subject choice andmotivation.Recent studies have found that neighbourhood-level variables have animportant influence on educational attainment (e.g. Ensminger et al.,1996, OECD, 2004, Raffe et al., 2006). In this research, the characteristicsof the neighbourhood in which a school is situated are considered. Thereis a risk that the address of a school may not reflect its catchment area.For example, a school might be located near the boundaries of a wardthus attracting a large proportion of children from other wards, or aschool could have been affected by parental choice. These problemscould be removed if it were possible to use the postcodes of thestudents’ home address (instead of the postcodes of the schools), inconjunction with the ward level census data, but these data were notavailable to us. Despite these limitations, significant correlations can beidentified between school examination performance and variousindicators derived from the ward level census data.Data about electoral wards in England were obtained from theNeighbourhood Statistics Service managed by the Office of NationalStatistics and it was matched to the postcodes of the schools. In thisresearch we focus on the following factors: parental unemployment,parental qualifications, car ownership, density of population (proxy forrural/urban areas), lone parent status, ethnicity and deprivation index.14 | RESEARCH MATTERS : ISSUE 3 / JANUARY <strong>2007</strong>
MethodsA multilevel modelling technique was used. Multilevel models allowfor the clustering of individuals within schools and they do not violatethe assumption of independence of observations that traditionalordinary least squares analysis commits when analysing hierarchicaldata. For example, individual students are grouped into schools;students in the same school may have more in common than withstudents in other schools. Multilevel models take account of thishierarchical structure of the data and produce more accuratepredictions.The modelling process was conceived as a two-level model in whichstudents (level 1) were nested in schools (level 2). The explanatoryvariables (prior attainment, gender, school characteristics, etc.) wereentered into the fixed part of the model. The outcome measure is theattainment at the completion of the A-level stage.The models were fitted using the programme MLwiN (Rasbash et al.,2005). They were run for various combinations of students and schoolcharacteristics and background and socio-economic factors.ResultsThe total number of students obtaining an A-level in Chemistry in 2004was 27,867. More than 50% of these students obtained at least grade B.32% of these students obtained grade A. Only 5% failed to obtain atleast grade E. Table 2 shows the number and percentage of students perschool type and school gender that obtained an A-level in Chemistry andTable 3 shows the grade distribution by type of school.Table 2 : Number of A-level Chemistry students by school type and schoolgenderNumber ofstudentsSchool Type Comprehensive 10722 38.5Grammar 3773 13.5Independent 6349 22.3Sixth Form 1635 5.9FE/Tertiary 885 3.2School Gender Boys 2180 7.8Girls 3478 12.5Coeducational 17921 64.3Percentage ofstudentsPercentages shown in Table 3 are column percentages. Among all thestudents that obtained grade A in their Chemistry A-level, around 42%studied in an independent school, 20% in a grammar school, 6% in asixth form college and 31% in a comprehensive school. From this table,it is possible to see that there are differences in the performance ofstudents by type of school but do they disappear when we adjust forother factors, such as students’ attainment?We first studied students’ characteristics. Secondly, additional modelswere fitted for various combinations of school characteristics. Finally,characteristics of the neighbourhood where the schools were locatedwere introduced.In the following we will report the results obtained when only studentsobtaining grade A and at least grade E were considered.Table 3 : A-level Chemistry grade distribution by type of school (% from eachschool type obtaining each grade)School TypeGrade AFor these analyses, the dependent variable takes the value 1 if thestudent obtained grade A and 0 otherwise.The results of a first model which included the gender of the student,the prior attainment (in all the analyses the mean GCSE was centred onits mean value of 6.77) and their interaction are reported in Table 4. If b isthe logistic regression coefficient for a particular variable (estimate), thenexp(b) is the odds ratio. The odds ratio for each independent variablegives the relative amount by which the odds of obtaining a grade Aincrease (O.R. greater than 1) or decrease (O.R. less then 1) when thevalue of the independent variable is increased by one unit.For example, the variable ‘male’ is coded as 0 (=female) and 1 (=male)and the odds ratio for this variable is 2.2. This means that the odds ofmales obtaining grade A are 2.2 times higher than the odds of females.Table 4 : Individual characteristics I 1Grade———————————————————————A B C D E UComprehensive 31.4 44.9 53.7 62.5 66.0 72.4FE/Tertiary College 0.8 1.6 2.3 2.9 3.2 4.4Grammar 19.6 18.3 15.2 12.3 11.4 8.8Independent 42.5 27.8 20.5 14.6 11.7 6.6Sixth Form College 5.7 7.4 8.3 7.7 7.7 7.8Estimate Standard Error Odds RatioConstant -1.914 0.044Male -0.806 0.053 2.2Mean GCSE -3.234 0.066 25.4Male*Mean GCSE -0.435 0.087 0.6School-level variance -0.406 0.0371. Estimates in bold indicate statistical significance at 0.05 level.Figure 1 shows the predicted probability of obtaining grade A by meanGCSE generated by the estimates in Table 4. Although, on average, malestudents are less likely to obtain a grade A for any given value of meanGCSE, the difference is smaller for the most able male students. There aretwo difficulties with interpreting these data. First, relative progress isbeing considered and the sex difference can be related to the mean GCSEperformance or to the A-level performance or to both. Second, there areFigure 1 : Predicted probability of obtaining grade A by mean GCSE(solid line for females and dashed line for males)Probability of obtaining grade A1.00.80.60.40.20.03.5 5.0 6.5 8.0mean GCSERESEARCH MATTERS : ISSUE 3 / JANUARY <strong>2007</strong> | 15
selection effects, for example, it is possible that the motivation ofstudents differs between groups.There was a large number of students who had their ethnic group andother personal data missing (e.g. PLASC data does not include resultsfrom some independent schools or non-maintained special schools). Inorder to study the effect of the ethnicity we used a reduced data set(15,613 students, 56% of the original data), where data about ethnicity,first language, free school meals eligibility and special education needswere available.Substantial differences appeared between ethnic groups (Table 5). Ofcourse, these differences could be the result of other variables that havenot been included in the model but vary by ethnic group. Additionally,some of the ethnic groups are very broad and if they were split theresults could differ. After controlling for students’ attainment, the resultsshow that in comparison to the ‘white’ group, Bangladeshi, African,Chinese or Indian students have a higher probability of obtaining grade A.Table 5 : Individual characteristics IIEstimate Standard Error Odds RatioBangladeshi -0.438 0.142 1.5African -0.570 0.194 1.8Caribbean -0.230 0.517 0.8Chinese -0.447 0.185 1.6Indian -0.678 0.110 2.0Mixed -0.609 0.162 1.8Other ethnic group -0.435 0.132 1.5Language – not English -0.084 0.100 0.9FSM -0.292 0.170 0.7SEN -0.178 0.444 1.2Next, school type, school gender, school attainment and school sizewere included in the model as sets of dummy variables. Comprehensive,coeducational, attainment group 1 and size 1 schools were assigned thebaseline. Since prior attainment was significant as an individual factor ofexamination success, it was also included. Results for this model aredisplayed in Table 6.The odds of obtaining grade A for a student attending a grammarschool are 0.9 times the odds of a student attending a comprehensiveschool (although this effect is not significant). However, if the studentattends a sixth form college or a FE/Tertiary college, the odds ofobtaining grade A are 1.8 and 1.5, respectively. Therefore, studentsattending sixth form or FE/Tertiary colleges have a positive advantage intheir A-level Chemistry outcome.Separate models were fitted to find out the effects of the school typewhen the school attainment group is not considered. In that case, theeffects of grammar and independent schools on attainment in A-levelChemistry are positive and significant. There is, however, no evidencethat independent schools do better on average than other types ofschools once prior attainment has been taken into account.After controlling for students’ prior attainment, the school attainmentgroup plays an important role in the success of a student takingChemistry A-level. The higher the attainment of the school, the larger theodds of getting grade A. This supports the results found by Rutter et al.(1979) who reported that when students of similar prior attainment atthe point of entry attending schools with differing proportions of moreTable 6 : School characteristicsEstimate Standard Error Odds RatioConstant -2.848 0.341Grammar -0.118 0.094 0.9Sixth Form -0.586 0.120 1.8Independent -0.111 0.097 1.1FE/Tertiary College -0.414 0.149 1.5Boys school -0.134 0.091 1.1Girls school -0.400 0.077 0.7Attainment 2 -0.837 0.269 2.3Attainment 3 -0.892 0.261 2.4Attainment 4 -1.109 0.259 3.0Attainment 5 -1.475 0.265 4.4Size 2 -0.259 0.238 1.3Size 3 -0.221 0.224 1.3Size 4 -0.213 0.228 1.2Size 5 -0.112 0.238 1.1Mean GCSE -2.842 0.044 17.2School-level variance -0.348 0.035able students, those attending the schools with the higher percentages ofmore able students did better in their examinations.Attending a single sex school has different effects on success. The oddsof obtaining grade A for a student attending a ‘Boys’ school are 1.1 theodds of a student attending a coeducational centre. However, the odds ofobtaining grade A for a student attending a ‘Girls’ school are 0.7 the oddsof a student attending a coeducational centre. This last result could bedue to a school selection and/or motivation effect: highly motivated girlswho wanted to study Chemistry might have decided to attend a mixedsixth form because of the traditional belief that ‘Boys schools’ werebetter at science subjects (many ‘Boys schools’ have mixed sixth forms).The size of the school does not seem to be associated with thestudents’ success in Chemistry A-level.Although many of the effects of the individual and schoolcharacteristics can be understood and interpreted by observing thecoefficients in previous tables, it is always useful to consider a plot ofthese effects (Figure 2). Any variable whose line intersects with thevertical zero axis can be regarded as not significant (at the 5% level) andthe length of the line gives an indication of the relative size of the group,for example, the number of Caribbean students is low. Positive valuesimply a positive relationship with the outcome; negative values implythat the probability of obtaining grade A in Chemistry at A-leveldecreases with higher values of the background variable. From this figure,we can see at a glance which variables are strongly related to theprobability of obtaining grade A, both positively and negatively, andwhich ones seem to have much less definite relationships, even if theyare statistically significant.The variable that has the largest positive effect on obtaining grade Ain Chemistry A-level is the prior attainment at GCSE. The averageperformance of the students in a centre (school attainment) is also asignificant predictor of individual success at A-level. The effects of centretype are small in comparison, in particular the effects of attending agrammar or an independent school.Based on this graph, although the prior attainment has the highestimpact on the probability of obtaining grade A at A-level, other factorssuch as school characteristics explain a substantial proportion of the16 | RESEARCH MATTERS : ISSUE 3 / JANUARY <strong>2007</strong>
Single sex school - GirlsSingle sex school - BoysSENSchool type - Sixth FormSchool type - IndepSchool type - GrammarSchool type - FE/TertiarySchool Attainment 5School Attainment 4School Attainment 3School Attainment 2LanguageGenderGCSE*GenderGCSEFSMEthnicity - OtherEthnicity - MixedEthnicity - IndianEthnicity - ChineseEthnicity - CaribbeanEthnicity - BangladeshiEthnicity - African-2.00 -1.00 -0.00 1.00 2.00 3.00 4.00Figure 2 : Effects of the individual and school characteristics (grade A)variation in the students’ outcomes. For the model in Table 6, theexplained proportion of the variance was computed (Snijders and Bosker,1999) and it has a value of 0.59. The unexplained proportion can bepartitioned between school and candidate as 0.05+0.36, which meansthat 5% of the variation is unexplained variation at the school level and36% is unexplained variation at student level.Further models that included socio-economic factors in the form ofneighbourhood characteristics were fitted. Their effects, without takinginto account prior attainment, are shown in Figure 3.Number of carsNo carsLone ParentLevel 4/5 qualificationsLevel 3 qualificationsEmployment RateDeprivation IndexDensity of Population% White people% Pakistani people% Indian People% Chinese people% Black people% Bangladeshi people-0.10 -0.05 -0.00 0.05 0.10 0.15 0.20 0.25Figure 3 : Effects of the neighbourhood characteristics – no prior attainment(grade A)The variable that has the largest positive effect on obtaining grade A isbeing in a neighbourhood with a high percentage of Chinese people. Also,a school situated in a neighbourhood where there is a large percentage ofpeople with at least Level 4/5 qualifications has a positive effect on thestudents’ success in Chemistry A-level. An area with a high number oflone parents with children has an important and significant effect but inthis case negative. The impact of these factors is very small incomparison with the effect of the prior attainment or some of the schoolcharacteristics (see Figure 2).Table 7 shows only the significant neighbourhood characteristics afteradjusting for prior attainment. Their distributions can be found in VidalRodeiro (2006). Prior attainment measures are likely to incorporatedeprivation effects that operate during earlier childhood years, and weshould therefore be conservative in our estimates of the magnitude ofthe total effect of deprivation.Table 7 : Neighbourhood characteristics (prior attainment)Estimate Standard Error Odds RatioLone parent -0.03506 0.01034 0.9Level 3 qualifications -0.01029 0.00234 0.9Level 4/5 qualifications -0.07281 0.01389 1.1% Chinese people -0.16751 0.03504 1.2% Indian people -0.01102 0.00487 1.0Deprivation Index -0.00039 0.00018 0.9Grade EDo the factors (individual, school or neighbourhood characteristics) thathave an effect on the probability of obtaining grade A, have an effect onthe probability of obtaining other grades? In this section, we repeat theprevious analyses but the dependent variable takes the value 1 if thestudent obtains at least grade E and 0 otherwise.For at least grade E, gender and mean GCSE are still statisticallysignificant. However, the odds of obtaining at least grade E for a boy areonly 1.3 times the odds of a girl obtaining at least grade E compared tothe 2.2 for grade A. The effect of prior attainment is, as expected, muchlower.Having a mixed background or being Chinese does not have asignificant effect on the probability of obtaining at least grade E. BeingBangladeshi, African, Indian or part of other ethnic groups has a positivesignificant effect on the outcome and this effect is larger for at leastgrade E than for grade A.Another difference between grade A and at least grade E is that for thelatter the first language has a significant effect and the odds of obtainingat least grade E for a student with a first language other than English are0.6 times the odds of a student whose first language is English.In a following step a model with the school level characteristics plusstudents’ prior attainment was fitted. The odds of obtaining at leastgrade E for a student attending a particular type of school are verysimilar to those for grade A. However, only ‘attending a FE/Tertiarycollege’ has a significant effect on the outcome. As before, the schoolattainment group plays an important role in the success of a studenttaking Chemistry A-level. The higher the attainment of the school, thelarger the odds of obtaining at least grade E. The effect of school genderand school size is the same as for grade A.To summarise, Figure 4 displays the effects of the individual and schooltype characteristics on the probability of obtaining at least grade E.Table 8 shows the results obtained when models were fitted withsocio-economic factors taken into account. The factor that has thelargest positive significant effect on the probability of obtaining at leastRESEARCH MATTERS : ISSUE 3 / JANUARY <strong>2007</strong> | 17
Single sex school - GirlsSingle sex school - BoysSENSchool type - Sixth FormSchool type - IndepSchool type - GrammarSchool type - FE/TertiarySchool Attainment 5School Attainment 4School Attainment 3School Attainment 2LanguageGenderGCSE*GenderGCSEFSMEthnicity - OtherEthnicity - MixedEthnicity - IndianEthnicity - ChineseEthnicity - CaribbeanEthnicity - BangladeshiEthnicity - African-2.00 -1.00 -0.00 1.00 2.00 3.00 4.00Figure 4 : Effects of the individual and school characteristics (at least grade E)grade E is the employment rate. As the percentage of employed people inthe neighbourhood increases, so the probability of obtaining at leastgrade E does. Being in a neighbourhood with high percentages of singleparentfamilies has a negative effect on the probability. Another factorthat has a negative effect is the percentage of ethnic minorities (Chinese,Indian, Black and Bangladeshi). Being in a neighbourhood with highpercentages of white people has a positive effect on attainment.Table 8 : Neighbourhood characteristics (prior attainment)Estimate Standard Error Odds RatioLevel 3 qualifications -0.01782 0.00374 1.0Level 4/5 qualifications -0.07089 0.02276 0.9% Chinese people -0.27535 1.50448 0.7% Black people -0.03296 0.00808 0.9% White people -0.01170 0.00257 1.0% Indian people -0.01925 0.00610 0.9% Bangladeshi people -0.03499 0.01311 0.9No cars -0.00011 0.00004 1.0Employment Rate -0.02433 0.00608 1.0Population Density -0.00794 0.00134 0.9Conclusions and discussionThe effects of basic explanatory factors (e.g. prior attainment andgender) made statistically significant contributions to the success inA-level Chemistry. Having taken into account prior attainment, severalschool effects also proved significant, in particular the averageperformance of the students in a school is a significant predictor ofindividual success.With regard to the effect of the school type, given a mean GCSE score,the probability of obtaining grade A is slightly higher if the studentattended a sixth form college or an FE/Tertiary college than if the studentattended a grammar or a comprehensive school. However, if a sixth formhas an able entry, that is, has many pupils who did very well in theirGCSEs, then, on average, it does not matter which type of school it is.However, these are average effects and there is still considerable variationbetween individual schools that is large enough to cancel out theseeffects.Substantial differences appeared between ethnic groups. The resultsshow that in comparison to the white group, other ethnic groups havesignificantly higher probability of obtaining grade A but their effectsare not significant when modelling the probability of obtaining at leastgrade E. However, all the differences described might not be attributedentirely to ethnicity. Different ethnic groups have different socioeconomicprofiles and consequently it is not possible to saycategorically whether the differences observed are the result of ethnicdifferences per se or whether socio-economic or other factors play apart.By comparing the significant explanatory variables included in thedifferent models, our findings show that when prior attainment data arelacking, other student background and school context informationexplain the students’ success at A-level Chemistry. However, priorattainment has, by far, the largest impact on the success.All models give very similar percentages of the school and pupil levelvariance explained, but the one described in Table 6 gives the highestpercentages, showing that school characteristics (type, attainment andgender) explain more about the students’ performance than theneighbourhood characteristics. The unexplained percentage of thevariation in the models fitted in this article is around 42%. The amount ofschool level variance unexplained is relatively small (around 4–5%) butthe unexplained variation at student level is around 36–38%, suggestingthat the individual students' characteristics are much more importantthan the school they attend. Also, the amount of unexplained variation atstudent level could be due to the fact that other variables that have notbeen included in the model (e.g. subject preference, motivation) mayhave an influence on students’ success.A conceptual limitation of all regression techniques is that one canonly ascertain relationships, but never be sure about the underlyingcausal mechanism. Therefore, caution must be taken when interpretingthe results of the regression analyses shown in this article. In thisresearch, we found significant relationships between some individual,school or socio-economic characteristics and attainment. However, theymay not be the result of a causal relationship.ReferencesBell, J.F. (2003). Beyond the school gates: the influence of school neighbourhoodon the relative progress of pupils. Oxford Review of Education, 29, 4, 485–502.Ensminger, M.E., Lankin, R.P. & Jacobson, N. (1996). School leaving: a longitudinalperspective including neighbourhood effects. Child Development, 67,5,2400–2416.Gray J., Jesson, D. & Sime, N. (1990). Estimating differences in examinationperformance of secondary schools in six LEAs: a multilevel approach to schooleffectiveness. Oxford Review of Education, 16, 2, 137–158.Haque, Z. & Bell, J.F. (2001). Evaluating the performances of minority ethnicpupils in secondary schools. Oxford Review of Education, 27, 3, 357–368.Malacova, E. (2006). Effect of single-sex education on progress in GCSE. OxfordReview of Education. In press.OECD (2004). Learning for Tomorrow’s World. First Results from PISA 2003. Paris:OECD Publications.18 | RESEARCH MATTERS : ISSUE 3 / JANUARY <strong>2007</strong>
Raffe, D., Croxford, L., Iannelli, C., Shapira, M. & Howieson, C. (2006). Social-ClassInequalities in Education in England and Scotland. Special CES Briefing No. 40.Edinburgh: CES.Rasbash, J., Browne, W., Healy, M., Cameron, B. & Charlton, C. (2005). MLwiNversion 2.02. London: Institute of Education.Snijders, T. and Bosker, R (1999). Multilevel analysis. An introduction to basic andadvanced multilevel modeling. London: Sage Publications.Vidal Rodeiro, C.L. (2006). Factors determining examination success at A-level: astudy focussed on A-level Chemistry and A-level Business Studies. InternalReport. <strong>Cambridge</strong>: <strong>Cambridge</strong> <strong>Assessment</strong>.Rutter, M.L., Maugham, B., Mortimore, P., Ousten, J. & Smith, A. (1979). Fifteenthousand hours. London: Open Books.EXAMINATIONS RESEARCHA-level uptake: ‘Crunchier subjects’ and the‘Cracker effect’John F. Bell, Eva Malacova, Carmen L.Vidal Rodeiro <strong>Research</strong> DivisionMark Shannon New DevelopmentsOne of the claims made about A-levels is that students are opting for theallegedly easier subjects at A-level. For example, Boris Johnson stated inthe Observer (July 9, 2006) that ‘This year, as every year for the last twodecades, we are seeing a drift away from crunchier subjects such assciences, maths and languages.’ More recently, <strong>Cambridge</strong> Universityproduced a list of A-level subjects that provide a less effectivepreparation for their courses, for example, Business Studies, MediaStudies, and Physical Education, Sports Studies. On their website(http://www.cam.ac.uk/admissions/undergraduate/requirements/),it is stated ‘To be a realistic applicant, <strong>Cambridge</strong> applicants would beexpected to have no more than one of these subjects’ 1 . It must bestressed that the term ‘less effective preparation’ refers to the coursesoffered by what is a highly selective university – these A-levels can behighly relevant and effective preparations for courses offered by otherhigher education institutions. It is also worth noting that some subjectsnot on the list had to struggle to gain acceptance. For example, Tillyard(1958) wrote:… [in 1878] it was unthinkable that English should be recognised as anindependent study; it could enter <strong>Cambridge</strong> only on the warrant of afaint respectability reflected from modern languages.Opponents of English could be quite outspoken, for instance, EdwardAugustus Freeman, the Regius Professor of Modern History at Oxford, in abroadside published in 1887 in the London Times wrote:There are many things fit for a man's personal study, which are not fitfor University examinations. One of these is "literature."… [We aretold] that it "cultivates the taste, educates the sympathies, enlargesthe mind." Excellent results against which no one has a word to say.Only we cannot examine in tastes and sympathies.As late as 1965, Robson used the first lecture arranged by the F.R.Leavis Lectureship Trust to argue that English Studies met theconventional criteria for admission to a studium generale 2 . Also, in 1887the congregation of Oxford University voted against an Honour Schoolof Modern European Languages. The Warden of All Souls objectedbecause of ‘the depreciation and exclusion of Greek and Latin’ and that‘it confused the whole conception of academical studies, and draggedthe subjects fit for more advanced years into undergraduate life’(Times, 7 November, 1887). However, as Emperor Loathair I (795–855)said ‘Tempora mutantur, nos et mutamur in illis’. 3 Whilst it might bepossible to idly speculate what a Regius Professor of Media Studies at a22nd century <strong>Cambridge</strong> University might make of the current situation,it is probably more informative to consider what exactly is happeningwith A-levels and determine if the changes are as dramatic as is impliedin the media.In this article we investigate the uptake of A-levels in England. Weconsider the A-level results for all year 13 students (eighteen-year-olds)in 2001 to 2005 (more detailed analyses for the earlier years can befound in Bell, Malacova and Shannon, 2003, 2005 4 ). This period coversthe transition to Curriculum 2000 because the new A-levels that werestarted then were completed in 2002. This reform split A-levels into two.First, a free standing qualification called the Advanced Subsidiarycovering the first year of the course was introduced. Secondly, the A-levelwas obtained by combining results of AS modules with A2 modules. Theaim of this reform was that students would study for four or five subjectsat AS in the first year of the sixth form and then choose three of them tocontinue on to A-level. The objective of this reform was to broaden thecurriculum and to provide more balance. This is seen as a desirableoutcome in many areas of higher education. For example, all medicalschools (except Dundee and Edinburgh) encourage potential applicantsto take a combination of science and non-science subjects (Clarke,2005). These medical school policies have implications for the A-levelscience uptake for the higher attaining candidates. Given that Chemistryis nearly always compulsory and Biology often is, then the effect wouldbe most pronounced in Physics and Mathematics. In general, there aretwo processes that need to be considered. First, broadening the1. There are exceptions and it is always advisable to check the <strong>Cambridge</strong> University website forthe precise requirement for a course.2. A recognised university. Originally an institution recognised by the Holy Roman Empire andwhose status was confirmed by Papal Bull. <strong>Cambridge</strong> was formally acknowledged as one in1290.3. For those who have not had a classical education: ‘Times are a-changing and we change withthem.’4. The analyses differ from those in this article because they include General Studies A-level.RESEARCH MATTERS : ISSUE 3 / JANUARY <strong>2007</strong> | 19
curriculum would lead to a decline in the number of science A-levels asscience specialists are encouraged to take other subjects. Secondly, thereverse process is true for non-scientists. In both cases, the change islikely to affect the student’s least favourite or least relevant subject. Thisargument means these changes only affect the pool of qualifiedcandidates actually applying for higher education courses when studentschange their future plans during their A-level studies, for example,students who would have taken only science A-levels but whosubstituted Physics with a non-science would have been unlikely tocontinue with Physics after A-level had they remained science specialists.Uptake of the most common A-level subjectsIn Tables 1–3, the uptake of A-level subjects (strictly, the subject has beendefined by the subject code used in the database rather than thespecification name) with the highest entries is presented. For clarity,these subjects have been divided into three groups: science andmathematics; arts, languages and sports science; social science andhumanities. Candidates were classified by sex and prior attainment atGCSE level. The GCSE grades for the candidates were converted intoscores (A*–8, A–7, B–6, etc.) and a mean GCSE score was computed andused to divide the candidates into three attainment groups: low, mediumand high. The cut scores were chosen such that they divided the wholeA-level entry in three approximately equally sized groups and werecarried over for future years. Uptake by attainment is an important issue.Since elite institutions are more likely to require good grades andcandidates with higher prior attainment are more likely to obtain suchgrades, it follows that changes in uptake of subjects by high attainingstudents can have important implications on the pool of availableapplicants for courses at these institutions.Table 1 presents the percentages of A-level students (i.e. having oneA-level result) taking each of English and modern language subjects.Changes over the whole period greater than 2 percentage points havebeen identified in bold for declines and italics for increases. For all thesubjects in this group, uptake is much greater for female students. Uptakealso increases with increasing prior attainment for English Literature andthe modern languages. There has been a decline in the uptake by femalestudents for English Literature, French and German. This decline is alsoassociated with medium and high prior attainment.In Table 2 uptakes for arts, media studies and sport studies arepresented. The highlighted trends are a decline of females taking Art andDesign associated with the change to Curriculum 2000, an increase inDrama uptake, an increase in Media Studies at the time of the change toCurriculum 2000 and an increase in uptake of Sports Studies bycandidates with medium prior attainment.Table 3 is for the humanities and social sciences. Three subjects,Business Studies, Economics, and Geography are all declining except forcandidates with high prior attainment. The ‘crunchy’ subject, History, hadan increased uptake by males as did Politics. The increase in Politics wasassociated with male and high prior attainment candidates. Religiousstudies was also increasing in popularity. However, the largest changesare associated with Psychology which has the largest increase of anyA-level subject, for example, almost one in four females taking three ormore A-levels take Psychology. This has been referred to as the ‘Cracker 5effect’ because it is argued that uptake has been influenced by the5. A slang term for a criminal psychologist and used as a name for a popular TV series about one.Table 1 : Changes in uptake in English and Modern Languages(% of students with at least one A-level result)Year English English English French German SpanishLanguage LiteratureAll 2001 7 6 21 7 4 22002 6 7 21 6 3 22003 6 6 20 6 3 22004 6 6 20 6 2 22005 6 8 20 6 2 2Male 2001 4 4 13 4 2 12002 4 5 14 4 2 12003 4 5 12 4 2 12004 4 4 12 4 2 22005 4 6 14 4 2 2Female 2001 9 8 29 9 4 32002 8 8 27 8 4 32003 7 8 26 7 3 32004 8 8 26 6 4 22005 8 8 26 6 2 2Low 2001 8 7 16 2 1 12002 7 7 17 1 1 12003 6 7 15 1 1 12004 6 6 14 2 2 02005 6 8 16 2 2 0Medium 2001 7 7 23 6 3 22002 7 8 21 4 2 22003 7 8 20 4 2 12004 6 8 20 4 2 22005 8 8 20 4 2 2High 2001 5 4 26 14 6 42002 6 5 25 12 5 42003 5 5 24 11 5 42004 4 6 22 10 4 42005 4 6 24 10 4 4Table 2 : Changes in uptake of Arts, Media and Sport/PE studies(% of students with at least one A-level result)Year Art & Des. Drama Media/Film/ Music Sport/TV. Stds.P.E.Stds.All 2001 9 4 6 2 72002 10 6 8 3 72003 10 6 8 3 82004 8 6 8 2 82005 8 6 8 2 8Male 2001 7 2 5 2 92002 7 3 7 2 102003 8 4 7 2 112004 8 4 8 2 102005 8 4 8 2 10Female 2001 11 5 6 3 52002 8 8 8 3 52003 9 8 9 3 52004 8 8 10 2 62005 8 8 10 2 6Low 2001 10 4 9 1 102002 11 7 12 2 102003 11 7 13 1 112004 10 6 14 2 102005 10 6 14 2 10Medium 2001 10 4 6 2 82002 11 7 9 2 92003 12 7 9 2 102004 10 6 10 2 102005 10 8 10 2 10High 2001 8 3 2 4 32002 9 5 3 3 42003 10 5 4 4 52004 10 6 4 4 42005 10 6 4 4 620 | RESEARCH MATTERS : ISSUE 3 / JANUARY <strong>2007</strong>
Table 3 : Changes in uptake in Humanities and Social Sciences(% of students with at least one A-level result)Group Year Busi. St. Econ. Geog History Law Politics Psych. Relig. Stds. Socio.All 2001 14 7 15 15 3 3 10 3 92002 13 6 15 17 4 3 13 4 92003 13 6 14 16 4 4 14 5 92004 12 6 14 16 4 4 16 6 102005 12 6 12 18 6 4 18 6 10Male 2001 16 10 18 15 3 4 5 2 42002 17 9 17 17 3 4 6 2 42003 16 9 17 17 4 5 7 3 42004 16 8 16 18 4 4 8 4 42005 14 8 14 18 4 6 10 4 4Female 2001 12 4 13 15 4 3 15 5 132002 10 3 12 16 4 3 18 5 132003 10 3 12 16 5 3 20 6 132004 8 2 12 16 6 2 22 6 122005 8 2 10 16 6 2 24 8 14Low 2001 17 4 11 10 5 2 11 3 132002 15 3 11 11 5 2 12 3 122003 15 2 10 10 5 2 13 4 122004 14 2 8 10 6 2 14 4 122005 12 2 8 10 6 2 14 4 12Medium 2001 17 7 18 16 3 3 12 4 102002 16 5 16 16 4 3 16 4 112003 16 5 16 16 5 3 18 5 112004 14 4 14 16 6 4 20 6 122005 14 4 14 16 6 4 22 6 12High 2001 8 9 17 21 2 4 7 4 42002 9 9 17 22 2 4 11 5 52003 8 9 16 22 3 5 13 5 52004 8 8 16 22 4 4 14 6 62005 8 8 16 22 4 6 14 6 6Table 4 : Uptake of Science and Mathematics subjects(% of students with at least one A-level result)Year Biology Chem. Com. Stds D & T design ICT Maths Further Maths PhysicsAll 2001 19 16 5 2 3 24 2 132002 19 14 4 6 7 19 2 132003 18 13 4 6 7 19 2 122004 18 14 2 6 6 20 2 102005 18 14 2 6 6 18 2 10Male 2001 16 18 9 4 4 32 4 222002 16 15 8 9 10 26 3 212003 15 14 7 9 10 26 3 202004 14 14 6 9 8 26 4 182005 16 16 4 9 8 26 4 18Female 2001 22 14 1 1 2 17 1 52002 22 14 1 4 4 13 1 52003 20 13 1 4 5 13 1 52004 20 12 * 4 4 14 * 42005 20 12 * 4 4 12 * 4Low 2001 9 5 6 3 4 8 * 52002 7 3 4 8 9 4 * 42003 6 3 3 8 10 4 * 32004 6 4 2 8 8 6 * 42005 6 4 2 8 8 6 * 4Medium 2001 19 12 6 3 3 21 1 112002 17 10 5 7 8 13 1 102003 16 8 4 8 9 13 1 92004 14 8 4 8 8 12 * 82005 14 8 2 8 6 12 * 8High 2001 30 30 3 1 1 42 6 222002 30 27 3 4 4 35 4 212003 29 25 3 4 4 34 4 192004 28 26 2 4 4 34 4 182005 30 26 2 4 2 32 4 16* denotes less than 0.5% uptakeRESEARCH MATTERS : ISSUE 3 / JANUARY <strong>2007</strong> | 21
increasing prominence of psychologists in television drama.(http://news.bbc.co.uk/1/hi/education/1635122.stm)Finally, we consider the uptake of science and mathematics subjects.The longer term trends in Mathematics were considered in Issue 2 of<strong>Research</strong> <strong>Matters</strong> (Bell, 2006). There have been declines in uptake forfemales taking Biology and Chemistry. These are particularly associatedwith medium levels of prior attainment. For Physics the decline alsooccurs for high attaining candidates. It is important to note thatthroughout the period under consideration entries in the three traditionalsciences and Mathematics have been dominated by candidates with highlevels of GCSE attainment. This raises the question as to whether it isdesirable for advanced studies in these subjects to be increasingly thepreserve of an academic elite. There are clearly issues with the perceiveddifficulty of these subjects.It is not enough to consider uptake of individual subjects.Combinations of subjects are also important as indicated by theUniversity of <strong>Cambridge</strong>’s concerns mentioned in the first paragraph ofthis article. Analysing combinations of subjects is not as straightforwardas it seems because there were 23,963 combinations of individualsubjects in 2001 (Bell, Malacova and Shannon, 2003, 2005). Therefore,it is necessary to group subjects to analyse combinations.The first group to be considered is based on the <strong>Cambridge</strong> list ofsubjects that are less effective preparation for <strong>Cambridge</strong> courses (LEPs)(http://www.cam.ac.uk/admissions/undergraduate/requirements/).The subjects that they list are: Accounting, Art and Design, BusinessStudies, Communication Studies, Dance, Design and Technology,Drama/Theatre Studies, Film Studies, Health and Social Care, HomeEconomics, Information and Communication Technology, Leisure Studies,Media Studies, Music Technology, Performance Studies, Performing Arts,Photography, Physical Education, Sports Studies, and Travel and Tourism.It is not the study of individual LEPs that is the perceived problem butrather the studying of too many of them. We decided to investigate thenumber of these LEPs taken by candidates with three or more A-levelresults. In Figure 1, 100% stacked area charts are presented for thenumber of less effective preparation A-levels (LEPs). The data is presentedby gender and by prior attainment. The prior attainment is based onmean GCSE with the cut scores that divided the 2001 A-level candidatesinto three approximately equal groups. The darkest area at the bottomrepresents the candidates not taking any LEPs. The lighter grey arearepresents those taking one LEP and the next two areas 2 and 3+ LEPs(3+ is the top area). The data for all the tables in this report can be foundin Vidal Rodeiro (2006) on the <strong>Cambridge</strong> <strong>Assessment</strong> website.http://www.cambridgeassessment.org.uk/research/statisticalreports/It is clear that the majority of students still take at least two‘acceptable’ subjects. Male students are less likely to take LEPs thanfemale students. There is an interesting effect relating to Curriculum2000. In the first year, there was a decrease in LEP subjects by low priorattainment candidates and the reverse pattern for high prior attainmentcandidates. It is likely that pattern was based on centres gainingexperience of the new specification (in particular the A2 modules) andthe attitudes of universities to certain subjects.It should be recognised that the majority of candidates for <strong>Cambridge</strong>and other elite institutions likely to have similar restrictions onsuitability of A-levels will largely recruit from candidates with high priorGCSE attainment. Only 5% of the candidates in 2001 made a choice ofA-levels that included 2 or more LEPs. This increased to 17% in 2002 andthen fell to about 9% for the remaining three years (note that forcandidates performing at the level of the vast majority of successful<strong>Cambridge</strong> applicants, i.e. those with three grade As, the percentagesaffected are much smaller.)Figure 1 : Uptake of ‘Less Effective Preparation’ A-levelsKEY:0 1 2 3+10090807060504030201002001 2002 2003 2004 200510090807060504030201002001 2002 2003 2004 2005(a) Female (b) Male (c) All10090807060504030201002001 2002 2003 2004 200510090807060504030201002001 2002 2003 2004 2005(d) Low (e) Medium (f) High10090807060504030201010002001 2002 2003 2004 200590807060504030201002001 2002 2003 2004 200522 | RESEARCH MATTERS : ISSUE 3 / JANUARY <strong>2007</strong>
One of the aims of Curriculum 2000 was to broaden students’experiences and to discourage early specialisation. In Figure 2, the uptakeof five subject areas at A-level is presented. The five areas were:Science/Mathematics, English, Languages, Social Science/Humanities andArts. Grouping subjects is not a straightforward task and the allocation ofsubject areas is always debatable (at the time of analysis psychologyspecifications were usually grouped with the social sciences but modifiedspecifications starting in 2008 are going to be classified as sciences).Some subjects do not necessarily fit comfortably in any category. Moredetails of the subject areas can be found in Bell, Shannon and Malacova.(2003, 2005). The categories were originally derived to illustrate howclose the current situation is to a balanced diploma based on existingA-levels. The percentages in the figure relate to the number of A-levelstudents taking at least one of the subjects in the subject area in thepopulation of students taking at least three A-levels.The most obvious feature of Figure 2 is the stability of the uptake formost subject areas. The clearest trend is the decline in the number ofstudents taking Modern Languages where the rate of decline is faster forfemale students. There were no consistent trends for the other domains.There are however large differences between the subject areas. Forfemale students, the subject area with the highest uptake is SocialScience/Humanities (note this is made up of many more A-level subjectsthan the other areas). The remaining subject areas in descending order ofuptake are English, Science/Mathematics, Arts and Modern Languages.The pattern for male students is different. The uptake of theScience/Mathematics subject area is similar to that of the SocialScience/Humanities area. The uptakes of subjects in the English, Arts andthe Modern Languages groups are much lower than for females.Figure 2 also shows that the uptake of subject domains is related toability. Uptake of Arts, English, and Social Science domains all declinewith increasing prior attainment. This is most marked for the Arts domainwhere the percentage uptake is approximately halved. Uptake for theremaining two domains, Modern Languages and Sciences, increases withprior attainment. This relationship is strongest for Modern Languageswith approximately one in twenty students in the lowest priorattainment group taking at least one modern language compared withone in five for the high prior attainment group.John Dunford, general secretary of the Association of School andCollege Leaders stated that Modern Languages were in freefall (Guardian,24 August, 2006). Whilst the decline has been substantial, there are twofeatures of it that are interesting. First, it is much smaller for malescompared with females and, secondly, for low attaining candidates thedecline is also smaller. There is a need for further research in these areas.For the final analyses in this article, subjects were grouped into threedifferent domains; Science and Mathematics, Arts and Languages, SocialScience and Humanities (the subject domains involved merging thesubject areas of Art, English and Languages into one domain. Thiscategorisation was used in Bell et al. (2005) to investigate whetherA-level subject choice was balanced). Using these three domains, itpossible to classify candidates taking three or more A-levels into sevengroups:YNN Science/Mathematics only.NYN Arts /Languages onlyNNY Social Sciences/Humanities onlyYYN Science/Mathematics and Arts/LanguagesYNY Science/Mathematics and Social Sciences/HumanitiesNYY Arts / Languages and Social Sciences / HumanitiesYYY All three domainsFigure 2 : Uptake of A-level subject groupsKEY:Science/Maths English Languages Social Science/HumanitiesArts80808070707060606050505040404030303020202010101002001 2002 2003 2004 200502001 2002 2003 2004 200502001 2002 2003 2004 2005(a) Male (b) Female (c) All8070605040302010807060504030201080706050403020100002001 2002 2003 2004 2005 2001 2002 2003 2004 2005 2001 2002 2003 2004 2005(d) Low (e) Medium (f) HighRESEARCH MATTERS : ISSUE 3 / JANUARY <strong>2007</strong> | 23
Figure 3 presents the percentage uptake of these categories by sexand attainment for 2001 to 2005 for those candidates taking at leastthree A-levels. In the figures solid lines have been used to denotecombinations including science and mathematics and dotted lines forthose that do not. Looking at all the panels of Figure 3 it can be seen thatfor most combinations of domains the changes have been small. The onlylarge changes tend to be associated with science specialists. The increasestend to be smaller and shared between combinations involving science.For the combinations of domains not including Science/Mathematics,there are only small, inconsistent year on year changes. This means thatthe net effect of broadening the curriculum has been to reduce theamount of science that science specialists study but this has not beenmatched by an increased uptake by non-scientists.When all the data presented here are considered in their entirety, thereare some noticeable results. First, for most subjects and groups ofsubjects there has been very little change. For some subjects and groupsof subjects there have been changes associated with Curriculum 2000but the uptakes have subsequently stabilised. Of greater concern are thesubjects that have declined through the whole period, for example,Geography, Physics and Modern Languages as a group.Although there has been a decline in numbers taking generalqualifications (GCSE and GCE) that assess modern languages, there is animportant development that seems to provide a promising solution. Thissummer's GCSE results showed a big decline in the number of pupilsstudying modern foreign languages. French and German suffered thebiggest falls in candidates of any subject, with declines of 13.2% and14.2%. There are, however, alternatives to existing qualifications thatmay be of use in increasing the number of linguists. <strong>Cambridge</strong><strong>Assessment</strong> has developed a new qualification scheme called AssetLanguages. This is part of the DFES National Languages Strategy(http://www.assetlanguages.org.uk/). They use a ‘ladder’ of courses similarto music grades and aim to make language learning accessible. More thana quarter of state secondary schools are going to use these qualificationsfrom September 2006. There are also 120 primary schools involved in thescheme. Experience from the first full year of the scheme suggests that itis successful in motivating students’ language learning.For Science and Mathematics, there is a need to consider how thesesubjects are extended beyond a very able elite. When considering trendsin uptake, a common mistake is to use what was described in the TVseries Yes Minister as the politician's syllogism: ‘Something must be done.This is something. Therefore, this must be done’. Before acting it is betterto gain an understanding of the underlying causes for the trend. Thisarticle is only the first step in understanding uptake in A-levels. Beforeacting it is necessary to understand the processes that have led to thesituation described in this article. This requires the collection ofadditional information. For this reason, <strong>Cambridge</strong> <strong>Assessment</strong> iscurrently conducting a large scale survey (with the Association ofColleges) investigating why students choose particular A-levels.AcknowledgementsThe authors would like to thank the <strong>Cambridge</strong> <strong>Assessment</strong> Librarian, FionaBeedle, for her assistance in tracking down the older references in this article.ReferencesBell, J.F. (2006). The curious case of the disappearing mathematicians. <strong>Research</strong><strong>Matters</strong>: A <strong>Cambridge</strong> <strong>Assessment</strong> Publication, 2, 21–23.Bell, J.F., Malacova, E. & Shannon, M. (2003). The Changing Pattern of A-level/ASuptake in England. A paper presented at the British Educational <strong>Research</strong>Figure 3 : Uptake of combinations of subject domainsKEY:YNNNYNNNY YYN YNY NYY YYY353025201510502001 2002 2003 2004 2005353025201510502001 2002 2003 2004 2005353025201510502001 2002 2003 2004 2005(a) Male (b) Female (c) All353025201510502001 2002 2003 2004 2005353025201510502001 2002 2003 2004 2005353025201510502001 2002 2003 2004 2005(d) Low (e) Medium (f) High24 | RESEARCH MATTERS : ISSUE 3 / JANUARY <strong>2007</strong>
Association Annual Conference, Edinburgh, September 2003.http://www.cambridgeassessment.org.uk/research/confproceedingsetc/BERA2003JBEMMS/file/Bell, J.F., Malacova, E. & Shannon, M. (2005). The changing pattern of A level/ASuptake in England. The Curriculum Journal, 16, 3, 391–400.Clarke, P. (2005). Curriculum 2000 and other qualifications. A survey of UK medicalschools’ requirements and selection policies. Cardiff University.http://www.ucas.ac.uk/candq/curr2000/medical.pdfCentre for Education and Industry (2003). Widening participation in the physicalsciences: An investigation into factor influencing the uptake of physics andchemistry. University of Warwick, Coventry: Centre for Education and Industry.Robson, W. W. (1965). English as a university subject. London: <strong>Cambridge</strong>University Press.Smithers, A. & Robinson, P. (2006). Physics in schools and universities: II. Patternsand policies. Buckingham: Centre for Education and Employment <strong>Research</strong>.http://www.buckingham.ac.uk/education/research/ceer/pdfs/physicsprint-2.pdfTillyard, E.M.W. (1958). The muse unchained: An intimate account of therevolution in English Studies at <strong>Cambridge</strong>. London: Bowes and Bowes.Vidal Rodeiro, C.L. (2006). Uptake of GCE A-level subjects in England 2001–2005.Statistical Report Series No. 3.http://www.cambridgeassessment.org.uk/research/statisticalreports/PSYCHOMETRICS CENTREDiscussion piece: The psychometric principles ofassessmentProfessor John Rust Psychometrics CentrePsychometrics is the science of psychological assessment, and is afoundation of assessment and measurement. Within psychometrics thereare four fundamental principles whereby the quality of an assessment isjudged. These are (1) reliability, (2) validity, (3) standardisation and (4)freedom from bias. Reliability is the extent to which an assessment is freefrom error; validity is the extent to which a test or examination assesseswhat it purports to assess; standardisation gives us information on howthe result of an assessment is to be judged, and freedom from biasexamines the extent and causes of differences between groups. Thesefour principles inform not only test use but also the entire process oftest development, from the original curriculum or job specification,via the choice and appraisal of examination questions and test items,through to the eventual evaluation of the success or otherwise of theassessment itself.No assessment can be perfectly reliable, and this applies not only tothe measurements we make in education or psychology, but to all typesof measurement. Measurements range in accuracy from the exceptionallyhigh levels now obtained for the speed of light and the time of day,through measurements of length and area used in surveying, to the lowerlevels attainable for measurement of blood pressure and haematologicalassays used in medicine, to the tests of ability, achievement andcharacter with which we are familiar in the education and recruitmenttesting world. Hence, in all these cases our expectations are different.Reliability is assessed on a scale of zero to one, with a score of0.00 indicating no reliability at all, and a score of 1.00 representingperfect reliability. Over a century of human testing has shown us that wecan expect reliabilities ranging from 0.95 for a very carefully constructedand individually assessed test of ability, through 0.85 for group tests ofability; about 0.75 for personality tests; 0.5 for rating scales and down toabout 0.2 or 0.3 for projective tests or tests of creativity.There are several ways in which reliability can be assessed and most ofthem involve making multiple measurements. Inter-rater reliability is theextent to which examiners agree or disagree about the mark that acandidate should be given when the assessments are madeindependently. This is the most relevant form of reliability for many formsof school examinations, and the assessment of coursework or essays hasan apparent upper limit of about 0.65. It is interesting that in spite offrequent attempts to improve on inter-relater reliability of examiners, forexample by setting detailed marking criteria, it is unusual to find a valuethat goes much above this figure. Constraining the judgement ofindividual examiners can, if taken to extremes, lead to just anothermultiple choice test by another name.Whatever efforts are put into improving the agreement betweenmarkers, it is not the only source of unreliability and may not even bethe most important. In multiple choice examinations, for example, theinter-rater reliability is often as high as 0.99, because the onlydisagreement between raters is in reading the scores from the answersheets. However, unreliability still arises for many other reasons, such asthe state of the candidate (tired, ill, anxious etc.) the environment inwhich the test is taken, events at home or among the peer group, or theconcordance between the content of the examination and the revisionstrategy used by the candidate, to name but a few. These forms ofreliability are called test stability, and one way of obtaining this is byadministering the same test or examination to the same group ofindividuals on two or more occasions and comparing the results. But thiscan only be an estimate, as the prior experience of having sat the sameexamination will tend to affect the second sitting in some way. In spite ofthis it is essential that we have some way of estimating stability effectsfor our assessments. Given all the possible sources of instability, weexpect an upper limit of at most about 0.85 on the expected reliability ofa multiple choice school examination. It is important to note I am nothere trying to do full justice to issues of reliability, I am illustrating theimportance of the application of psychometric principles.Reliability in assessment is just the first step, however. A score can beperfectly reliable and still utterly invalid for a particular application.Astrological charts or diagnoses made on the basis of graphology(handwriting analysis) may be very reliable in that astrologers orgraphologists using the same system will usually be in agreement aboutRESEARCH MATTERS : ISSUE 3 / JANUARY <strong>2007</strong> | 25
the significance of birth signs or of particular aspects of a person’shandwriting. But this certainly does not mean that these techniquesnecessarily predict either personality or the future.This is assessed by thepsychometric principle of validity. In order to assess validity we first needto be clear about the purpose of an assessment.There are various formsthat validity can take, the primary ones being face validity, content validity,criterion-based validity and construct validity. Face validity is the extent towhich an examination or test ‘feels right’ for the person taking it. In apersonality test, for example, are the questions actually relevant to thestated purpose of the test? Or in an examination does the type of questionreflect the social world of the candidates, or is it alien to them? Contentvalidity can be demonstrated by matching the assessment specification tothe curriculum that has been followed. If candidates are set examinationquestions that are outside the syllabus, then this represents a failure incontent validity. Criterion related validity is important when a test orexamination is used to predict future performance on some criterion.Thevalidity of school examinations for university entrance, for example, can beassessed by following successful candidates throughout their university life.Construct validity attempts to analyse what it is that a test or examinationis actually measuring. It requires many years of research in whichunderlying issues fundamental to a concept are addressed in manydifferent ways and from many angles. Differences of approach concerningthe curriculum, pedagogical method and assessment of key aspects ofschooling such as learning the ’times tables’ or the phonetic approach toreading illustrate the struggle to define the constructs of ability andachievement in mathematics and reading in a meaningful way.The third psychometric principle we need to address is standardisation.There are, in essence, two forms of standardisation: norm-referencing andcriterion referencing. In practice there is often a complex mix of the twoin public systems, as Newton and Baird remind us. A norm-referenced testor examination compares the score of an individual with those of othercandidates who took the test under similar circumstances. This group ofcandidates is called the norm group. The ultimate norm group would bethe whole population of potential test takers. The standardisation of theWIAT (Wechsler Individual Achievement Test), for example, was carriedout by obtaining a stratified random sample of 800 children throughoutthe UK. The proportion of children chosen mirrored those in the 2001Census in terms of gender, ethnic group, locality and parent’s educationallevel. The use of this type of referencing is important when educationalpsychologists need to match the achievement of an individual childagainst reasonable expectations based on how children of a similar ageachieve in the population at large. Criterion referencing refers to amatching of a test score or an examination result to some objectivelyassessed reference point that details how a person with this score mightbe expected to perform in future training or in the workplace. Some haveattempted to set these forms of standardisation against each other, butsuch arguments are usually vacuous as both are important in most realworld settings, each in their own way.The final psychometric principle is freedom from bias. Bias occurswhen scores on a test vary depending on group membership. A test,examination or assessment procedure is said to be biased when its useresults in adverse impact on one or more groups when compared withothers. Groups can be defined in many ways, but becomes particularlysignificant in areas where anti-discrimination legislation is in force, suchas gender, ethnicity, social circumstance, disability, sexual orientation andnow, age. There are three principle types of bias: item bias, intrinsic testbias and extrinsic test bias. Item bias occurs when some items within atest show group differences that are disproportionate with the test as awhole. It might occur, for example, where a particular item containsEnglish that is far too colloquial when addressed to candidates for whomEnglish is not their first language. Item bias is, in principle, fairly easy toidentify, but much more could be done to ensure that procedures are inplace to keep it to a minimum. Intrinsic test bias occurs where a test orexamination has differential reliability or validity for different groups, andmuch of the research on intrinsic test bias was associated with attemptsto introduce positive discrimination policies, particularly in the US. Butlatterly there has been an increased recognition that, apart from itemlevel bias, most of the bias found in assessment is extrinsic to the test orexamination itself. More often, differences in test scores between groupscome about as a result of the impact of real differences in society. Bias in,and the consequent adverse impact of, school examination results can toa large extent be accounted for by differences between localities in thequality of schooling, or of parental, peer and teacher expectation andsupport. These are themselves dependent on the impact of social policyon local demographics.How do the psychometric principles relate to the evaluation anddevelopment of school examinations such as the A-level? Very much.First, we need to dispel a common myth that A-level results arejudgements, not measurements, and hence escape the need to be judgedby psychometrics. Judgements, as much as measurements, need to bereliable, valid, well standardised and free from bias. Hence the principlesare unavoidable. Furthermore, the distinction is in many ways artificial.Psychometrics today is defined as the science of psychologicalassessment, not simply measurement, and this is important, particularlywhen an organisation has to decide on how an assessment is to be made.In recruitment, for example, it is not simply a question of whether to usepsychometric tests, interviews, or other alternatives such as work sampleexercises. Rather, it is a question of comparing the reliability, validity,standardisation procedure and extent of bias that lie in each, anddeciding on the overall package. To do this common criteria are neededand these the psychometric principles supply.Politics and misunderstandings abound in the school examinationsdomain, and application of the psychometric principles enables us todivide the fact from the rhetoric in the frequent debates that are now partof our lot. Given what we know about reliability, how has it come aboutthat we experience demands that examination results must be completelyreliable, something we know to be impossible? The misunderstandingarises because all tests and examinations inhabit a world of conflictingmeanings and interpretations, and therefore need to be assessed in termsof their consequences as well as their psychometric characteristics. Ineducation these include progression, educational treatment, admissions,setting and streaming. Outside education, tests not only assess, they alsolicense, and once test results are used to license they cross a thresholdthat interfaces with the wider legal and social system of society at large.Hence the award, for example, of a driving licence, or of membership ofthe Royal College of Surgeons, or of a place at University, give legalentitlements that, while based on assessment, achieve a new status thatare inevitably going to be the subject of controversy.To validate a public examination, as with any other test, we need firstof all to define its purpose. This is a basic requirement as otherwise wecould not know whether its purpose was being met. It is a multifacetedissue as each examination serves a number of different purposes, hence aseries of validations are required. Problems can arise if some of thesepurposes are in conflict. For example, we may find that increasing validity26 | RESEARCH MATTERS : ISSUE 3 / JANUARY <strong>2007</strong>
in formative assessment may decrease validity in summative assessment.Furthermore, the simple knowledge that the result is being used for onepurpose (e.g. school league tables) may decrease its validity for another.But, this said, there is no reason why an assessment should not serve anumber of different purposes, so long as we are clear what these are, andwhere our priorities lie.Standardisation is about standards, and there is an ongoing debateover whether standards, for example in A-levels, are going up or down.To get a grip on this we need to consider what is meant by ‘standards’.For example, teaching standards are not the same as the standard ofachievement. It is perfectly possible for standards of teaching to go up atthe same time as standards of achievement go down, and vice versa.Also, standards are not necessarily applicable across the board. A form ofteaching that raises standards for one group (for example, children withspecial educational needs) may lower them for another.The desire to design assessments, examinations and tests that are freefrom bias is as much a concern for school examining bodies as it is forrecruitment professionals. Unfortunately, given the existence of extrinsictest bias, assessment that is completely free from bias is in many casesan impossibility. But we can all endeavour to keep bias to a minimum,and to do so is an important part of any equal opportunities policy,whether that of an organisation or enshrined in law within equalopportunities legislation. What is important is that its extent should bemonitored and discussed, and that programmes to evaluate and reduceits extent should be incorporated in policy. This can be difficult wherecompanies and organisations are in denial, and it will be an uphill task toensure that the issue receives the attention it deserves. As far as A-levelsare concerned, two forms of bias are apparent. First, the differences inattainment between ethnic groups, and secondly, the superiorperformance of girls compared with boys, in some subjects. As far asethnic groups are concerned, the differences in quality of schoolingbetween inner cities and the suburbs is sufficiently manifest not to needmuch discussion, although the causes of these differences are of course adifferent matter. One thing we can be sure of, however, is that attemptsto deflect the issue on to universities are unlikely to lead to the changeswe need. The black and Bangladeshi communities in particular deserve tohave their concerns in this respect recognised and addressed.With gender differences in achievement, it is interesting to note thatseveral decades ago boys outperformed girls at A-level, a situation that isnow reversed. Is this because girls are now cleverer than boys? Notnecessarily. Two other elements will almost certainly have come intoplay. First is the higher standard deviation for boys compared with girlson most ability and achievement tests. This generally means that boysare over-represented at the extremes of the distribution. A shift in thecut-off closer to the population average, as effectively happens when theparticipation rate shifts from 10% to 50%, could very easily show thatthe previous superior performance of boys was an artefact. A secondchange in the way A-level is examined will also have contributed, thisbeing the increased dependence of the final mark on coursework. Thereare complex interactions between gender and various aspects of thecoursework process.The psychometric principles are not new, and necessarily underliemuch of the activities of examination boards in their efforts to improvethe culture of learning, examinations and the monitoring of performance.They are also inescapable, although sometimes attempts are made todress them up in other clothes. Perhaps this is inevitable given theincreasing politicisation of our school system. Is it too much to hope thatone day the curriculum and its assessment will be disestablished? Thefreedom given to the Bank of England to set interest rates independent ofTreasury interference has set a useful precedent here. Only time will tell.VOCATIONAL ASSESSMENTIs passing just enough? Some issues to consider ingrading competence-based assessmentsMartin Johnson <strong>Research</strong> DivisionIntroductionCompetence-based assessment involves judgements about whethercandidates are competent or not. For a variety of historical reasons,competency-based assessment has had an ambivalent relationship withgrading (i.e. identifying different levels of competence), although it isaccepted by some that ‘grading is a reality’ (Thomson, Saunders andFoyster, 2001, p.4).The question of grading in competence-basedqualifications is particularly important in the light of recent national andinternational moves towards developing unified frameworks for linkingqualifications.This article is based on Johnson (2006, in submission) whichuses validity as a basis for discussing some of the issues that surround thegrading of competence-based assessments.The article is structuredaround 10 points taken from the summary of that extended paper.1. Defining competencyThis can be problematic and might be conceptualised in terms ofatomistic/holistic or tacit/instrumental factors. Competency-basedassessment systems have developed in the context of these varyingconceptualisations.The assessment systems used to represent and measure competentperformance are inextricably tied to the ways that ‘competence’ has beendefined. Debates about the nature of competence have tended to bepolarised around the question of whether it is a complex or superficialconstruct, with consequent implications for assessment methods. Wood(1991) cites literature highlighting the inherent difficulties of inferringcompetence from test data or observed performance. He suggests thatthis is partly because those constructs that might be regarded by someRESEARCH MATTERS : ISSUE 3 / JANUARY <strong>2007</strong> | 27
as contributing to a notion of competency are often grossly underconceptualised.This potentially leads assessment-based inferences aboutcompetence to be invalidly ‘over-extended’.More sophisticated conceptualisations tend to consider thoseattributes that underpin performance. Gonczi (1994) outlines a broadmodel of competence that prioritises the personally held skills which, incommon, underpin competent performance. Gillis and Bateman (1999)also acknowledge a broader conception of competency, arguing thatcompetency must include the application of skills across contexts(location and time), and the generic transferable skills, sometimesreferred to as ‘key skills’, that enhance the capacity of workers torespond, learn and adapt when environmental factors change.There are also concerns about whether competence can besatisfactorily defined and the role of assessor experience in judgementsabout competent performance. Some argue that attempts to overspecifydetailed assessment criteria in order to attain unambiguous,reliable judgements might not have the desired outcome. Wolf (1995)observes that written specifications on their own might well leave spacefor ambiguous interpretation since no criterion, however preciselydefined, is beyond multiple interpretations. Although it appearscounterintuitive to suggest that very detailed assessment criteria mayleave space for personal interpretation, when faced with a mass ofcriteria an assessor may well read through them and glean a sense ofmeaning, perhaps giving their own weight to particular points andtherefore reducing the overall consistency of application.Others argue that attempts to over-specify ‘transparent’ assessmentcriteria will also have limited success because of the particular influenceof tacit knowledge in competent performance. Situated cognitiontheorists suggest that the development of competence involves ‘knowingin practice’ and becomes embodied in the identity of the practitioner(Lave and Wenger, 1991). Modelling the different stages of developingexpertise, Dreyfus and Dreyfus (1986) argue that tacit, intuitiveunderstanding is a critical difference between the performances ofexperts and novices.2. Grading and motivationThere is considerable debate about the potential advantages anddisadvantages of grading on motivation. Literature suggests that thereporting of performance outcomes can influence learner motivation.Social Cognitive theorists, such as Bandura (1986), hold that individualsuse feedback from past experiences (successes and failures) to informtheir expectations about future performance. Perhaps unsurprisingly, thequality of this information can affect perceptions of self-efficacy andinfluence future motivation to act.Grading potentially gives more feedback about performance thanbinary reports. As a consequence, Smith (2000) suggests that grading canfacilitate the motivation for students to strive for excellence since thereporting mechanism affords the opportunity for this level ofperformance to be recognised.There is evidence that the effects of grading are not consistent across alllearners.Williams and Bateman (2003) suggest that whilst more ablelearners might consider grading to be more motivational because itrecognises their strengths, lower ability learners might be adverselyaffected. It is also important to consider the potential relationship betweengrading and labelling.There are concerns that learners might internalise thedescriptive quality attached to grades to the extent that they infer thattheir performance (and ability) is a fixed, unchangeable entity.The nature of learners who take vocational courses might be differentfrom those who opt for general qualifications, and their motivation mightdiffer. Group dynamic issues might also need consideration. Usuallyvocational learning takes place in smaller groups than is the case forgeneral learning. This might contribute to a greater sense of groupcohesion, undermining the motivation of individuals to compete againsttheir peers.3.The effects of grading on (mis)classificationSmith (2000) asserts that grading can improve the validity and consistencyof assessments because it compels assessors to analyse students’performances with greater care than in binary reporting systems.Thismight be because they have to consider the evidence of a performance at afiner grain. On the other hand, this will only be possible if the inherent logicof the subject provides recognisable thresholds (Wolf, 1993).Williams and Bateman (2003) highlight the potential relationshipbetween the number of grading boundaries and the reliability ofassessment outcomes. The opportunity for classification errors increasessimply because the number of differentiated classifications increases.However, the errors might have less severe consequences. Overcomingthis problem could potentially undermine the consistent reporting ofoutcomes since it demands greater levels of accuracy in each assessmentjudgement. Newton (2005) argues that the existence of measurementinaccuracy impacts on the social credibility of assessments because ofpublic expectation that there should be relatively few misclassifications.Finally, Wiliam (2000) emphasises the danger of aggregating marksinto grades or levels since these might mask the true extent of errorvariance in test scores. Since the exactness of test scores can give anillusion of precision, resulting in misleading perceptions about their realaccuracy, grading might be considered more favourable because it suffersless from this degree of definition.4. Stretching assessment criteria beyondbinary outcomesAnother important consideration is the interaction between domainbreadth and the constructs included. Disentangling these interactingfactors allows a clearer discussion regarding the potential consequencesof grading. Domains can often be broad, requiring the integration of anumber of identifiable skills. This raises questions about the nature ofcompetent performance, since the term might be used (and understood)in different senses. Hyland (1994) suggests that competence might beboth a holistic evaluation against a professional standard (e.g. being acompetent plumber) and an atomistic evaluation of the ability to achievea particular task (e.g. a particular driving manoeuvre). In the first contexthe argues that grading is appropriate because the holistic nature of theperformance might include observable degrees of performance. However,in the second context grading might be inappropriate because atomistictasks might not be scalable beyond ‘achieved’ and ‘not yet achieved’.5. Grading and accountabilityThere are concerns that grading procedures afford comparisons to bemade between institutions and that these can be used for accountabilitypurposes. In this way grading can be a potential source of pressure for28 | RESEARCH MATTERS : ISSUE 3 / JANUARY <strong>2007</strong>
assessors and might influence their decision-making. Wikström (2005)explores some of the structural pressures beyond the immediate contextof assessment tasks which can impact on the integrity of gradingdecisions in a criterion-referenced system. She found evidence thatteachers’ and tutors’ grading decisions were affected by selection andaccountability concerns. Her findings suggest that teachers might gradedifferently over time because of:Both internal and external pressures for high grading, due to thegrades’ function as a quality indicator for schools as well as a selectioninstrument for students. (p.126)Similarly, Bonnesrønning (1999) posits a systematic relationship betweenteacher characteristics, such as self-confidence levels, and gradingpractices. For example, he states that:Teachers’ ability to withstand pressure [for high grading] varies withteacher characteristics. (p.103)This could have implications for perceptions about the robustness ofteacher or tutor assessed competency reports.6. Decisions about grading depend on thedomain being assessedDecisions about grading need to consider the context of the domainbeing assessed. Grading decisions should be based on the number ofusefully distinct subject specific criteria which can be formulated, theinherent logic of the subject, and whether there are recognisablethresholds. Messick (1989) argues that consideration of theconsequences of assessment results is central to validity, stating that:Validity is an integrated evaluative judgement of the degree to whichempirical evidence and theoretical rationales support the adequacyand appropriateness of inferences and actions based on test scores orother modes of assessment. (p.13)Considering the interpretation of assessment evidence leads to a focus,amongst other things, on the quality of the information gained from anassessment. Although considering whether it is validly possible toseparate binary into graded outcomes is important, arguably domainstraditionally used for binary judgements grading can offer additionalinformation. This could afford more information on which to baseinferences about individual achievement and contribute to the validity ofthe assessment process. It assumes that inferences about competenceare based on a sound understanding of the grading criteria. Transparencyabout how grades are determined is important. However, the meaning ofdifferent grade thresholds is less transparent than that betweencompetent/not competent if there is a lack of understanding about thedifferences between grades.7. Context and norm-referencedinterpretationsLiterature suggests that context and norm-referenced interpretationsmight undermine the validity of applying grading procedures tocompetency-based assessments. Context might interfere withconsistency in at least two ways. First, context might interfere with anassessor’s ability to position the qualities of two different performanceson a common scale. Factors may exist that intrude on the process ofcasting consistent judgements (e.g. performances in tasks involvinginteractions between individuals might be interpreted differently byjudges who accommodate variations in the social dynamics, such as,dealing with ‘tricky’ as opposed to ‘helpful’ customers). Secondly, contextcan make it more difficult to infer the basis on which assessors’ decisionsare being made. Assessors in different contexts might make judgementsbased on different foundations from each other because theirunderstanding of competence is based on their different experiences.Where binary reporting methods are used there is a clear, transparentlink relating pass/fail distinctions to particular criteria. One of theproblems for competency-based assessment is that qualification usersmight mistakenly assume that graded performance reporting is based onnorm-referenced principles. Williams and Bateman (2003) and Peddie(1997) found that qualifications stakeholders sometimes make thismistake.However, a number of commentators questioned whether criterionreferencedjudgements are entirely devoid of norm-referenced principles.Skidmore (2003) argues that criteria could be based on an underlyingnormative judgement where they rely on subjective interpretation byprofessional judges. Similarly, Wiliam (1998), citing Angoff (1974),suggests that any criterion-referenced assessment is underpinned by aset of norm-referenced assumptions because the assessments are used insocial settings, and assessment results are only relevant with a referenceto a particular population. Consequently, any criterion-referencedassessment is attached to a set of norm-referenced assumptions.8.The use of ‘merit’ gradesUsing grading in competency-based assessments might demotivate anddiscourage some learners. One method of overcoming this problem is tograde outcomes once competence has been established. ‘Merit’ and‘excellence’ grades might be used for this purpose, although Peddie(1997) suggests that these terms need to be distinguished so that theyare used validly. According to Peddie, ‘merit’ and ‘excellence’ havedifferent qualities; ‘excellence’ has an exclusivity, implying that somestudents are excellent in relation to a larger group of students who arenot excellent, whilst ‘merit’ means very good, potentially being attainedby all students. In this context, ‘merit’ grading can help to identifypraiseworthy performances, without necessarily engaging the normreferencedtechniques that some argue undermine competency-basedassessment principles.9. Grading potentially affords the use ofassessment data for selection purposesAn important use of assessment outcomes is to inform selectiondecisions, Wolf (1995) states a commonly held view that:In a selection system, a simple pass/fail boundary provides far too littleinformation on which to base decisions. (p.75)Grading can perform an important role where decisions need to be madeabout selection or access to limited opportunities and/or resources. Fewergrades will result in fewer fine distinctions between performancedescriptions.The social consequences of this might be selectors placing agreater emphasis on other selection criteria, which might be less reliablethan the examination/assessment itself. In addition, it reduces the effect ofmeasurement error. For example, a pass might be a misclassified,incompetent applicant but an excellent result is much less likely to be one.RESEARCH MATTERS : ISSUE 3 / JANUARY <strong>2007</strong> | 29
10. Grading can help to establish thecomparative status of different qualificationsGrade creation based on the distribution of performances within thepopulation can be one way of enabling comparisons betweenassessments to be made. It is also important to acknowledge thatgrading might encourage the use of particular frames of understandingwhich look to make comparisons across domains. The creation of gradedperformance scales might encourage the development of commonassumptions about the similarity of skills and demands that are neededto achieve similar grades across different domains. The extent to whichthis is possible and valid is questionable although the construction ofsuch comparisons is notionally encouraged by the grading framework.A consequence of using grades as a tool for comparing the vocationaland academic domains is the potential for ‘a paradox of parity’ (Griffinand Gillis, 2001). An important function of Vocational Education andTraining (VET) is to encourage less academic students to remain atschool. However, in order to achieve parity of esteem and intellectualdemand with other ‘academic’ subjects, there is a perceived need toattract more academically able students into those vocational subjects.A paradox of parity could occur if this is successful since less ablestudents might be discouraged from enrolling in VET courses whichappear increasingly similar to ‘academic’ courses.ConclusionIn theory, grading can be an appropriate method for dealing with ordinalcompetency assessment data, although there are claims that data fromcompetency-based assessments should be regarded as being nominal. Inpractice, the potential benefits of grading need to be balanced against itspotential disadvantages. This article suggests that questions about thedesirability of grading competency-based assessments are related toissues of validity, with the question hinging on the simultaneousexistence of two mutually supporting factors: ‘use value’ and ‘validity’.It appears that the grading of competence-based assessments can onlybe justified where both factors exist, in other words where it has a clearvalue for qualification users and where its application is valid. Theexistence of either of these factors in isolation undermines the use ofgrading since it weakens the crucial link between the generation ofsound assessment data and its complementary interpretation.ReferencesAngoff, W. H. (1974). Criterion-referencing, norm-referencing and the SAT.College Board Review, 92, 2–5.Bandura, A. (1986). Social foundations of thought and action: A Social Cognitivetheory. Englewood Cliffs, NJ: Prentice-Hall.Bonnesrønning, H. (1999). The variation in teachers’ grading practices: Causesand consequences. Economics of Education Review, 18, 1, 89–105.Dreyfus, H. L. & Dreyfus, S. E. (1986). Mind over machine: The power of humanintuition and expertise in the age of the computer. Oxford: Basil Blackwell.Gillis, S. & Bateman, A. (1999). Assessing in VET: Issues of reliability and validity.Kensington Park, South Australia: NCVER.Gonczi, A. (1994). Competency-based assessment in the professions in Australia.<strong>Assessment</strong> in Education, 1, 1 27–44.Griffin, P. & Gillis, S. (2001). Competence and quality: Can we assess both? Paperpresented at the National Conference on Grading and Competency Based<strong>Assessment</strong> in VET, Melbourne, May, 2001.Hyland, T. (1994). Competence, education and NVQs: Dissenting perspectives.London: Cassell Education.Johnson, M, (2006). Grading in competence-based qualifications: Is it desirable?The Journal of Further and Higher Education. In submission.Lave, J. & Wenger, E. (1991). Situated learning: Legitimate peripheral participation.<strong>Cambridge</strong>: <strong>Cambridge</strong> University Press.Messick, S. (1989).Validity. In R. L. Linn (Ed.), Educational Measurement, 13–103.Washington DC: American Council on Education/Macmillan.Newton, P. E. (2005). The public understanding of measurement inaccuracy.British Journal of Educational <strong>Research</strong>, 31, 4, 419–442.Peddie, R. A. (1997). Some issues in using competency based assessments inselection decisions. Queensland Journal of Educational <strong>Research</strong>, 13, 3, 16–45.http://education.curtin.edu.au/iier/qjer/qjer13/peddie.htmlSkidmore, P. (2003). Beyond measure: Why educational assessment is failing thetest. London: DEMOS.Smith, L. R. (2000). Issues impacting on the quality of assessment in vocationaleducation and training in Queensland. Brisbane: Department of Employment,Training and Industrial Relations.Thomson, P., Saunders, J. & Foyster, J. (2001). Improving the validity ofcompetency-based assessment. Kensington Park, SA: NCVER.Wikström, C. (2005). Grade stability in a criterion-referenced grading system:the Swedish example. <strong>Assessment</strong> in Education, 12, 2, 125–144.Wiliam, D. (2000). Reliability, validity, and all that jazz. Education 3–13, 29,3,9–13.Wiliam, D. (1998). Construct-referenced assessment of authentic tasks:Alternatives to norms and criteria. Paper presented at the 24th AnnualConference of the International Association for Educational <strong>Assessment</strong>,Barbados.Williams, M. & Bateman, A. (2003). Graded assessment in vocational educationand training. Kensington Park, South Australia: NCVER.Wolf, A. (1993). <strong>Assessment</strong> issues and problems in a criterion-based system.London: Further Education Unit, University of London.Wolf, A. (1995). Competence-based assessment. Buckingham: Open UniversityPress.Wood, R. (1991). <strong>Assessment</strong> and testing: A survey of research. <strong>Cambridge</strong>:University of <strong>Cambridge</strong> Local Examinations Syndicate.30 | RESEARCH MATTERS : ISSUE 3 / JANUARY <strong>2007</strong>
PSYCHOMETRICS CENTREThe Psychometrics Centre at <strong>Cambridge</strong> <strong>Assessment</strong>Professor John RustThe Psychometrics Centre is a centre of excellence within <strong>Cambridge</strong><strong>Assessment</strong>, dedicated to the furtherance of scientific rigor in both pureand applied aspects of psychological measurement and educationalassessment. We believe our position within <strong>Cambridge</strong> <strong>Assessment</strong> willhelp us to create links between educational and business assessment,leading to better practice, greater efficiency and social benefits.Before moving to <strong>Cambridge</strong>, and after working at a number ofacademic institutions in London, Professor John Rust set up thePsychometrics Centre at City University, London, in 2003. This was theUK’s first University centre dedicated to the field and John Rust becamethe UK’s only Professor of Psychometrics. At that time, psychometrictesting, while increasingly important in education, industry and thehealth sector throughout the world, was experiencing major newchallenges as an academic and applied discipline.The major challenge continues to be the internet, which hasrevolutionised the area, particularly in the field of recruitment testing.While as recently as 2004 it was possible to collect data for testdevelopment trials and norming studies by paper and pencil, customersin the business world now see such a suggestion as rather recherché.The migration of tests to the internet is accelerating fast, and demandsfrom national professional societies as well as the International TestCommission that full revalidation is required before transferring frompencil and paper to computer, let alone the internet, has fallen on deafears. While only a few years ago it was argued that older candidateswould be disadvantaged once tests were computerised, now it seemsthere is a reverse concern that younger candidates will be disadvantagedif they have to put pen to paper! The internet has also dissolved nationalbarriers, and this is having a huge impact on the test publication andlicensing process. Most published psychometric tests, particularly thoseused for diagnosis and recruitment, have traditionally only been sold toappropriately qualified professionals. But once on the internet, tests canbe accessed from anywhere, and on a worldwide scale. Who is to decidewho is appropriately qualified? The chances of international agreementon this are just as unlikely as those for the worldwide internationalschool curriculum.In the field of educational assessment, many of these issues are nowjust beginning to loom on the horizon. The US is in the lead, followed byEurope, but there is time to plan as changes will lag behind theintroduction of broadband, which is a minimum requirement for seriousinternet delivery. The debate is but beginning, and there will be manywho argue, often for sound reasons, that internet testing of childrenshould not be permitted. But our experience in the recruitment testingworld suggests that it is impossible to hold back the clock. We cannotignore the fact that migration of assessment to the internet introduces acompletely new business model that offers massive economies of scale –something our competitors will be well aware of. But while competitioncannot be ignored, there is more to this than economics. While somecherished practices and values may fall by the wayside, the internet offersmany new opportunities for the improvement of assessment that oncewere beyond our wildest dreams.While valuing its contribution to testing in the business world,particularly in the field of human resources, most of the PsychometricsCentre’s work continues to fall within the educational arena. Over thepast 10 years John Rust and the Centre have been the developercommissioned by Harcourt <strong>Assessment</strong> (formerly The PsychologicalCorporation) to carry out the Anglicisation and UK standardisation ofsome of the world’s most widely used diagnostic tests. These include theWechsler tests, such as the WISC (Wechsler Intelligence Scale forChildren) and the WIAT (Wechsler Individual Achievement Test) bothwidely used by educational psychologists for the diagnosis of specialeducation needs, and the CELF (Clinical Evaluation of LanguageFundamentals), used in a similar way by speech and language therapists.These projects have led us to collaborate with a wide selection ofschools, preschools and nurseries throughout the UK, as well as over100 professional Educational Psychologists and Speech and LanguageTherapists, who have been tasked with going into these schools andadministering over 5,000 tests individually to children within a stratifiedrandom sample based on the Census data. We are currently embarking onsuch a project for the UK standardisation of the Ravens ProgressiveMatrices, a non-verbal test of ability.The Psychometrics Centre has brought to <strong>Cambridge</strong> many of itsactivities previously carried out in London. For those who knew us thereit is still ‘business as usual’. The Centre will continue to act as developerand adaptor of tests; to deliver training, including the BritishPsychological Society’s Level A and B certificates in test use that improvepractical skills and technical understanding for HR professionals; toundertake applied research for the evaluation of assessment programmes,and pure research into key topics relating to web-delivered assessments,test adaptation across cultures and languages and predictive statistics; tooffer specialist test-based consultancy to commercial and not-for-profitorganisations; and to facilitate communication between different areas ofassessment.Unfortunately the MSc in Psychometrics that we ran previously at CityUniversity has had to be discontinued; however we are now working tocreate a much-needed programme of postgraduate study in the disciplinewithin the University of <strong>Cambridge</strong>. The first part of this will be deliveredwithin the MPhil programme of the Faculty of Social and PoliticalSciences this Michaelmas. We have also recruited our first <strong>Cambridge</strong>based PhD student who joined us in October, 2006. The Centre’s move to<strong>Cambridge</strong> in November 2005 offers huge opportunities to develop ourwork through the international links, expertise and research capabilitiesof <strong>Cambridge</strong> <strong>Assessment</strong> and the University of <strong>Cambridge</strong>.RESEARCH MATTERS : ISSUE 3 / JANUARY <strong>2007</strong> | 31
OTHER NEWS<strong>Research</strong> NewsStatistical reportsExaminations generate large volumes of statistical data (approximately800,000 candidates sit general qualifications each year). The objective ofthis series of reports is to provide statistical information about thesystem.It is intended that the reports will focus on different aspects of theexamination system and will be produced at a rate of two or three ayear. In the first few years the issues addressed will vary from year toyear but it is intended that some issues will be revisited, particularly ifthere has been a relevant change in the system.Although this is a new report series, statistics of the examinationsystem have been reported in various journal and conference paperslisted elsewhere on the <strong>Cambridge</strong> <strong>Assessment</strong> website.• Statistics Report Series No. 1: 'Provision of GCE A-level subjects'• Statistics Report Series No. 2: 'Provision of GCSE subjects'• Statistics Report Series No. 3: 'Uptake of GCE A-level subjects inEngland, 2001-2005'http://www.cambridgeassessment.org.uk/research/statisticalreports/Conferences and seminarsNew StatesmanIn July Sylvia Green participated in a roundtable discussion on ‘Smartlearning for the future’ organised by the New Statesman. The session waschaired by Barry Sheerman, Chair of the Education and Skills SelectCommittee and speakers included Andrew Adonis, Minister for Schools.Participants discussed how far technology is a part of smart learning andhow far we have gone towards smart assessment and recognition of theskills that it allows us to develop. The discussion was subsequentlyreported in the July 24th issue of the New Statesman.The Society for Multivariate Analysis in Behavioral SciencesJohn Bell attended the 25th Biennial Conference in Budapest in July andpresented a paper on ‘Modelling the predictive validity of selection tests’.United Kingdom Literacy AssociationIn July Gill Elliott and Nat Johnson were invited to present their work on‘Variations in Aspects of Writing in 16+ examinations between 1980 and2004’ at a special session at the UKLA annual conference. The theme ofthe conference was Teaching Reading and Phonics: Implications of theRose Report.International Test CommissionJohn Rust and Vikas Dhawan attended the ITC 5th InternationalConference on Psychological and Educational Test Adaptation acrossLanguage and Cultures in Brussels in July. John Rust presented a paper on‘A multi-method approach to cross cultural test adaptation: a focus onqualitative methods’.British Educational <strong>Research</strong> Association, University ofWarwickIn September colleagues from the <strong>Research</strong> Division presented 10 papersat the British Educational <strong>Research</strong> Association Annual Conference. Thepapers reflected the wide range of research undertaken by the Divisionand will be discussed in a later issue of <strong>Research</strong> <strong>Matters</strong>.<strong>Cambridge</strong> <strong>Assessment</strong> ConferenceThe second <strong>Cambridge</strong> <strong>Assessment</strong> Network Conference took place atRobinson College, <strong>Cambridge</strong>, on 16th October. The conference addressedthe important issues surrounding how to assess students’ abilities,following Professor Robert Sternberg’s proposal that assessment shouldnot only focus on an individual’s ability to analyse, but also on theircreative and practical skills. The main speakers were Professor RobertSternberg, Dean of the School of Arts and Sciences and Professor ofPsychology at Tufts University, Dr Ruth Deakin-Crick, Senior <strong>Research</strong>Fellow at The Graduate School of Education, University of Bristol, andProfessor Peter McCrorie, Head of the Centre for Medical and HealthcareEducation, St George’s, University of London.Association for Educational <strong>Assessment</strong>-EuropeIn November Sylvia Green and Andrew Watts attended the 7th AnnualAEA-Europe conference in Naples. The theme of the conference was‘<strong>Assessment</strong> and Equity’.32 | RESEARCH MATTERS : ISSUE 3 / JANUARY <strong>2007</strong>
<strong>Cambridge</strong> <strong>Assessment</strong>1 Hills Road<strong>Cambridge</strong>CB1 2EUTel: 01223 553854Fax: 01223 552700Email: <strong>Research</strong>Programmes@cambridgeassessment.org.ukhttp://www.cambridgeassessment.org.uk© UCLES <strong>2007</strong>
Issue 3 <strong>January</strong> <strong>2007</strong><strong>Research</strong> <strong>Matters</strong>
<strong>Cambridge</strong> <strong>Assessment</strong> is the brand name ofthe University of <strong>Cambridge</strong> LocalExaminations Syndicate,a department of theUniversity of <strong>Cambridge</strong>. <strong>Cambridge</strong><strong>Assessment</strong> is a not-for-profit organisation.CitationArticles in this publication should be cited as:Crisp,V. and Johnson,M. (2006). Examiners’annotations: Practice and purpose. <strong>Research</strong><strong>Matters</strong>: A <strong>Cambridge</strong> <strong>Assessment</strong> Publication,2,10-12.