Australian Aid to PNG - AusAID
Australian Aid to PNG - AusAID
Australian Aid to PNG - AusAID

You also want an ePaper? Increase the reach of your titles
YUMPU automatically turns print PDFs into web optimized ePapers that Google loves.
BOXESBox 3.1 The Dutch Disease in Papua New Guinea 22Box 5.1 Education Sec<strong>to</strong>r Achievements of <strong>Australian</strong> Assistance 34Box 5.2 Strengthening the Royal Papua New Guinea Constabulary 36Box 5.3 Strengthening Law and Justice in Papua New Guinea 38Box 5.4 Improving Governance Within the Public Sec<strong>to</strong>r 39Box 5.5 Health Impacts of <strong>Australian</strong> Assistance 43Box 5.6Key Achievements of <strong>Australian</strong> <strong>Aid</strong> for Infrastructure 46Box 5.7 Impacts of <strong>Australian</strong> <strong>Aid</strong> on the Management andProtection of Renewable Resources 47FIGURESFigure 2.1Real GDP Per Capita in Papua New Guinea andOther Developing Countries 3Figure 3.1 The Growth Performance 16Figure 4.1Figure 4.2Composition of <strong>Australian</strong> Assistance <strong>to</strong>Papua New Guinea, 1975 <strong>to</strong> 2002 25Sec<strong>to</strong>ral Composition of <strong>Australian</strong> ProgrammedAssistance <strong>to</strong> Papua New Guinea, 75 <strong>to</strong> 02 31TABLESTable 2.1Selected Socio-economic Indica<strong>to</strong>rs, <strong>PNG</strong> andDeveloping Country Averages, 1975–2000 4The Contribution of <strong>Australian</strong> <strong>Aid</strong> <strong>to</strong> Papua New Guinea’s Development 1975–2000 v
ACKNOWLEDGEMENTSThis report was prepared by Economic Insights Pty Ltd and written by JohnFallon, Craig Sugden and Lynn Pieper.The following people made substantial contributions <strong>to</strong> the review: Peter Ellis(Direc<strong>to</strong>r EVAL), Graham Rady (Task Manager), Amber Davidson, Philip Fradd,Alexander Mcarthur, An<strong>to</strong>n Vikstrom, <strong>PNG</strong> Branch staff members, <strong>AusAID</strong> PeerReview Group members, and the independent (external) anonymous peerreviewers.vi The Contribution of <strong>Australian</strong> <strong>Aid</strong> <strong>to</strong> Papua New Guinea’s Development 1975–2000
FOREWORDAs part of a broader focus on improved learning and accountability, <strong>AusAID</strong>is taking steps <strong>to</strong> improve our ability <strong>to</strong> measure the effectiveness of the aidprogram <strong>to</strong> <strong>PNG</strong>. This report was commissioned from Economic Insights, anindependent consultancy firm, as a background document <strong>to</strong> inform thatexercise. The final report represents the views of the consultants, notnecessarily of <strong>AusAID</strong> or the <strong>Australian</strong> Government. The consultants alsopoint out that the interpretations presented should be seen as tentative andrequiring further assessment.In looking at the report, the key findings appear <strong>to</strong> be that:• <strong>PNG</strong> faces serious development challenges, most notably a weakinstitutional environment with poor control of government spending and aserious law and order problem• However, when an appropriate his<strong>to</strong>rical perspective is taken, Papua NewGuinea has made some development progress since independence. Theseachievements were reflected in improving social indica<strong>to</strong>rs, even in the faceof stagnant per capita incomes• Considering the evidence at the macro level and from an examination ofindividual aid activities, there is evidence that the aid program hascontributed materially <strong>to</strong> development. For example, aid has been central <strong>to</strong>education reform (contributing <strong>to</strong> big gains in literacy and 50% <strong>to</strong> 90%increases in primary and secondary enrolments); prevented health systemcollapse; and maintained some essential road and air infrastructure• Many questions remain <strong>to</strong> be answered, and our capacity <strong>to</strong> complete arigorous assessment of the program needs <strong>to</strong> be improvedIn 2003-04, we will undertake a significant evaluation of <strong>Australian</strong> aid in thegovernance and civil society sec<strong>to</strong>r, and will continue work <strong>to</strong> improve thequality of the data.The report underwent extensive peer review, both internal and external <strong>to</strong><strong>AusAID</strong>. Economic Insights studied the comments and made changes <strong>to</strong> theirreport as they saw fit. The report represents the authors’ views, not a consensus.The report does not aim <strong>to</strong> be a comprehensive evaluation of the effectiveness orefficiency of the aid program. Rather, it is a step forward in our understandingof the program’s impact – its contribution <strong>to</strong> the development of <strong>PNG</strong>.The Contribution of <strong>Australian</strong> <strong>Aid</strong> <strong>to</strong> Papua New Guinea’s Development 1975–2000 vii
Importantly, the report deals with past performance, not future prospects.<strong>AusAID</strong> and the <strong>Australian</strong> Government have significant concerns about thecurrent situation. The report is a useful reminder that <strong>PNG</strong> has achieved someimprovement <strong>to</strong> date. However, this is not a basis for complacency.Murray Proc<strong>to</strong>rAssistant Direc<strong>to</strong>r GeneralOffice of Review and Evaluation<strong>AusAID</strong>viii The Contribution of <strong>Australian</strong> <strong>Aid</strong> <strong>to</strong> Papua New Guinea’s Development 1975–2000
programs <strong>to</strong> improve living standards, in terms of basic social indica<strong>to</strong>rs, butthey have been unable <strong>to</strong> convert this in<strong>to</strong> income growth on a per capita basis.In considering the impact of aid since independence, it is relevant <strong>to</strong> recognisethat there was a clear rationale for budget support in the immediate postindependenceperiod but, in time, it was recognised that budget support had anadverse impact on incentives <strong>to</strong> develop and implement effective economicdevelopment policies. The decision <strong>to</strong> phase out budget support was also made inan environment of high expectations for Papua New Guinea’s revenue prospects(particularly from the mining sec<strong>to</strong>r), relative economic and social stability, and adesire <strong>to</strong> help accelerate Papua New Guinea’s progress <strong>to</strong>ward self-reliance.However as successive governments in Papua New Guinea struggled <strong>to</strong> dealwith growing economic and social problems in the 1990s, it became clear thatgovernance and institutional capacity constraints posed the main challenges <strong>to</strong>achieving self-reliance. In this environment, traditional project aid wasoverburdening weak systems within Papua New Guinea and contributing littlein terms of local ownership and capacity building for management and servicedelivery. The second half of the 1990s saw a shift <strong>to</strong>wards programmedassistance in many sec<strong>to</strong>rs, and increasing emphasis within Australia’s aidprogram on governance issues.A key conclusion that can be drawn is that <strong>Australian</strong> aid has genuinely beenresponsive <strong>to</strong> Papua New Guinea’s own development needs and priorities. It hasbeen appropriately targeted <strong>to</strong> prevailing circumstances in Papua New Guinea,while also generally ensuring appropriate focus on longer-term objectives forself-reliance and sustainable development.Australia has provided more than A$14 billion in real terms as officialdevelopment assistance <strong>to</strong> Papua New Guinea, and remains its largest and mostsignificant donor. Given the volume and breadth of Australia’s support insec<strong>to</strong>rs such as health, education, land transport and governance, it isreasonable <strong>to</strong> conclude that <strong>Australian</strong> aid has been instrumental in helpingPapua New Guinea <strong>to</strong> achieve what development progress it has.At a sec<strong>to</strong>ral level there are important examples of the positive impacts of<strong>Australian</strong> aid. In the education sec<strong>to</strong>r, <strong>Australian</strong> aid (A$540 million sinceindependence) has been instrumental in introducing and expanding theelementary education system, improving access <strong>to</strong> and quality of primary andsecondary education, and financing implementation of the education reformagenda. As a result of these and numerous other contributions by <strong>Australian</strong>aid, the number of children attending school has almost doubled over the pastten years, student retention rates have increased, and there are more schoolsand qualified teachers in Papua New Guinea.The Contribution of <strong>Australian</strong> <strong>Aid</strong> <strong>to</strong> Papua New Guinea’s Development 1975–2000 xi
In the health sec<strong>to</strong>r <strong>Australian</strong> assistance (over A$250 million sinceindependence) accounts for over 70% of the donor funding received by PapuaNew Guinea. And its sustained focus on primary health and disease controlsuggests <strong>Australian</strong> aid can claim significant credit for improvements in healthstatus that have occurred.As the severity of Papua New Guinea’s budget constraints worsened and itscapacity for service delivery declined, particularly since the mid-1990s, it hasbeen necessary for <strong>Australian</strong> aid <strong>to</strong> focus on preventing further declines inbasic service delivery and living standards. Much of the positive impact ofAustralia’s aid in recent years has therefore been in maintaining infrastructure,equipment and basic services that, in the interests of sustainable development,should eventually be provided by the national government. In theinfrastructure sec<strong>to</strong>r, for example, Australia’s support for road maintenancecovers more than 25% of the national road network, and represents about triplethe amount Papua New Guinea itself has spent. Likewise, a recent health sec<strong>to</strong>rreview has concluded that the main impacts of <strong>Australian</strong> aid in recent yearshave been related <strong>to</strong> preventing a decline in sec<strong>to</strong>r performance that more thanlikely would otherwise have occurred. In essence, Australia has been helping <strong>to</strong>keep a collapsing health system functional.Australia’s assistance for the renewable resources sec<strong>to</strong>r in Papua New Guinea(A$200 million since independence) has covered a very wide range of subsec<strong>to</strong>rs,and has been limited <strong>to</strong> specific priority concerns, making it difficult <strong>to</strong>isolate the impact of Australia’s contribution <strong>to</strong> improved developmentperformance at a higher level. Further, as with activities in other sec<strong>to</strong>rs,broader impacts have not been well documented in individual activity reports.Overall, it appears that <strong>Australian</strong> aid has been carefully targeted <strong>to</strong> addresssome issues of critical importance, and one can infer from the success ofspecific activities that there have been some important positive developmentimpacts. For example, <strong>Australian</strong> aid was instrumental in developing andintroducing cost-effective strategies and technologies <strong>to</strong> deal with the seriousproblem of coffee rust. While objective data on the impact of this are notavailable, these initiatives increased the quantity of coffee produced byplantations and smallholders, presumably increasing the revenue from thisimportant crop.With governance issues constituting probably the most difficult of Papua NewGuinea’s development challenges, Australia’s role in helping <strong>to</strong> strengtheninstitutions, build capacity, support economic reform, promote transparency,accountability and the rule of law, and encourage greater communityparticipation in development and scrutiny of government performance hasintensified since the late 1990s. Of the <strong>to</strong>tal A$540 million provided <strong>to</strong> thisxii The Contribution of <strong>Australian</strong> <strong>Aid</strong> <strong>to</strong> Papua New Guinea’s Development 1975–2000
sec<strong>to</strong>r since independence, 65% has been in the past five years. Prior <strong>to</strong> this,Australia’s role was mainly limited <strong>to</strong> supporting the law and justice sub-sec<strong>to</strong>r,particularly the police force. The recency of most activities, combined with thelong-term nature of capacity building and cultural change associated withimproving governance, means it is not yet possible <strong>to</strong> identify broader impactsof <strong>Australian</strong> aid, nor <strong>to</strong> assess the likely sustainability of the governancereforms being introduced. However, a range of shorter term benefits have beenidentified in this report which, if sustained, are likely <strong>to</strong> contribute <strong>to</strong>improving governance in Papua New Guinea.Based on the report’s assessment of past aid strategies and activities, and thevery limited data available <strong>to</strong> assess broader development impacts, it seemslikely that a number of the recent fundamental changes in Australia’s aidprogram in Papua New Guinea, including in modes of delivery and <strong>AusAID</strong>management structures, are likely <strong>to</strong> yield more tangible impacts in Papua NewGuinea and more rigorous impact assessment within <strong>AusAID</strong>. The IncentiveFund, in particular, is a new mode of aid delivery that offers significantpotential for using incentives <strong>to</strong> motivate behaviour change in Papua NewGuinea, by supporting organisations that demonstrate excellence. Likewise,Australia’s active commitment <strong>to</strong> Papua New Guinea’s Health Sec<strong>to</strong>rImprovement Program and the associated move <strong>to</strong>wards a sec<strong>to</strong>r-wideapproach <strong>to</strong> aid delivery have been critical fac<strong>to</strong>rs in allowing the rapid andsustained growth in health expenditure over the past three years, and havebeen substantially responsible for the recent increase in donor support <strong>to</strong> thesec<strong>to</strong>r. Such approaches in other sec<strong>to</strong>rs could well yield similar benefits.Within <strong>AusAID</strong>, the move <strong>to</strong> in-country program management and theestablishment in Canberra of a specific Design, Impact and Review Sectionshould also improve impact and its measurement.<strong>AusAID</strong>’s capacity <strong>to</strong> undertake rigorous impact assessment is an area thatneeds significant improvement. Since the mid-1990s, Australia’s aid programhas progressively introduced benchmarks and indica<strong>to</strong>rs that would allow theperformance of aid activities <strong>to</strong> be assessed in terms of their broaderdevelopment impact, rather than simply against specific activity outputs.Unfortunately, while appropriate systems and procedures are already in placewithin <strong>AusAID</strong>, these have not been followed. Logical framework matrices areusually well constructed, with appropriate links between performance indica<strong>to</strong>rsand activity inputs, outputs, objectives and broader potential impacts. Inpractice however, suitable baseline data have rarely been collected at the outse<strong>to</strong>f an activity, making ongoing moni<strong>to</strong>ring of impacts and assessment of(particularly quantifiable) progress at this level difficult, if not impossible.Possibly because of this, <strong>AusAID</strong> personnel have not queried the failure <strong>to</strong>The Contribution of <strong>Australian</strong> <strong>Aid</strong> <strong>to</strong> Papua New Guinea’s Development 1975–2000 xiii
address impact issues in regular activity reporting by contrac<strong>to</strong>rs. As a result,most activity reporting, even completion reports, is confined <strong>to</strong> describingachievements in terms of outputs. There have also been few evaluations ofPapua New Guinea aid program activities. Even taking in<strong>to</strong> account thedifficulty of obtaining reliable data in Papua New Guinea, there is considerablescope <strong>to</strong> improve the quality of impact information available <strong>to</strong> <strong>AusAID</strong>,building on systems and processes that already exist. Recent analytical work <strong>to</strong>develop more useful performance moni<strong>to</strong>ring and evaluation frameworks forapplication at the activity and sec<strong>to</strong>r level within the health sec<strong>to</strong>r program isan important first step.In looking forward <strong>to</strong> ways <strong>to</strong> improve the contribution of <strong>Australian</strong> aid, thisrapid assessment has highlighted the importance of a focus on sustainabilityand the measurement of impacts. The aid program has evolved <strong>to</strong> improve theprospects of sustainability, most noticeably via the shift from budget <strong>to</strong>program support. But efforts need <strong>to</strong> continue <strong>to</strong> increase the degree of PapuaNew Guinean ownership and participation and the alignment with nationalpolicies and programs. And much could be done <strong>to</strong> document the impact of<strong>Australian</strong> aid so as <strong>to</strong> help improve its effectiveness and efficiency.xiv The Contribution of <strong>Australian</strong> <strong>Aid</strong> <strong>to</strong> Papua New Guinea’s Development 1975–2000
1 INTRODUCTIONThis report provides a rapid assessment of the contribution of the <strong>Australian</strong>aid program <strong>to</strong> development in Papua New Guinea. The report emphasises theneed <strong>to</strong> undertake this assessment in the correct context – a very difficultenvironment that has shown some improvement but retains many deep-rootedproblems. The emphasis is on interpreting the changes observed sinceindependence rather than the level of development, and looks for evidence ofthe contribution that could reasonably have been expected from the <strong>Australian</strong>aid program given the environment.The aim is <strong>to</strong> quickly help inform <strong>AusAID</strong>’s internal examination of itscontribution since 1975 so that a subsequent, detailed assessment is welltargeted. This rapid assessment is not intended <strong>to</strong> cover all aspects of PapuaNew Guinea’s development or the contribution of aid. The interpretationspresented should be seen as provisional and requiring further assessment.The next section summarises the existing literature on economic developmentssince 1975. This is predominately a negative view of lost opportunity. Thesubsequent section interprets the available aggregate data <strong>to</strong> inform theassessment of overall development performance. The <strong>Australian</strong> assistanceprogram is then described with an emphasis on the strategic thinking underlyingthe program. The subsequent section provides a preliminary interpretation of thepotential impact of the <strong>Australian</strong> assistance program, both the positives andnegatives. The final section provides some initial thoughts on whereimprovements could be made based on the findings of this work.The Contribution of <strong>Australian</strong> <strong>Aid</strong> <strong>to</strong> Papua New Guinea’s Development 1975–2000 1
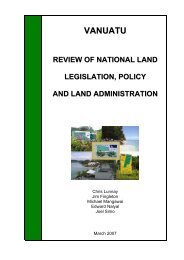
2 SOCIO-ECONOMIC DEVELOPMENT SINCE 19752.1 OverviewTo help provide context it is relevant <strong>to</strong> recognise that Papua New Guinea is alatecomer <strong>to</strong> the modern world and that significant socio-economicdevelopment progress had been achieved by the time of independencecompared with the situation of only a few years earlier. For example no metaltechnology or writing was known in the highlands before 1930 and the infantmortality rate in 1945 was one in four live births. Economic developmentaccelerated in the period leading up <strong>to</strong> independence with real GDP per capitagrowing by an annual average of 4% from 1961 <strong>to</strong> 1975, with expansion ofcoffee production and the establishment of mining on Bougainville being keyfac<strong>to</strong>rs. However at the time of independence much of the economy wasunderdeveloped and highly dualistic, with a formal sec<strong>to</strong>r based on mining,plantations and government and an informal sec<strong>to</strong>r based on a mixture ofsubsistence agriculture and small-scale cash crops. There was wide acceptancethat the building of institutions and human resource capacity left Papua NewGuinea ill prepared for independence and the task of making good progresswith socio-economic development.As political preparations were made for independence, the Somare governmentformulated an eight-point improvement plan known as Papua New Guinea’sEight Aims. The Eight Aims had a distributional focus, based on the assumptionthat economic growth would not be an issue. This assumption was compatiblewith the cultural dominance of distribution rather than production as thecentral socio-economic feature of society. The distributional focus has persistedand been reflected in a range of governance problems and low economicgrowth since independence. Real per capita income was estimated <strong>to</strong> be abovethat for low middle-income countries in 1975, but is now below the average forthe same group (see Figure 2.1).However it is not well recognised that basic education and health indica<strong>to</strong>rshave improved markedly since independence. Based on the World DevelopmentIndica<strong>to</strong>rs, illiteracy rates declined from 56% in 1975 <strong>to</strong> 36% in 2000 andsteady progress was also made with primary school enrolment rates, and since1995 with secondary school enrolment rates (see Table 2.1). Life expectancyalso improved from around 49 years in 1975 <strong>to</strong> 59 years in 2000 and,according <strong>to</strong> World Bank data, infant and child mortality rates have alsoimproved since independence. Access <strong>to</strong> safe sanitation has improved greatlysince 1990 and access <strong>to</strong> safe water also improved significantly in urban areasfrom 1975 <strong>to</strong> 1990. However, although immunization rates are currently around2 The Contribution of <strong>Australian</strong> <strong>Aid</strong> <strong>to</strong> Papua New Guinea’s Development 1975–2000
Figure 2.1 Real GDP per capita in Papua New Guinea and other developing countries12001000Constant 1995 US$800600400<strong>PNG</strong>HPCLICLMCEAP20001975 1977 1979 1981 1983 1985 1987 1989 1991 1993 1995 1997 1999Notes:Source:HPC – Heavily indebted poor country, LIC – Low income countries, LMC – low <strong>to</strong> middle income countries andEAP – East Asia and the PacificWorld Development Indica<strong>to</strong>rsthe level of low-income countries they have deteriorated since 1990. UnitedNations Development Program (UNDP) data generally confirm the trends inbasic social indica<strong>to</strong>rs but in contrast <strong>to</strong> World Bank data suggest there hasbeen some deterioration in infant and child mortality rates in recent years,making the interpretation of health indica<strong>to</strong>rs difficult. Various reports havealso expressed concerns about the deterioration in health facilities in thecontext of rapid population growth, and have noted a deterioration in a rangeof indica<strong>to</strong>rs of diseases and health outcomes in recent years.The highly dualistic structure of the Papua New Guinea economy also continues<strong>to</strong> this day, with around 85% of the population dependent on agriculture <strong>to</strong>meet daily needs. Although Papua New Guinea has an income level similar <strong>to</strong>lower middle-income countries it is more appropriate <strong>to</strong> consider it as a lowincomecountry given the likely impact of the dualistic structure on the incomedistribution. In this respect it is worth noting that Papua New Guinea’s basicsocial indica<strong>to</strong>rs are also very similar <strong>to</strong> or better than low income countriesbut clearly inferior <strong>to</strong> lower middle-income countries.The Contribution of <strong>Australian</strong> <strong>Aid</strong> <strong>to</strong> Papua New Guinea’s Development 1975–2000 3
Table 2.1 Selected socio-economic indica<strong>to</strong>rs, <strong>PNG</strong> and developing country averages, 1975–2000Indica<strong>to</strong>r Unit 1975 1980<strong>PNG</strong> HPC LIC LMC EAP <strong>PNG</strong> HPC LIC LMC EAPPopulation growth rate a % 2.42 ––––2.49 2.84 2.41 1.56 1.61Illiteracy rate– adult female % of females 66.2 68.0 68.9 45.1 50.3 61.3 63.5 64.9 39.2 42.4ages 15 and above– adult male % of males 47.4 45.9 45.9 24.4 25.0 42.9 41.9 42.1 20.1 19.9ages 15 and above– adult <strong>to</strong>tal % of people 56.2 57.3 57.4 34.8 37.4 51.7 53.0 53.5 29.6 31.0ages 15 and aboveImmunization rate b–DPT % of children –––––26.0 14.9 13.7 54.5 45.9under 12 months–measles ––––––––––Life expectancy at birth– female years 49.0 49.2 51.3 64.5 63.1 51.6 51.1 54.0 67.6 65.8– male years 48.8 45.8 50.2 62.4 61.0 50.5 47.8 52.4 63.8 63.0– <strong>to</strong>tal years 48.9 47.4 50.7 63.4 62.0 51.1 49.4 53.2 65.6 64.4Mortality rate– infant per 1,000 live births 89.8 126.2 125.7 62.8 63.6 77.9 116.0 112.2 53.9 55.9– under 5 c per 1,000 live births –––––108.8 177.5 175.9 81.3 81.7– maternal d per 100,000 live births – – – – – – – – – –School enrolment e– primary % gross 56.4 68.0 73.2 113.9 114.0 58.9 79.6 82.9 107.5 110.6– secondary % gross 11.7 16.2 20.4 44.4 42.3 11.9 20.0 28.7 52.1 44.2Daily calorie supply f per capita (ca) 2090 –––––––––Daily protein supply g per capita (gm) 41 –––––––––Access <strong>to</strong> safe water h–rural % of population 19 ––––––––––urban % of population 30 ––––––––––<strong>to</strong>tal % of population ––––––––––Access <strong>to</strong> safe sanitation i % of population ––––––––––Births attended by % of <strong>to</strong>tal ––––––––––skilled health staff jNotes: Unless otherwise indicated, data are derived from World Bank, World Bank Development Indica<strong>to</strong>rs, Washing<strong>to</strong>n, D.C., 2001.–data not availablea Values are a period average of the annual population growth rate: 1975 refers <strong>to</strong> 1966–1975; 1980 refers <strong>to</strong> 1976–1980; 1985 refers <strong>to</strong>1981–1985; 1990 refers <strong>to</strong> 1986–1990; 1995 refers <strong>to</strong> 1991–1995; and 2000 refers <strong>to</strong> 1996–2000.b DPT data are not available for 1980 and 2000: values refer <strong>to</strong> 1983 and 1999, respectively. Measles data are not available for 2000: valuesrefer <strong>to</strong> 1999.c <strong>PNG</strong> data are not available for 1980, 1985, and 1990: values refers <strong>to</strong> 1979, 1984, and 1989, respectively. Data are not available for 1995:values refer <strong>to</strong> 1997.d Data obtained from ADB, 2002.e Data are not available for 2000: values refer <strong>to</strong> 1998.4 The Contribution of <strong>Australian</strong> <strong>Aid</strong> <strong>to</strong> Papua New Guinea’s Development 1975–2000
1985 1990 1995 2000<strong>PNG</strong> HPC LIC LMC EAP <strong>PNG</strong> HPC LIC LMC EAP <strong>PNG</strong> HPC LIC LMC EAP <strong>PNG</strong> HPC LIC LMC EAP2.64 2.66 2.28 1.56 1.55 2.52 2.73 2.28 1.63 1.67 2.58 2.52 2.05 1.23 1.37 2.56 2.44 1.97 1.01 1.1356.4 58.7 60.6 33.7 35.3 51.8 53.5 56.1 28.9 29.3 47.5 48.1 51.6 25.0 24.8 43.2 42.6 47.0 21.5 20.739.0 38.0 38.5 16.6 15.8 35.6 34.1 34.9 13.6 12.5 32.4 30.2 31.5 11.2 10.0 29.4 26.6 28.3 9.2 7.947.3 48.6 49.5 25.0 25.4 43.4 44.0 45.4 21.2 20.8 39.7 39.3 41.5 18.1 17.3 36.1 34.7 37.6 15.3 14.240.0 25.7 21.6 73.5 64.3 67.0 61.7 64.4 92.6 89.5 47.0 63.5 63.7 88.4 87.0 56.0 57.1 56.6 88.8 85.233.0 26.6 14.8 76.0 68.5 67.0 62.0 59.8 92.3 89.4 75.0 62.6 66.0 89.7 86.9 58.0 61.1 56.6 89.1 85.453.9 52.8 56.3 69.4 67.9 55.9 53.5 58.1 70.3 69.0 57.9 53.2 59.4 70.8 69.9 59.4 52.2 60.0 71.7 70.952.4 49.5 54.5 65.3 64.6 54.4 50.4 56.3 66.2 65.6 57.1 51.8 58.4 68.5 68.1 57.8 57.8 57.8 57.8 57.853.1 51.1 55.4 67.3 66.2 55.1 51.9 57.2 68.2 67.3 57.1 51.8 58.4 68.5 68.1 58.6 50.9 58.9 69.5 69.171.5 108.5 99.4 45.1 48.1 83.3 102.9 88.1 39.6 43.2 66.5 95.1 81.0 37.5 39.8 56.1 88.9 76.1 32.6 35.592.3 ––––107.7 140.8 127.1 49.8 55.0 82.4 153.6 117.4 44.3 48.5 74.7 153.9 114.9 40.6 44.7–––––930.0 ––––390.0 ––––370.0 ––––65.9 75.9 88.4114.7 118.5 71.9 73.5 88.5 116.3 120.1 80.4 76.8 91.0 112.0 115.0 84.9 82.0 95.8 106.4 107.011.5 20.8 34.5 49.4 41.6 12.4 20.8 37.1 55.7 48.1 14.0 23.0 40.2 66.9 62.9 22.3 28.0 42.3 63.0 62.0–––––2236 –2342 2741 ––––––––––––––––42 –56 71 –––––––––––– – – – –15 – –47 – – – – – –32 – – – ––––––95 –73 77 ––––––88 ––––– – – – – – – – – – 24 – – – – 41 – – – ––––––10.5 ––––25 ––––83 ––––43.0 ––––40.0 –43.3 ––33 –––––––––f Data are not available for 1975: <strong>PNG</strong> refers <strong>to</strong> 1971. 1971 data obtained from AIDAB, 1994, p.164. Data are not available for 1990: values refer <strong>to</strong> 1989.1989 data obtained from AIDAB, 1992, p.66.g Data are not available for 1975: <strong>PNG</strong> refers <strong>to</strong> 1971. 1971 data obtained from AIDAB, 1994, p.164. Data are not available for 1990: values refer <strong>to</strong> 1989.1989 data obtained from AIDAB, 1992, p.66.h Total data are not available for 2000: <strong>PNG</strong> refers <strong>to</strong> 2001. Rural and urban data are not available for 1975: values refer <strong>to</strong> 1971. Rural and urban data for1971 obtained from AIDAB, 1994, p.164. Rural and urban data for 1989 obtained from AIDAB, 1992, p.66. Total data for 1995 and 2000 obtained from ADB,2002, p.12.i The value for 1989 is an average of 1980–89. Data are not available for 2000: <strong>PNG</strong> refers <strong>to</strong> 2001. 1989 data obtained from World Bank, 1999b, p.24. 1995and 2000 data obtained from ADB, 2002, p.12. Note that World Bank, 1999a, p.178, records 83% in 1996, a marked divergence from the 1995 value.j <strong>PNG</strong> data are not available for 1985, 1990, and 1995: values refer <strong>to</strong> 1986, 1989 and 1994, respectively.The Contribution of <strong>Australian</strong> <strong>Aid</strong> <strong>to</strong> Papua New Guinea’s Development 1975–2000 5
2.2 Macroeconomic PerformanceThe 1975 <strong>to</strong> 1989 period was characterised by relative economic stability butpoor international competitiveness and associated low economic growth. Thisphase of development was brought <strong>to</strong> an end in 1989 as the economy faced amajor crisis following the closure of the Panguna mine in Bougainville andassociated civil unrest, and a large decline in agricultural export prices. The firststructural adjustment program was implemented at this time and, as oil andmining revenues grew quickly, the management of mineral revenues became anincreasingly important issue. A lack of fiscal discipline and poor progress onstructural reforms culminated in a balance of payments crisis in 1994 and led <strong>to</strong>the adoption of a new exchange rate regime. At the same time, a shift fromdirect budget support <strong>to</strong> programmed assistance was well underway.Since 1995, a (managed) flexible exchange rate regime has been in place andthe move from budget support <strong>to</strong> programmed assistance has been completed.Reforms made with the adoption of the 1995 Organic Law on Provincial andLocal Level Governments saw a significant change in the relationship betweennational and provincial governments. In response <strong>to</strong> repeat episodes ofmacroeconomic instability, two further structural adjustment programs havebeen undertaken with the support of the international community. While theperiod from 1990 <strong>to</strong> 1994 saw considerable investment in the mining and oilsec<strong>to</strong>rs, investment has since been subdued and the economy has now been inrecession since 1999. The economy is once again facing the prospect ofmacroeconomic instability, triggered by excessive government expenditure.There continues <strong>to</strong> be a lack of confidence in the mining sec<strong>to</strong>r and generaluncertainty as <strong>to</strong> the credibility of current government policies.2.3 Rural DevelopmentPapua New Guinea has substantial renewable resources and 85% of thepopulation continues <strong>to</strong> rely on a mix of subsistence and cash activities in theagriculture sec<strong>to</strong>r. Despite the importance of small-scale agriculture,government policies have tended <strong>to</strong> focus on mining, logging, and the majorexport cash crops of coffee, oil palm, cocoa and coconuts.Agriculture’s share of GDP was around 30% in 1975 and has exhibited a gradualtrend decline <strong>to</strong> about 25% of GDP in 2001. At times agriculture has beenboosted by the impact of devaluations and at other times suffered from suddenand large declines in the terms of trade and drought. For most of the periodsince independence coffee was the most important agricultural export crop butsince mid-2000 oil palm has been more important. Price support schemes havebeen a longstanding feature of government policy but have at times been a6 The Contribution of <strong>Australian</strong> <strong>Aid</strong> <strong>to</strong> Papua New Guinea’s Development 1975–2000
significant strain on the budget and have had adverse incentive effects wheninternational prices are high. The significant real devaluation of the currencythat has occurred since the mid-1990s is considered <strong>to</strong> have been more effectivein providing appropriate price incentives <strong>to</strong> agriculture in general.Key constraints <strong>to</strong> the development of agriculture are a rudimentary transportnetwork, cumbersome land tenure arrangements, cultural fac<strong>to</strong>rs, law and orderproblems and inadequate extension services. All of these fac<strong>to</strong>rs are considered<strong>to</strong> discourage investment and restrict the scope for productivity improvementsin agriculture.2.4 EducationInadequate education has been one of the most significant constraints <strong>to</strong>economic and social development in Papua New Guinea. Ultimately, this hasbeen reflected in skill shortages, low workforce productivity and, in conjunctionwith high real wages, it has contributed <strong>to</strong> low international competitivenessand low formal employment growth.Post-independence governments have specified universal primary education asa key objective. A substantial expansion of primary and lower secondaryenrolment was made in the 1975–89 period (World Bank, 1991, p. 107). Grossenrolment in the primary age group rose from 56% in 1975 <strong>to</strong> 72% in 1988.Moreover, during 1975–89, the share of female students in <strong>to</strong>tal enrolmentincreased from 37% <strong>to</strong> 44% in the primary schools and from 30% <strong>to</strong> 38% atthe lower secondary level.Despite improvements in basic education indica<strong>to</strong>rs, the 1990 population censusfound that over 50% of the population over the age of 10 had no schooling atall and around a further 20% had only completed grades one <strong>to</strong> five (Gannicott,1993). High and growing attrition rates at primary schools, falling transitionrates at the upper secondary level, low-quality teachers, high unit costs, andregional and gender disparities (although showing strong improvement) alsocharacterised the education system in the early 1990s. Many reasons have beenadduced in explanation of high attrition rates, all of which stress conditions inthe schools and other external fac<strong>to</strong>rs: the payment of fees; distance fromschools; under-nourishment; tribal and clan conflict; and the high opportunitycost of education (Goodman et al., 1987, p. 175).There is a general consensus in the human resource development literature of theneed <strong>to</strong> give priority <strong>to</strong> primary and lower secondary education when a countryis at a relatively low level of economic and human resource development. Thisproposition was considered especially relevant <strong>to</strong> Papua New Guinea in thisperiod where unit costs for tertiary education were very high and where in 1989The Contribution of <strong>Australian</strong> <strong>Aid</strong> <strong>to</strong> Papua New Guinea’s Development 1975–2000 7
the 2% of students enrolled at tertiary institutions received 39% of the publicsubsidy <strong>to</strong> education (Gannicott, 1993, p. 148). Investment in primary andsecondary education was further compromised because responsibility has beendivided between the national and provincial governments.Although Papua New Guinea is still characterised by a low education status forthe population in general and the workforce in particular there has been steadyimprovement in the basic education indica<strong>to</strong>rs. During 1990–95, gross primaryschool enrolment increased from 72% <strong>to</strong> 80% and gross secondary schoolenrolment rose from 12% <strong>to</strong> 14%. Further improvement occurred in the periodfrom 1995 <strong>to</strong> 2000 with primary school enrolment increasing <strong>to</strong> 85% andsecondary school enrolment <strong>to</strong> 22%. The improvement in general literacy since1975 is also significant.However there continue <strong>to</strong> be problems with quality, inequities betweenprovinces and by gender, and poor retention and progression rates. Lowenrolment rates are still noted in many parts of Papua New Guinea, especiallysecondary enrolment rates. Many students lack access <strong>to</strong> secondary school.2.5 HealthAt the time of independence health was regarded as an important issue andthe 1974 National Health Plan focused on expanding the provision of healthservices <strong>to</strong> rural areas (Connell 1998, p. 235). In the period from 1975 <strong>to</strong> 1989the National Department of Health had overall responsibility for the health ofthe population but each province had considerable au<strong>to</strong>nomy in the deliveryof health services. The National Department of Health was responsible forpolicy, training programs and the delivery of a limited range of services buthad no power <strong>to</strong> impose sanctions on provincial health authorities. Churches,supported by very substantial government subsidies, played a major role in theprovision of rural health services and the training of nurses and communityhealth workers.Naylor et al (1993) summed up the health care services situation from the mid-1970s <strong>to</strong> the early 1990s by noting that:• The health status of the population had improved considerably.• The establishment of a comprehensive network of health facilities had beensuccessful.• There were, however, inadequate funds <strong>to</strong> operate the large number offacilities effectively.• Secondary health services were extremely run down and tertiary serviceswere very limited, but primary health care should be the priority.• Primary health care could be enhanced by greater community involvement.8 The Contribution of <strong>Australian</strong> <strong>Aid</strong> <strong>to</strong> Papua New Guinea’s Development 1975–2000
• Improved central coordination and control of the health budget wasdesirable.• There was an important need <strong>to</strong> develop a number of managementperformance indica<strong>to</strong>rs.• Poor health affects economic performance through absenteeism, the ability<strong>to</strong> work and high treatment costs.However there have been considerable differences in health provision andoutcomes at the provincial level and within provinces (Connell 1997,pp. 231–40). Connell also claims the urban bias in health care provision hasworsened since independence.Institutional reforms <strong>to</strong> address various problems in the health system (largelyassociated with decentralisation) were initiated in 1993. A National Health Planfor 1996 <strong>to</strong> 2000 was also developed. The National Department of Healthreceived significant international support in this period but the mainachievements seemed <strong>to</strong> be in planning and data gathering rather than inimproving service delivery (ADB Health and SWAP Review, 2002). Variousreports have noted the poor state of health indica<strong>to</strong>rs relative <strong>to</strong> compara<strong>to</strong>rcountries, with child and maternal mortality rates being the highest in theregion and malnutrition being more extensive than anywhere else in the Pacific(Connell 1997, p.240). Other reports have identified a deterioration in a rangeof other indica<strong>to</strong>rs of facilities, outputs and diseases. There were reported <strong>to</strong> beincreases in immunisable diseases, chronic infectious diseases, lifestyle diseases,malaria, pneumonia and malnutrition in the late 1980s and early 1990s,especially in the Highlands and coastal areas (Economic Insights 1996).The World Bank (1999, pp. 87–89) claims that over the past 20 years physicalinfrastructure deteriorated and that <strong>to</strong>day most facilities are in anunsatisfac<strong>to</strong>ry condition and provide poor services. The 1999 report noted thata 1996 health and demographic survey found that only 39% of health facilitieswere in a satisfac<strong>to</strong>ry condition and less than 70% of rural aid posts wereoperating. The report also noted marked regional variations in the availability,condition and performance of health care facilities.According <strong>to</strong> the ADB Health and SWAP Review (2002) both process and outputindica<strong>to</strong>rs declined in the period 1999–01. In addition many rural healthfacilities were closed in 2001 because of insufficient funding at the provinciallevel. These conclusions are consistent with indica<strong>to</strong>rs in the <strong>AusAID</strong> healthsec<strong>to</strong>r review. The <strong>AusAID</strong> review also notes that newer diseases like typhoidhave become endemic, older diseases like yaws and filariasis are re-emerging inselected parts of the country and other infectious diseases are becoming majorproblems. HIV/AIDS has also developed in<strong>to</strong> a major health problem.The Contribution of <strong>Australian</strong> <strong>Aid</strong> <strong>to</strong> Papua New Guinea’s Development 1975–2000 9
Decentralisation has been identified as an important fac<strong>to</strong>r in the deteriorationin health services. As with the broader public sec<strong>to</strong>r there is no link betweenperformance and rewards or sanctions. Rural primary health expenditure is stillconsidered <strong>to</strong> be very low, and expenditure at the provincial level isunpredictable and uneven. However some provinces are continuing <strong>to</strong> performreasonably well in a difficult environment and the need for greater focus onprimary health is gradually being redressed.2.6 The Socio-Political Environment andGovernance IssuesPapua New Guinea is a nation formed from over 800 language groups andthousands of small ethno-political groups each with its own distinctive culturalattributes. It is also a latecomer <strong>to</strong> the modern world and cultural traditions andlinkages <strong>to</strong> social groups still have strong and, in many cases, dominant effects.The rugged dispersed <strong>to</strong>pography means that many villages are remote andisolated. Bridging the gap between traditional and modern ways of life hasproven very difficult. Co-operation within social or ethno political groups isstrong but across them is weak. The fragmentation of ethno political groupsmakes it difficult <strong>to</strong> build and maintain broad-based social coalitions.Jones and McGavin drawing on a wide literature (2001, pp. 14–15) argue that alarge number of studies of the governance problem in Papua New Guineahighlight the dissonance between the governance hallmarks of the modern stateand traditional cultural institutions primarily associated with loyalty <strong>to</strong> theclan. The result is dispersion of authority and, in conjunction with the loweducational capacity of the population, leads <strong>to</strong> an inability of the government<strong>to</strong> make good progress in the design, implementation and acceptance ofdevelopment policies.Reflecting the clan based traditions, Papua New Guinean politics have tended <strong>to</strong>be dominated by personalities and/or regional groupings rather than by policiesand ideologies. Political loyalties are extremely fluid and votes of no-confidenceagainst the sitting Prime Minister have been a regular feature. Politicians arealso expected <strong>to</strong> deliver resources <strong>to</strong> their constituents in a manner that isincongruent with modern standards of governance. This view is reflected in thetribal rivalry and violence that occurs at elections as rival groups attempt <strong>to</strong>increase their chances of winning access <strong>to</strong> resources (Ahai 1998 and EconomicInsights 1999). The view is also consistent with the expectation of reciprocalcommitments and resource transfers under the Wan<strong>to</strong>k system. At the highestpolitical level the Rural Development Fund is another reflection of thedistributional focus of politics and society in Papua New Guinea.10 The Contribution of <strong>Australian</strong> <strong>Aid</strong> <strong>to</strong> Papua New Guinea’s Development 1975–2000
Connell (1998, pp. 311–2) highlighted governance problems as a critical fac<strong>to</strong>rin explaining the lack of growth and highlighted the following characteristics:• The basic economic system has not fundamentally changed sinceindependence.• Papua New Guinea demonstrates some of the classic symp<strong>to</strong>ms of the‘resource-curse’ thesis where countries that are relatively well endowed withnatural resources perform worse than less well endowed countries.• The whole structure of development has become highly politicised andpersonalised, with politicians, bureaucrats, and landowners seeking directinvolvement in new projects. At every level economic activity is part ofpolitical economy.• The state has failed <strong>to</strong> stimulate the agricultural sec<strong>to</strong>r or regulate theforestry sec<strong>to</strong>r.• The State has largely failed <strong>to</strong> serve the needs of the rural and urban poor,especially through service delivery.• Underlying structural problems remain.• The State is constantly struggling <strong>to</strong> manage its problems.• There is almost a continuous state of semi-emergency in some parts of thecountry.In a comprehensive report on the status of the economy, public institutions andpublic policies, the World Bank also concluded that Papua New Guinea’s mainproblem was poor governance (World Bank 1999, p. xxvii).Some changes have been made in recent years <strong>to</strong> help achieve greater politicalstability and the integrity of election processes. In 2001 the Morautagovernment embarked on a program of attempting <strong>to</strong> establish a more stablepolitical system and introduced various elec<strong>to</strong>ral and parliamentary partyreforms. But the impact of the reforms is yet <strong>to</strong> be tested.2.7 Law and OrderPublic security and the effective operation of a rule of law that protects privateproperty and contractual arrangements are essential for supporting socioeconomicdevelopment and economic growth. The law and order problem hasbeen identified as a major economic and social development problem andconstraint in Papua New Guinea for all of the period since independence.The law and order problem has restricted the nature and extent of economic,government service and personal leisure activities. It has directly diminishedthe quality of life on a daily basis and has meant that the work force and thecapital s<strong>to</strong>ck have been under-utilised. It has meant that businesses andgovernment facilities face increased security costs, restricted hours of operationThe Contribution of <strong>Australian</strong> <strong>Aid</strong> <strong>to</strong> Papua New Guinea’s Development 1975–2000 11
and higher wage premiums and security costs for imported skilled labour. It hasalso limited personal development opportunities because of travel constraintsand restricted hours of educational institutions. Armed hold ups, theft andtribal fighting have restricted the growth of the coffee industry in particular,and <strong>to</strong>urism has been unable <strong>to</strong> develop <strong>to</strong> a scale that could have had a highlybeneficial impact.Riots, violent demonstrations, attacks on parliament, violence at elections andcurfews have also been features of the law and order problem. Reilly (2002,p. 139) notes that the 2002 elections were widely condemned as the worst ever,with over 30 people killed in ethno-political elec<strong>to</strong>ral disputes, violentdisruptions in the Highlands and polling abandoned in six seats, as well asmajor elec<strong>to</strong>ral fraud and administrative problems. In addition the Bougainvilleconflict had a duration of more than 10 years starting in 1989 and was one ofthe major disturbances in the region since the Second World War.Papua New Guinea’s Institute of National Affairs has undertaken severalsurveys of impediments <strong>to</strong> growth in the private sec<strong>to</strong>r in the past 20 years.Law and order was at the <strong>to</strong>p of the list in 1982, 1989, 1996 and 1999(Economic Insights 1999, p. 26). The crime problem extends beyond violentcrimes <strong>to</strong> corruption, which has been a long standing problem. In 1985 MichaelSomare, in reviewing the ten-year period since independence, considered thatcrime including both street crime and corruption constituted the greatest threat<strong>to</strong> the country.There are signs however of improvements as reflected in a reduction in the<strong>to</strong>tal number of offences by 23% between 1999 and 2001. In the same period,robberies (which are a key indica<strong>to</strong>r of serious crime) also declined by 20%.However one cannot be confident in these statistics because many crimes arenot reported and there are likely <strong>to</strong> be many inaccuracies in reported figures.2.8 Access <strong>to</strong> LandAlthough there is ample land in a physical sense, land is restricted in aneconomic sense. Only about 3% of land was alienated by the colonialadministration and this proportion has not changed since independence. Inaddition much of the alienated land is under-utilised and complex requirementsfor the transfer, mortgage or lease of this land are generally considered <strong>to</strong>represent a significant business constraint.Access <strong>to</strong> cus<strong>to</strong>mary land remains a matter for local negotiation in accordancewith cus<strong>to</strong>mary arrangements and traditions. Successful land mobilisation canoften only be achieved at a very large and ongoing cost and can only beafforded by very large and profitable enterprises, as demonstrated for example12 The Contribution of <strong>Australian</strong> <strong>Aid</strong> <strong>to</strong> Papua New Guinea’s Development 1975–2000
y the successful mobilisation of cus<strong>to</strong>mary land for oil palm development inWest New Britain. In addition cus<strong>to</strong>mary land cannot be used as collateral <strong>to</strong>secure finance.There has been little progress in improving the access <strong>to</strong> land since independence(Larmour 1991 and Jones and McGavin, 2001, p. 16). The most recent program,known as the Land Mobilisation Program, was suspended in 1995 followingstudent unrest and widespread public concern. Weak administrative capacity, lackof leadership and lack of widespread acceptance of the formal property rightssystem have been identified as the main reasons for failure with landmobilisation schemes.2.9 InfrastructureThe rugged and varied terrain and dispersed settlements in Papua New Guineahave been important fac<strong>to</strong>rs in both contributing <strong>to</strong> a high cost structure and inexplaining relatively low social indica<strong>to</strong>rs and regional inequalities. Inparticular, the availability, standard and condition of road infrastructure arelongstanding perennial weaknesses that have had a major impact on the ruralpopulation.The high costs, limited quality and low penetration of Papua New Guinea’sinfrastructure have been highlighted in a number of studies. The Duncan andLawson (1997) study on cost structures found that the cost of security wasconsidered <strong>to</strong> be a “serious problem" by more firms than any other fac<strong>to</strong>r.However they also found that access <strong>to</strong> skilled labour, transport costs, the costand reliability of electricity and the quality of communications services wereconsidered by a large proportion of firms <strong>to</strong> be serious or moderate problems.They also noted a clear decline in satisfaction with all fac<strong>to</strong>rs assessed, withsignificant deterioration in transport, electricity, communication services andaccess <strong>to</strong> and quality of water.2.10 Provincial DimensionsWhile the basic social indica<strong>to</strong>rs tend <strong>to</strong> suggest trend improvements for PapuaNew Guinea as a whole, there are exceptions between and within provinces andsignificant and persistent regional disparities. Several of the Highlandsprovinces have extremely low access <strong>to</strong> safe water, low literacy rates and lowschool enrolment rates. However with the exception of the Gulf and Milne Bayprovinces life expectancy improved in all provinces between 1980 and 1996according <strong>to</strong> UNDP data. The percentage of underweight children also declinedin 13 of 15 provinces for which data are available between 1982 and 1996. Thegross elementary, primary and secondary school enrolment rate also improvedThe Contribution of <strong>Australian</strong> <strong>Aid</strong> <strong>to</strong> Papua New Guinea’s Development 1975–2000 13
significantly in all provinces except Bougainville, East New Britain and theNational Capital district between 1980 and 1996. Reflecting the urban-regionaldisparity the National Capital generally records a much better result on mostsocial indica<strong>to</strong>rs (the notable exception being in relation <strong>to</strong> school enrolment)and a much higher average real income.Implementation capacity has been a longstanding general weakness at theprovincial and local government level. The 1995 provincial reforms sought <strong>to</strong>improve public service delivery with a restructuring of national and provincialgovernment and transfer of additional functions <strong>to</strong> local governments. Thereare now four levels of government: national, provincial, district and local,however the national government now has more influence as directly electedprovinces were abolished. The reform has been hampered by inadequatefunding, legislative difficulties, and capacity and infrastructure at lower levelsof government.14 The Contribution of <strong>Australian</strong> <strong>Aid</strong> <strong>to</strong> Papua New Guinea’s Development 1975–2000
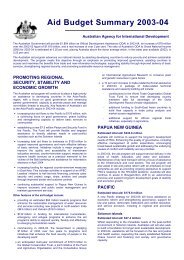
3 INTERPRETING THE DEVELOPMENT ANDGROWTH OUTCOMES3.1 IntroductionThe conventional perception of development in Papua New Guinea since 1975has at its core a sense of lost opportunity. Papua New Guinea is widely seen asa resource rich country that has made poor use of its opportunities. Thiscriticism is generally most severe for the 1990s, a period in which the qualityof government is seen <strong>to</strong> have declined markedly.But the conventional view suffers from an important weakness. Although thereare concerns about the accuracy and comparability over time in the availabledata on the main development indica<strong>to</strong>rs, they point <strong>to</strong> substantialimprovements in living standards since 1975.Based on the estimates of life expectancy, infant and child mortality rates,illiteracy, school enrolment rates and immunisation rates contained in theWorld Development Indica<strong>to</strong>rs, it appears reasonable <strong>to</strong> conclude that –• Although the level of development is low, Papua New Guinea has developedat a pace that is broadly similar <strong>to</strong> other low-income developing countries.• There appears <strong>to</strong> have been continued improvement over the 1990s in keysocial indica<strong>to</strong>rs. 1These observations in turn suggest it is reasonable <strong>to</strong> reconsider theconventional negative view of Papua New Guinea’s performance sinceindependence. The remainder of this section explores the determinants ofgrowth and development with a view <strong>to</strong> reassessing this negative view of PapuaNew Guinea’s achievements since independence.3.2 Identifying the Sources of Economic GrowthReal GDP is estimated <strong>to</strong> have grown at an average annual rate ofapproximately 2.5% since independence. A substantial share of GDP is earnedby the mining and oil projects and consequently flows <strong>to</strong> overseas inves<strong>to</strong>rs. Soin a development context it is normally more meaningful <strong>to</strong> speak of growth inthe non-mining sec<strong>to</strong>r. The non-mining sec<strong>to</strong>r did not match the growth in<strong>to</strong>tal GDP, with real non-mining GDP increasing on average by approximately2% per annum. For both measures the expansion was strongest over the early1990s and there has been a contraction in recent years (see Figure 3.1(a)).1 The main differences in data sources relate <strong>to</strong> estimates of infant and maternal mortality rates. As noted inSection 2, the 1998 Human Development Report points <strong>to</strong> a deterioration in these indica<strong>to</strong>rs over the 1990s,whereas the WDI shows continuing improvement (see Go<strong>PNG</strong> and UNDP (1998)).The Contribution of <strong>Australian</strong> <strong>Aid</strong> <strong>to</strong> Papua New Guinea’s Development 1975–2000 15
In looking for the sources of growth in <strong>to</strong>tal GDP and non-mining GDP, it ispossible <strong>to</strong> rule out increased capital investment and government consumption.Both have remained reasonably stable over the period in real terms. Therecorded increase in GDP is instead shown <strong>to</strong> be a result of rising exports andprivate consumption (see Figure 3.1(b)).Figure 3.1 The Growth Performance(a) Real GDP and non-mining GDP(b) The Components of Real GDPMillion kina in real terms (1983 Prices)4,0003,0002,0001,00001975 1981 1987 1993 1999Million kina in real terms (1983 Prices)2,5002,0001,5001,00050001975 1981 1987 1993 1999GDPPrivate consumptionNon-mining GDPGovernment consumptionInvestmentExports(c) Real per capita non-mining(d) Real per capita value-added by sec<strong>to</strong>rKina in real terms (1983 Prices)7006506005505004501975 1981 1987 1993 1999K per person in real terms (1983 Prices)40030020010001975 1981 1987 1993 1999Expenditure dateReal Agricultural output per capitavalue-added dataReal industry output per capitaReal services output per capitaSources:Bank of Papua New Guinea, 1998, Money and Banking in Papua New Guinea, Bank of Papua New GuineaQuarterly Economic Bulletin, various quarters, Government of Papua New Guinea, 2002, Economic andDevelopment Policies, Volume 1 of the Budget Papers, various years, World Development Indica<strong>to</strong>rs (population).Much of the increase in exports is a result of increased mining and oil activity.While most of the income earned by the sec<strong>to</strong>r flows overseas, the expansion inmining and oil exports does have important flow-on effects for the non-miningsec<strong>to</strong>r as it increases Government revenue, provides payments <strong>to</strong> landownersand stimulates some supporting economic activity (eg, in transport or thefinance sec<strong>to</strong>r).16 The Contribution of <strong>Australian</strong> <strong>Aid</strong> <strong>to</strong> Papua New Guinea’s Development 1975–2000
The estimated increase in private consumption can be seen <strong>to</strong> be predominantlya result of population growth. However, some contribution was also providedby an improvement in agricultural exports over the 1990s and from the flowoneffects of expansion in other sec<strong>to</strong>rs.If the effect of population growth is removed, it becomes clear that the growthperformance has been weak. Population growth has roughly matched GDPgrowth, and there has been little change over 25 years in both per capita GDPand non-mining GDP. While interpretation of the per capita estimates of GDP iscomplicated by data problems, the key point is that there has been little or nooverall growth since independence on a per capita basis (see Figure 3.1(c)).The data point <strong>to</strong> a stable or declining level of real per capita incomes <strong>to</strong> thelate 1980s before a large rise in the 1990s. The noticeable rise over the 1990s islargely attributable <strong>to</strong> the benefits of booming mining and oil sec<strong>to</strong>rs. Howevermuch of the gains seen over the 1990s have recently been lost as the economyhas contracted. This contraction can in turn be traced back <strong>to</strong> passing of the oilboom as reserves at Kutubu quickly declined, the unwinding of a dutch diseasetype problem (as discussed further below) and the adverse effects of a relaxationof fiscal responsibility and deteriorating physical infrastructure (eg roads). Theadverse effects of the underlying constraints <strong>to</strong> development, such as discussedin Section 2, have also played an important role in the poor growth outcome.On a per capita basis there has been a trend decline in investment andgovernment consumption. This was partially compensated for by the rise inexports and private consumption. As noted, much of the increase in exportscan be attributed <strong>to</strong> the increase in the mining and oil sec<strong>to</strong>rs. On a per capitabasis, the real value of agricultural output remained fairly stable in real terms,although the sec<strong>to</strong>r showed some signs of improvement over the 1990s (seeFigure 3.1(d)). The real value of industry and services output on a per capitabasis trended down from independence <strong>to</strong> the late 1980s, and has since alsoshown some signs of improvement as overall economic growth has improved.3.3 Explaining the Determinants of <strong>PNG</strong>’sGrowth PerformanceDrawing on the established international framework for analysing growth, it ismeaningful <strong>to</strong> categorise the underlying determinants of economic growth aslikely <strong>to</strong> be –• Growth in the s<strong>to</strong>ck of physical capital.• Growth in the s<strong>to</strong>ck of human capital, both the quantity and quality.• Technological change.• The policy environment.• The institutional environment.The Contribution of <strong>Australian</strong> <strong>Aid</strong> <strong>to</strong> Papua New Guinea’s Development 1975–2000 17
Unfortunately a shortage of reliable data prevents defensible statistical analysisof the relative importance of these broad determinants of growth. Nonethelesssome useful observations can be made.The first point <strong>to</strong> note is that the growth in the non-mining economy sinceindependence is largely accounted for by population growth. Overall theeconomy has only been growing at the rate of the population, and there hasbeen little or no growth in real per capita incomes. This observation confinesthe assessment of the growth performance. There is no need <strong>to</strong> try anddisentangle the contribution of technological change, improved human capital,the policy environment, etc. At an aggregate level there is simply no growth inper capita incomes <strong>to</strong> explain.A second key point is the apparent absence of a growth dividend fromimproved education and health. The improved social indica<strong>to</strong>rs presented abovepoint <strong>to</strong> an improved quality of the human capital input (ie, a better educatedand healthier population). Improvements in the quality of human capital shouldresult in growth, but this does not appear <strong>to</strong> have been the case in Papua NewGuinea. It appears reasonable <strong>to</strong> conclude that the potential offered by theimprovement in human capital has been stifled by other constraints.Or in other words, the aggregate data suggest that something is holding theeconomy back. But what are these constraints? The aggregate data are notsufficiently rich <strong>to</strong> allow a rigorous identification of the constraints that matterthe most. But the most likely explanation is that realisation of the benefits ofimproved human capital has been constrained by weaknesses in the policy andinstitutional environment and/or perhaps a shortage of physical capital, notablyphysical infrastructure. In this respect it certainly seems reasonable <strong>to</strong> arguethat key constraints are likely <strong>to</strong> include the adverse impacts of the ‘dutchdisease’, effects associated with a booming mining sec<strong>to</strong>r and substantial aid,the law and order problem, the adverse effect on incentives of certain aspectsof the culture and the macroeconomic instability created by poor fiscalmanagement are key fac<strong>to</strong>rs.It is also likely that private investment in physical capital has been held backby similar constraints. The poor investment record would have had the adverseflow-on effect of reducing opportunities for new technology <strong>to</strong> be introduced,further hindering growth.In summary, unfortunately for Papua New Guinea it is not a case of explainingwhy growth has occurred, but of explaining why the growth outcome has beenweak. And these explanations inevitably point back <strong>to</strong> the state of the policyand institutional environment and public infrastructure.18 The Contribution of <strong>Australian</strong> <strong>Aid</strong> <strong>to</strong> Papua New Guinea’s Development 1975–2000
3.4 Reconciling the Growth and Development OutcomesFor many observers, Papua New Guinea’s poor development performance isconfirmed by the observation that it is a low middle-income country with thesocial indica<strong>to</strong>rs of a low-income country. 2 The observation is seen as proofthat Papua New Guinea has made poor use of its income – it should be able <strong>to</strong>afford a much higher state of development than it has achieved. The problem isusually attributed <strong>to</strong> weaknesses within the public sec<strong>to</strong>r that have grown sinceindependence.But the combination of a poor overall growth performance and substantiallyimproved social indica<strong>to</strong>rs challenges this view. While key social indica<strong>to</strong>rshave improved by the order of 20 <strong>to</strong> 50% (as reported by the WorldDevelopment Indica<strong>to</strong>rs), real per capita incomes have been stable or perhapsdeclined. And the improvement in key social indica<strong>to</strong>rs occurred while realgovernment consumption declined in both aggregate and per capita terms. Thatis, people have been able <strong>to</strong> lift their standard of living without additionalincome or expenditure.This outcome is unusual. Of the main country groups of East Asia and thePacific, Latin America and the Caribbean, South Asia and Sub-Saharan Africa,the substantial improvement in key social indica<strong>to</strong>rs since around 1970 hasbeen accompanied by real income growth. Looking at individual countries, thesame relationship applies <strong>to</strong> Hong Kong, Korea, Singapore, Taipei China,Indonesia, Malaysia, Thailand, Bangladesh, India, Nepal, Pakistan and Sri Lanka(that is, both real incomes and social indica<strong>to</strong>rs have improved in thesecountries over the past 25 years or so).One possible explanation of the unusual outcome in Papua New Guinea is thateven though incomes and government expenditure have not improved, theyhave been at a sufficient level <strong>to</strong> lift living standards. It is possible that thereare high returns on public programs at the early stage of development as seenin Papua New Guinea. If so, even stable levels of income and governmentexpenditure can provide a sustained improvement <strong>to</strong> living standards. Orperhaps the composition of resource use has improved over time such that morehas been achieved from every available kina allocated <strong>to</strong> public programs.Both interpretations are somewhat at odds with the generally negative perceptionof the quality of public services since independence and especially over the1990s. This suggests it is plausible <strong>to</strong> question whether the often-reportedineffectiveness and deterioration in services is as severe as widely discussed.2 For a long time Papua New Guinea has been formally classified as a lower middle-income country. Howeveron 1 January 2003, Papua New Guinea was formally reclassified by the DAC (Development AssistanceCommittee of the OECD (Organisation for Economic Cooperation and Development) as a lower-income country.The Contribution of <strong>Australian</strong> <strong>Aid</strong> <strong>to</strong> Papua New Guinea’s Development 1975–2000 19
Of course this argument is open <strong>to</strong> debate. It says nothing about the level ofthe return or how much money was poorly used. It is possible for example thatthe same benefits could have been achieved at an even lower level ofexpenditure. It is also possible that the benefits would have occurred evenwithout public programs. There appear <strong>to</strong> have been rapid gains in Papua NewGuinea in a relatively short period (the infant mortality rate in the highlands inthe 1930s was reported as 1 in 4, and is now around 1 in 10), and there mayhave been sufficient momentum from an exposure <strong>to</strong> better living practices(eg, with respect <strong>to</strong> the feeding of infants, sanitation or prevention of disease)<strong>to</strong> have assured an improvement in living standards over time.This report tentatively draws the conclusion that public programs have made animportant contribution <strong>to</strong> the improvement in living standards sinceindependence. The examination of assistance programs provided in othersections of this report provides some confidence that sensible public programshave been operating. But perhaps more importantly it is difficult <strong>to</strong> beconvinced that such large improvements in living standards as have been seencould have been achieved without improved public programs, given that realper capita incomes and government consumption have been stable or fallen ona per capita basis. For example, it is difficult <strong>to</strong> see why higher schoolparticipation rates would have been sustained without recognition by parentsthat the education system was of value. It seems reasonable <strong>to</strong> conclude thatthere must have been sufficient teachers, classrooms, appropriate teachingtraining, etc, <strong>to</strong> provide a worthwhile service and keep children away fromalternative activities (eg, helping in the home or food garden).In reaching the conclusion that public programs have lifted living standardsover the 25 years since independence, it is important <strong>to</strong> recognise thatcandidates for sharing the credit for the gains include the communitiesthemselves, the NGO movement and in particular the churches, the governmentand donors. While it appears reasonable <strong>to</strong> conclude that public programs havemade an important contribution, it is harder <strong>to</strong> establish from this aggregateanalysis which group has generated the returns.This is not <strong>to</strong> suggest that all public programs are appropriate and operatingefficiently. The argument that public programs have made an importantcontribution is consistent with a recognition of low standards and a potentialfor considerable improvement. The argument simply is that enough was done <strong>to</strong>help lift living standards and that changes have been positive.20 The Contribution of <strong>Australian</strong> <strong>Aid</strong> <strong>to</strong> Papua New Guinea’s Development 1975–2000
3.5 Implications for <strong>Aid</strong>To summarise the tentative findings so far, quantitative analysis of the sourcesof development is precluded by a shortage of reliable data. But because thesedevelopment gains are <strong>to</strong> an extent dependent on the quality of public services,it appears reasonable <strong>to</strong> attribute at least some of the improvements <strong>to</strong> effectivepublic programs. The tentative conclusion is that the steady gains indevelopment in the face of a stable level of real income and governmentexpenditure are indicative of good returns on public programs.To explain the role of aid, it is necessary <strong>to</strong> understand the potential contributionof government expenditure (because most aid programs are channelled throughthe budget). Unfortunately it is difficult <strong>to</strong> establish a clear message from theaggregate data on government expenditure used in this rapid assessment.Nonetheless, the documentation of the <strong>Australian</strong> aid programs, such as forexample contained elsewhere in this report provides confidence that aidactivities have been useful. If it is reasonable <strong>to</strong> conclude that public programsgenerally have generated meaningful development returns, and this reportconcludes this is the case, then it also appears reasonable <strong>to</strong> conclude that<strong>Australian</strong> aid has generated meaningful development returns.It follows that aid can be seen <strong>to</strong> have made a significant contribution <strong>to</strong>alleviating poverty. A detailed analysis of the poverty situation in Papua NewGuinea is beyond the scope of this rapid assessment. But the improvement inkey social indica<strong>to</strong>rs has an important message. Internationally, education andhealth are important dimensions of the poverty problem, and recent povertyresearch confirms this is also the case in Papua New Guinea. So theimprovements made over time <strong>to</strong> the standard of education and health arelikely <strong>to</strong> have eased poverty over time.Papua New Guinea’s main shortcoming has been in terms of growth. Overallthe growth that has been seen is mainly attributable <strong>to</strong> population growth andon a per capita basis there has been little or no growth. <strong>Aid</strong> may have played arole in preventing a worse outcome, but it cannot claim <strong>to</strong> have achievedgrowth. It appears that despite improvements <strong>to</strong> human capital, the country’seconomic potential has been constrained by the poor policy and institutionalenvironment and limited public infrastructure. In this respect the shift in<strong>Australian</strong> aid <strong>to</strong>wards governance orientated activities is potentially importantfor relieving what appears <strong>to</strong> be one of the key constraints <strong>to</strong> growth.<strong>Australian</strong> aid has offered both potential positives and negatives for incomelevels and growth in Papua New Guinea. The transfer of income from Australia<strong>to</strong> Papua New Guinea provides a direct boost <strong>to</strong> economic activity by liftinglocal expenditure. The multiplier effects that arise as the money is spent in theThe Contribution of <strong>Australian</strong> <strong>Aid</strong> <strong>to</strong> Papua New Guinea’s Development 1975–2000 21
economy, and any productivity gains arising from improved human or physicalcapital, will also tend <strong>to</strong> keep income higher than it otherwise would be.But <strong>Australian</strong> aid has also had a negative effect on income levels because itcontributed <strong>to</strong> a ‘dutch disease’ type effect by supporting a higher realexchange rate than in the absence of the aid (see Box 3.1). This in turn has hadadverse competitiveness and income effects for agriculture in particular.Recognition of this problem was one of the fac<strong>to</strong>rs motivating the shift frombudget <strong>to</strong> program support. The full cost of this ‘dutch disease’ effect is unclear,in part because the economy is still adjusting <strong>to</strong> the removal of the imbalancesthat were created.This means it cannot be said whether the positives offered by <strong>Australian</strong> aid forincome levels and growth did outweigh the negatives. What is clear is thataction has been taken <strong>to</strong> reduce the negative effect on growth in the future.BOX 3.1 THE DUTCH DISEASE IN PAPUA NEW GUINEAInternationally the ‘dutch disease’ problem is normally faced when large exportrevenue from enclave-type resource projects raise the demand for local currency andleads <strong>to</strong> a higher exchange rate than would otherwise be the case (this can see thereal exchange rate appreciate relative <strong>to</strong> what it would otherwise be). This is aproblem because it reduces the international competitiveness of other sec<strong>to</strong>rs,normally export-focused agricultural activities and import-competing activities suchas local food production. The result is that enclave-type resource projects canindirectly take place at the expense of other forms of activity.In the Papua New Guinea context, much of the export revenue from the mining andoil sec<strong>to</strong>rs remains permanently offshore and does not flow through the foreignexchange market. But the payment of taxes and, <strong>to</strong> a lesser extent, local costsprovides a large inflow of foreign exchange. This has had the effect of lifting thedemand for kina in the foreign exchange market (as the Government etc seeks <strong>to</strong> sellits foreign exchange) and combined with other fac<strong>to</strong>rs leading <strong>to</strong> a higher real valueof the kina than would otherwise have applied.In Papua New Guinea the inflow of revenue from the mining and oil sec<strong>to</strong>rs has alsobeen supplemented by a large inflow of donor funds from the international donorcommunity, notably the budget support of Australia. This inflow of foreign exchange hasadded <strong>to</strong> the dutch disease problem by also providing support for the exchange rate. 33 See <strong>AusAID</strong> (1999), Duncan et. al. (1998), Fallon et.al. (1995) and King and Sugden (1996) for recentdiscussion of the dutch disease problem in Papua New Guinea. The problem has been acknowledged for atleast 20 years, with Garnaut and Baxter (1984), Jarrett and Anderson (1989) and Goodman, Lepani andMorawetz (1987) providing good discussion of early thinking on the issue.22 The Contribution of <strong>Australian</strong> <strong>Aid</strong> <strong>to</strong> Papua New Guinea’s Development 1975–2000
Although the precise extent of the dutch disease problem is somewhat unclear, asense of the potential impact is provided by the large fall in the nominal value of thekina in recent years. Since the kina was floated in Oc<strong>to</strong>ber 1994, it has been on adownward trend attributable <strong>to</strong> declining mining and oil revenue, the gradual removalof <strong>Australian</strong> budget support and large Government budget deficits. At the time ofthe float, the kina was roughly at parity with the US$. Such a high exchange rate hasproven unsustainable and the kina is now worth around a quarter of its pre-floatvalue in US$ terms. 4It is important <strong>to</strong> appreciate that the dutch disease problem in Papua New Guinea couldhave been largely avoided. The original intention of the Government was that revenuefrom the mining and oil sec<strong>to</strong>r was <strong>to</strong> be saved in the Mineral Resource StabilisationFund (the MRSF). While positive account balances were recorded over the 1990s, these‘savings’ were only book entries and budget deficits meant that the Governmentactually quickly spent the mining and oil revenue. If instead the mining and oil revenuehad been saved and spent gradually as originally intended, the effect on the exchangerate and hence non-mining and oil sec<strong>to</strong>rs would have been much less.So in one sense the dutch disease problem evident in Papua New Guinea is best seenas a result of how the Government used the mining and oil revenue, rather thanmining and oil activity per se. The large inflow of aid has also been an importantcontribu<strong>to</strong>r <strong>to</strong> the problem. It follows that the dutch disease problem is best though<strong>to</strong>f as a result of the public sec<strong>to</strong>r rather than the mining and oil projects alone.As a result of a decline in mining and oil revenue and the removal of <strong>Australian</strong>budget support, the economy is now facing the effects of an unwinding of a ‘dutchdisease’ problem that has seen the public sec<strong>to</strong>r undermine prospects for the privatesec<strong>to</strong>r for much of the period since independence. 5 This is triggering economicchanges that are creating problems for many in the community, notably in the urbancentres reliant on formal economic activity. This is frequently described as a crisis,and is seen by some as evidence of a failing state. But the changes are also creatingopportunities for others, notably for the rural poor and the informal sec<strong>to</strong>r. Over time,the changes triggered by a falling kina can be expected <strong>to</strong> see a sustainable economyemerge providing for improved growth and poverty outcomes. While the adjustmentnow occurring could certainly be managed at a lower cost (if for example theGovernment controlled overspending and provided well maintained physicalinfrastructure), it offers important benefits for the long term.4 It is emphasised that the fall in the nominal value of the kina is also in part a result of over-expenditure bythe National Government. Had the National Government operated balanced budgets and not the large deficitsseen over the last ten years, the nominal value of the kina would be considerably higher than at present(see Sugden (2002) for a discussion).5 See Sugden (2000).The Contribution of <strong>Australian</strong> <strong>Aid</strong> <strong>to</strong> Papua New Guinea’s Development 1975–2000 23
4 THE CHANGING FOCUS OF AUSTRALIAN AIDSINCE 1975This section of the report aims <strong>to</strong> trace the his<strong>to</strong>ry of Australia’s aid assistance<strong>to</strong> Papua New Guinea since independence (1975) and, where information isavailable, Section 5 assesses the impact of that assistance on Papua NewGuinea’s development. To do this, it is necessary <strong>to</strong> understand the fundamentalshifts that have occurred in the aid relationship over the years. It is notappropriate <strong>to</strong> judge the impact of aid provided ten or more years ago againstcurrent objectives and priorities. Impacts, both positive and negative, need <strong>to</strong>be placed in the context of <strong>Australian</strong> and Papua New Guinean government aidpolicies, objectives and strategies at the time the aid was programmed anddelivered. Also, it should be noted that this analysis is restricted <strong>to</strong> informationthat is publicly available, in particular <strong>AusAID</strong>’s project completion reports,project and sec<strong>to</strong>r reviews and evaluations, and activity moni<strong>to</strong>ring briefs. Theconclusions drawn from this information are intended <strong>to</strong> form the first step in alonger-term process aimed at improving the performance information availablein <strong>AusAID</strong> <strong>to</strong> assess the effectiveness and impact of <strong>Australian</strong> assistance onPapua New Guinea’s development.4.1 Political ContextAustralia has consistently been Papua New Guinea’s largest developmentpartner. Since it attained independence in 1975, Australia has provided morethan A$14 billion 6 in real terms (A$8.1 billion in nominal terms) as officialdevelopment assistance <strong>to</strong> Papua New Guinea. 7 In 1975–76, Australia’s aid <strong>to</strong>Papua New Guinea accounted for 60% of the overall <strong>Australian</strong> aid budget.Today, it still accounts for about 20%, and Papua New Guinea remains thelargest of Australia’s bilateral aid programs.<strong>Australian</strong> aid was crucially important for the Papua New Guinea economy atthe time of independence, accounting for 41.4% of central government’sexpenditure in 1974–75 8 . Based on Australia’s his<strong>to</strong>rical relationship with PapuaNew Guinea and its responsibilities under the United Nations Charter, Australiaassured Papua New Guinea in 1974 that it would have first call on Australia’said program after independence. Although successive reviews of Australia’s aid6Constant 2001–02 prices, covering expenditure from 1975-76<strong>to</strong> 2001-02 inclusive.7 All expenditure figures used in this report have been compiled from project-level expenditure data reportedin Australia’s Overseas <strong>Aid</strong> Program Statistical Summary (“the blue book").8 Australia’s Overseas Development Assistance 1975–76, Budget Paper No. 10, <strong>Australian</strong> GovernmentPublishing Service, 1975.24 The Contribution of <strong>Australian</strong> <strong>Aid</strong> <strong>to</strong> Papua New Guinea’s Development 1975–2000
program saw a decline in the overall level of <strong>Australian</strong> aid funding forPapua New Guinea in real terms, it was not until the mid-late 1980s that afundamental shift began <strong>to</strong> occur in the nature of the aid relationship betweenAustralia and Papua New Guinea (see Figure 4.1). As part of the 1985 aidagreement, Australia and Papua New Guinea agreed on a gradual reduction inthe <strong>to</strong>tal amount of <strong>Australian</strong> aid funding provided each year of at least3% per annum in real terms, combined with a gradual reduction in budgetsupport and an increase in programmed assistance.Figure 4.1 Composition of <strong>Australian</strong> Assistance <strong>to</strong> Papua New Guinea, 1975 <strong>to</strong> 2002350.0300.0250.0200.0150.0100.0Budget SupportOther UnprogrammableProgram AssistanceEmergency Relief50.0075–7677–7879–8081–8283–8485–8687–8889–9091–9293–9495–9697–9899–0001–02Financial YearSource:Australia’s Overseas <strong>Aid</strong> Program Statistical Summary, <strong>AusAID</strong>, Canberra (various editions)One of the most significant changes in the bilateral relationship occurred inDecember 1987, with the signing by both heads of government of the JointDeclaration of Principles Guiding Relations Between Australia and Papua NewGuinea. The Declaration was a watershed in the bilateral relationship, shifting itfrom the post-colonial phase of giving aid and advice <strong>to</strong> a more mature phase inwhich the relationship is based on reciprocity and recognition of mutual benefitsbetween independent and equal nations. Embodied in the Declaration isAustralia’s commitment <strong>to</strong> an approach based on constructive commitment,respect for the sovereignty and independence of Papua New Guinea, and supportwith advice and assistance for the decisions taken by Papua New Guinea aboutits future. A key element was the mutual aim <strong>to</strong> move aid away from the centreof the bilateral relationship. Accordingly, the first comprehensive Treaty onDevelopment Cooperation, signed in 1989, reaffirmed Australia’s continuedcommitment <strong>to</strong> assisting Papua New Guinea’s development and security andrecorded the principle of progressive declines in overall aid levels, accompaniedby a progressive shift from budget support <strong>to</strong> programmed aid.The Contribution of <strong>Australian</strong> <strong>Aid</strong> <strong>to</strong> Papua New Guinea’s Development 1975–2000 25
The second and current Treaty came in<strong>to</strong> effect in July 2000, following thecessation of budget support in June 2000. It provides the framework for currentand future <strong>Australian</strong> aid <strong>to</strong> Papua New Guinea. It establishes ceilings on thelevel of <strong>Australian</strong> aid funding and ensures the aid program will continue <strong>to</strong>focus on helping <strong>to</strong> reduce poverty and promote sustainable growth. The newTreaty also specifies generic and sec<strong>to</strong>r-specific performance targets andbenchmarks. Performance against these benchmarks is reviewed and assessedannually, and will be used <strong>to</strong> determine the type and volume of future<strong>Australian</strong> assistance. This is the first time such an approach has been taken inthe <strong>Australian</strong> aid program.4.2 Budget SupportMore than two-thirds (A$9.3 billion) of <strong>Australian</strong> aid <strong>to</strong> Papua New Guineasince independence has been provided in the form of untied budget supportgrants. Although budget support was seen in the early years as providingnecessary aid assistance, while giving Papua New Guinea management controlover decision-making, by 1980 there were emerging concerns in bothgovernments. The availability of budget support acted as a disincentive for PapuaNew Guinea <strong>to</strong> take difficult economic decisions in the interests of equitablegrowth, and little effort was made <strong>to</strong> diversify the Papua New Guinea economy.There were various ‘false starts’ in the combined effort <strong>to</strong> reduce Papua NewGuinea’s reliance on budget support grants. Until the late 1980s, each attempt<strong>to</strong> reduce budget support was softened in response <strong>to</strong> different external shocksand internal difficulties facing Papua New Guinea. These decisions were basedvery much on the special relationship between Australia and Papua NewGuinea, rather than real need. Whilst the economic problems confronting PapuaNew Guinea were certainly real, the situation was not desperate, and it wasrecognised at the time that there was much Papua New Guinea itself could havedone <strong>to</strong> manage its economic problems (eg, reducing new expenditure; usingtied, concessional assistance from other sources; and relaxing the “hard kina"policy). Not surprisingly, the Papua New Guinea government had never beenkeen <strong>to</strong> bring these options in<strong>to</strong> play (or <strong>to</strong> accept programmed assistance) forfear of jeopardising Australia’s <strong>to</strong>tally unconditional budget support grants.The final decision <strong>to</strong> phase out budget support 9 was not taken lightly, and wasthe subject of significant debate in both countries. In Papua New Guinea, thedesire for genuine self-reliance competed with the attraction of assured,unconditional funding. In Australia, some questioned Papua New Guinea’sability <strong>to</strong> adjust <strong>to</strong> programmed assistance, and there was reluctance <strong>to</strong> risk9 Encapsulated in the first Treaty on Development Cooperation, 1989.26 The Contribution of <strong>Australian</strong> <strong>Aid</strong> <strong>to</strong> Papua New Guinea’s Development 1975–2000
criticism that the withdrawal of <strong>Australian</strong> budget support might be blamed forcausing any future decline in the economy or law and order situation. In theend, both countries agreed that a <strong>to</strong>ugh decision on the level and form of<strong>Australian</strong> aid was necessary <strong>to</strong> stimulate difficult decisions in Papua NewGuinea in the interest of sustainable development. In particular, reduced andclosely targeted <strong>Australian</strong> aid was acknowledged as being critical <strong>to</strong> enablePapua New Guinea’s leaders <strong>to</strong> obtain essential support for economic and socialreforms, thus accelerating growth. A seven-year, straight line phasing out ofbudget support commenced in 1994–95, with untied budget support ceasing <strong>to</strong>be used as a form of assistance in Australia’s aid program in June 2000.Although the impact of Australia’s budget support on development cannot beassessed directly because the grants were channelled directly in<strong>to</strong> Papua NewGuinea’s budget – and it will always be possible <strong>to</strong> debate whether budgetsupport was the most effective instrument <strong>to</strong> use from the outset of independence– there was a clear rationale for budget support at the time. It was Papua NewGuinea’s preferred form of support, enabling the new nation <strong>to</strong> set its owndevelopment priorities without interference from its former administeringauthority. Budget support contributed significantly <strong>to</strong> political, economic andsocial stability after the rapid transition <strong>to</strong> independence, and helped bridge theresource gap between Papua New Guinea’s high investment requirements and itslow domestic savings. It was flexible, easy <strong>to</strong> administer, and imposed no debt onPapua New Guinea. Also, analysis of the Papua New Guinea Government’s ownfunding for different sec<strong>to</strong>rs confirms that government funding for key sec<strong>to</strong>rssuch as infrastructure, health and education was higher when Papua New Guineawas receiving budget support than in more recent times. This would suggest that<strong>Australian</strong> budget support was an important element in the higher levels ofservice delivery that existed at the time in various sec<strong>to</strong>rs.4.3 Evolving Aapproaches <strong>to</strong> Programmed AssistanceOver the 14-year period from 1975 <strong>to</strong> 1989, programmed assistance accountedfor only 2.7% of <strong>to</strong>tal <strong>Australian</strong> aid funding <strong>to</strong> Papua New Guinea. Bycontrast, programmed assistance has accounted for 45.5% of <strong>Australian</strong> aidfunding over the subsequent 14 years (1990 <strong>to</strong> 2003). During the earlier period,almost all <strong>Australian</strong> aid funding was provided either as untied budget support,other fixed costs such as the payment of termination and retirement benefitentitlements <strong>to</strong> officers of pre-Independence administrations, or reactivehumanitarian assistance <strong>to</strong> address the consequences of natural disasters.Australia’s capacity <strong>to</strong> assist in meeting Papua New Guinea’s prioritydevelopment needs was largely limited <strong>to</strong> its ongoing policy dialogue with thePapua New Guinea Government.The Contribution of <strong>Australian</strong> <strong>Aid</strong> <strong>to</strong> Papua New Guinea’s Development 1975–2000 27
Although there were many reasons for the joint desire <strong>to</strong> reduce budgetsupport, a key reason for the parallel increase in programmed assistance was <strong>to</strong>allow more effective targeting of <strong>Australian</strong> assistance <strong>to</strong> areas of priorityneed, in support of Papua New Guinea’s own development objectives. Annex Aseeks <strong>to</strong> capture some of the flavour of changing emphases in aid programpriorities in Papua New Guinea, summarising the main objectives andstrategies, as well as the catalysts for them.As the volume of available programmed assistance increased during the 1990s,the areas prioritised for <strong>Australian</strong> support were influenced by drastic changesthat occurred in Papua New Guinea’s own circumstances. The financial crisisand Rabaul volcano eruptions of 1994, the need <strong>to</strong> res<strong>to</strong>re peace and providewelfare support on Bougainville, serious drought and frosts in 1997–98, andthe impacts of the Asian financial crisis of 1997, exacerbated the country’salready enormous development challenges through the 1990s. Prior <strong>to</strong> this,Papua New Guinea had managed its economy reasonably well sinceindependence and had achieved development progress. 10When programmed assistance was introduced in 1986, Papua New Guinea’spriority areas for <strong>Australian</strong> assistance sought <strong>to</strong> accelerate progress <strong>to</strong>wardsself-reliance. Early assessments indicated that the shift from budget support <strong>to</strong>programmed assistance was generating significant benefits for both countries,improving both the effectiveness of <strong>Australian</strong> aid and its broader impact onhelping Papua New Guinea overcome key constraints <strong>to</strong> self-reliance – the lackof educated people and scarcity of capital. 11 However, as successivegovernments struggled <strong>to</strong> deal with growing economic and social problems inthe 1990s, it became clear that governance and institutional capacityconstraints posed the main challenges <strong>to</strong> achieving self-reliance. Futuredevelopment progress would depend on strong leadership, integrity andtransparency of decision-making, rigorous prioritisation of public investment,and a skilled, efficient and incorruptible public service. Priority in Australia’said efforts since about 1997 has been given <strong>to</strong> helping Papua New Guineaachieve economic stability and social cohesion.In 1995, both governments agreed that performance benchmarks would beintroduced <strong>to</strong> moni<strong>to</strong>r reforms crucial <strong>to</strong> the success of jointly programmedaid. 12 A review of performance against these benchmarks at the September 199610 One Clear Objective: Poverty Reduction Through Sustainable Development, Report of the Committee of Reviewof Australia’s Overseas <strong>Aid</strong> Program, Commonwealth of Australia, April 1997.11 Joint Parliamentary Committee on Foreign Affairs, Defence and Trade Inquiry in<strong>to</strong> Australia’s Relations withPapua New Guinea: Development Cooperation, <strong>Australian</strong> International Development Assistance BureauSubmission, August 1989.12 Benchmarks for 1996 were agreed for the health, education, infrastructure and forestry sec<strong>to</strong>rs.28 The Contribution of <strong>Australian</strong> <strong>Aid</strong> <strong>to</strong> Papua New Guinea’s Development 1975–2000
Ministerial Forum found that real progress had been made in improvingplanning for service delivery, especially in health and education. Also, in 1997,for the first time, Australia’s aid contribution was incorporated in<strong>to</strong> Papua NewGuinea’s development budget. This introduced transparency, clarifying forPapua New Guinea’s citizens the areas in which <strong>Australian</strong> assistance wassupporting the country’s development. It also allowed Papua New Guinea <strong>to</strong>integrate Australia’s aid in<strong>to</strong> its own development plans.As Papua New Guinea’s absorptive capacity has improved in different areas,Australia’s programmed assistance has also evolved since the early 1990s. Fromtraditional project assistance, Australia moved <strong>to</strong> a program approach <strong>to</strong> aiddelivery in sec<strong>to</strong>rs such as infrastructure, using local contrac<strong>to</strong>rs <strong>to</strong> helpimplement rolling programs of road maintenance. The health sec<strong>to</strong>r, probablythe most advanced in this process <strong>to</strong>day, is now adopting a sec<strong>to</strong>r-wideapproach, led by Papua New Guinea, ultimately involving the pooling of alldonor resources <strong>to</strong> support the National Health Plan. More broadly, Australia isnow providing substantial support for an Incentive Fund, explicitly focused onsupporting organisations that demonstrate excellence and financialaccountability <strong>to</strong> deliver community and public services.Although Papua New Guinea's ability <strong>to</strong> be fully effective as a nation is seriouslychallenged by its constraints <strong>to</strong> development, and much needs <strong>to</strong> be done <strong>to</strong>consolidate a sense of nationhood before governments will truly be heldaccountable for service delivery, this sort of evolution in the form of <strong>Australian</strong>assistance does show a gradual strengthening of Papua New Guinea’s sense ofownership of development programs. Over time, aid that is effectively integratedwith Papua New Guinea’s own programs will help build capacity at all levels ofprogram formulation, delivery, moni<strong>to</strong>ring and review within Papua New Guinea.Australia’s assessment in 2000 was that the shift <strong>to</strong> programmed assistance had:“…gone a significant way <strong>to</strong> making <strong>Australian</strong> aid more effective, transparentand accountable. The move has also resulted in a more cooperative approach <strong>to</strong>planning and implementing aid activities, which has strengthened personal andinstitutional links between Australia and Papua New Guinea." 13With the ageing of the World War II generation, the level of interest aboutPapua New Guinea within Australia had been declining. Australia’s shift <strong>to</strong>programmed assistance has helped <strong>to</strong> revive the level of close personal contactsbetween Australia and Papua New Guinea.13 Papua New Guinea Program Profiles 1999–2000, <strong>AusAID</strong>, February 2000.The Contribution of <strong>Australian</strong> <strong>Aid</strong> <strong>to</strong> Papua New Guinea’s Development 1975–2000 29
4.4 Involving Other DonorsPapua New Guinea, more than most developing countries, has consistentlyrelied on a single donor – Australia – for its development assistance financing.Until 1982, <strong>Australian</strong> budget support alone accounted for some 95% of theforeign grants received by Papua New Guinea. 14 By 1987–88, it still accountedfor 80% of Papua New Guinea’s <strong>to</strong>tal aid receipts. 15 At that time, in tandemwith the fundamental shift in the nature of the aid relationship that had beenagreed by the two governments, it was envisaged that other donors wouldgradually start <strong>to</strong> play an increasing role in Papua New Guinea’s development.Papua New Guinea invited the World Bank <strong>to</strong> establish a Consultative Group,and the inaugural meeting held in May 1988 succeeded in achieving broaderinternational support for Papua New Guinea’s development strategies. Althoughsubsequent meetings of the Consultative Group have stimulated an expansionand diversification of the country’s aid sources, Papua New Guinea <strong>to</strong>dayremains heavily reliant on <strong>Australian</strong> aid, which currently accounts for about72% of its <strong>to</strong>tal bilateral aid. Japan is the next largest bilateral aid donor.Multilateral institutions such as the Asian Development Bank (ADB), the WorldBank, the United Nations (UN), and the European Union (EU) also providesubstantial support.External resources can best assist economic growth, poverty alleviation andbroad development if domestic economic policies in the recipient country aresupportive. Accordingly, <strong>AusAID</strong> has devoted considerable resources <strong>to</strong> researchand analysis <strong>to</strong> strengthen the policy dialogue between Australia and PapuaNew Guinea, particularly since 1990. It was the first <strong>Australian</strong> bilateral aidprogram <strong>to</strong> invest heavily in policy research and analysis, an initiative intended<strong>to</strong> provide practical support for the changing nature of the developmentpartnership between the two countries articulated in the 1987 Joint Declarationof Principles. These analytical reports are still regarded as the best informationproduced internationally in relation <strong>to</strong> Papua New Guinea, and wereinstrumental in engaging other donors in Papua New Guinea’s development.These efforts <strong>to</strong> broaden Papua New Guinea’s base of external finance andadvice have lost momentum in recent years. The last Consultative Groupmeeting was held in November 1999. This has been unfortunate, coincidingwith a period in Papua New Guinea’s development when the country hasprobably most needed the coordinated support of a cohesive body of donors.The independent aid policy priorities and programming and delivery processesof each donor (including Australia) have added <strong>to</strong> the complexity of aid14 Desk Study: Papua New Guinea (Literature Review), <strong>AusAID</strong>, May 1984.15 Australia’s Overseas <strong>Aid</strong> Program 1987–88, Budget Related Paper No. 4, <strong>Australian</strong> Government PublishingService, 1987.30 The Contribution of <strong>Australian</strong> <strong>Aid</strong> <strong>to</strong> Papua New Guinea’s Development 1975–2000
management for Papua New Guinea, over-burdening the already limitedcapacity that exists within government and, at times, diverting Papua NewGuinea’s resources away from its own development policy priorities.Australia, ADB and the World Bank have now initiated a working group <strong>to</strong>examine the viability of developing and implementing a joint countryassistance strategy for their assistance in Papua New Guinea. The intention is <strong>to</strong>develop a joint focus on helping Papua New Guinea address its highest prioritychallenges at the central, sec<strong>to</strong>ral, and provincial levels, if possible integratingboth requirements and processes for policy and analytical work, operationaldelivery, and moni<strong>to</strong>ring and review. To work, this initiative will depend onstrong ownership by Papua New Guinea and should incorporate as many otherdonors as possible. It is the first time this depth of aid coordination has beenattempted internationally, and will require fundamental changes in the waydonors ‘do business’ in Papua New Guinea. Nevertheless, it has the potential <strong>to</strong>yield significant benefits for Papua New Guinea, in enabling the country <strong>to</strong>drive a sustainable development agenda, and actually deliver against higherorder development objectives rather than simply achieve piecemeal progresswithin narrowly defined activities.4.5 Sec<strong>to</strong>ral PrioritiesFigure 4.2 summarises the sec<strong>to</strong>ral composition of <strong>Australian</strong> programmedassistance in Papua New Guinea since independence.Figure 4.2 Sec<strong>to</strong>ral Composition of <strong>Australian</strong> Programmed Assistance <strong>to</strong> Papua NewGuinea, 1975 <strong>to</strong> 20025%1%10%27%EducationInfrastructureGovernance12%HealthNatural ResourcesCivil SocietyDonor Administration21%24%Source:Australia’s Overseas <strong>Aid</strong> Program Statistical Summary, <strong>AusAID</strong>, Canberra (various editions)The Contribution of <strong>Australian</strong> <strong>Aid</strong> <strong>to</strong> Papua New Guinea’s Development 1975–2000 31
When programmed assistance was introduced in 1986, Papua New Guinea’spriority areas for <strong>Australian</strong> assistance were aimed at accelerating progress<strong>to</strong>wards self-reliance:• Revenue generation;• Institution strengthening for key economic departments;• Technical assistance for state enterprises; and• Management development in the health, works, police and justicedepartments.The first Treaty Review (1992) identified six priority areas for the sec<strong>to</strong>ral focusof <strong>Australian</strong> aid: health, education and training, transport and communication,renewable resources, law and justice, and the private sec<strong>to</strong>r. Since then,programs targeting governance and rehabilitation on Bougainville wereintroduced, along with expanded and more targeted programs in traditionalareas of <strong>Australian</strong> assistance, such as basic education, maintenance oftransport infrastructure and primary health. Since July 2000 under the secondTreaty, the <strong>to</strong>tal <strong>Australian</strong> aid program ($300 million per annum) has beenapplied <strong>to</strong> programmed assistance activities, and is focused on four agreedobjectives:• Strengthening governance;• Improving social indica<strong>to</strong>rs;• Building prospects for sustainable economic growth; and• Consolidating the peace process in Bougainville.The agreed priority sec<strong>to</strong>rs for future <strong>Australian</strong> assistance continue <strong>to</strong> includebasic education, primary health, maintenance of infrastructure, ruraldevelopment, and law and justice, but now also include a significant focus ongovernance and on development of the provinces.New and flexible operational strategies are being adopted across <strong>AusAID</strong>’sprogram, aimed at increasing the level of Papua New Guinean participation inaid activities, reducing complexity, strengthening performance benchmarks, andlinking performance more closely <strong>to</strong> funding decisions. An Incentive Fund hasbeen established, for example, which enables Australia and Papua New Guinea<strong>to</strong> direct <strong>Australian</strong> aid through the most capable Papua New Guinea agencies.The Fund aims <strong>to</strong> promote contestability among service providers by fundingagencies (inside and outside government) with a proven track record of goodprogram management or policy reform.32 The Contribution of <strong>Australian</strong> <strong>Aid</strong> <strong>to</strong> Papua New Guinea’s Development 1975–2000
5 THE IMPACT OF AUSTRALIAN AID INPAPUA NEW GUINEAAlthough aid will never be the primary determinant of development progress inan independent nation such as Papua New Guinea, it plays a strategic role inhelping <strong>to</strong> reduce poverty, improve quality of life, promote equity, and buildmanagement capacity <strong>to</strong> enable the government <strong>to</strong> influence developmentprogress through effective policies and service delivery. As noted earlier, Australiahas consistently been Papua New Guinea’s most significant donor sinceindependence, both in terms of the volume of aid and the breadth of coverage ofits assistance. While the lack of data makes firm conclusions difficult, the sec<strong>to</strong>ralassessment in this section supports the trends identified in Section 3. In essence,it is fair <strong>to</strong> conclude that <strong>Australian</strong> aid has genuinely been responsive <strong>to</strong> PapuaNew Guinea’s own development needs and priorities. It has been appropriatelytargeted <strong>to</strong> prevailing circumstances in Papua New Guinea, while also generallyensuring appropriate focus on longer-term objectives for self-reliance andsustainable development. At a sec<strong>to</strong>ral level there are important examples of thepositive impacts of <strong>Australian</strong> aid and, across most of the key sec<strong>to</strong>rs, <strong>Australian</strong>aid has been a major influence on Papua New Guinea’s developmentachievements <strong>to</strong> date. Anecdotally at least, Australia’s support has beeninstrumental in helping Papua New Guinea <strong>to</strong> achieve what development progressit has, maintain a vibrant and relatively stable democracy post-independence, andstem the declines occurring in basic service delivery.5.1 EducationThe education sec<strong>to</strong>r has consistently accounted for at least 25% of Australia’sprogrammed assistance in Papua New Guinea, with funding <strong>to</strong>talling almostA$540 million since independence. 16 More than half of this has supportededucation at the elementary, primary and secondary levels. Australia has alsoconsistently been the largest provider of tertiary scholarships for Papua NewGuinea, with about 100 students graduating each year from tertiary institutionsin Australia, and up <strong>to</strong> 150 new places now being offered each year. <strong>AusAID</strong>funding has helped <strong>to</strong> upgrade several provincial high schools, suppliededucational materials <strong>to</strong> selected primary schools, supported the training ofelementary teachers, established a vocationally-oriented trade testingcertification system, developed a program for lecturers at the CommunityTeachers College and helped improve the Department of Education’s capacity <strong>to</strong>plan and moni<strong>to</strong>r its education reform agenda.16At least a further A$80 million has been provided for other sec<strong>to</strong>r-specific training (eg: in health,governance, infrastructure and renewable resources).The Contribution of <strong>Australian</strong> <strong>Aid</strong> <strong>to</strong> Papua New Guinea’s Development 1975–2000 33
Australia’s funding support has increased significantly in recent years, and itappears this support for Papua New Guinea's education reform process ishaving a positive impact. With an estimated 80% of the government’s ownbudget being spent on teachers’ salaries since the mid 1990s, Australia has beenfunding the vast majority of costs associated with implementing the educationreform agenda. <strong>AusAID</strong>’s education sec<strong>to</strong>r expenditure over the last four yearshas averaged more than A$68 million per year, almost double the averageannual expenditure of the previous four years. Enrolments in the first eightyears of school have increased by over 100,000 in the last three years. Studentretention rates and the number of students going on <strong>to</strong> higher institutions havealso increased. There is an increased number of qualified teachers and schoolsin Papua New Guinea.Based on the outputs and achievements listed in Box 5.1, it is fair <strong>to</strong> concludethat <strong>Australian</strong> aid has had a significant positive influence on improving access<strong>to</strong> education, enhancing the quality of education, and building and maintainingcapacity and momentum for reform within the education sec<strong>to</strong>r in PapuaNew Guinea.BOX 5.1 EDUCATION SECTOR ACHIEVEMENTS OF AUSTRALIAN ASSISTANCEAccessIn the past ten years the numbers of children attending school has almost doubled,from 510,000 in 1992 <strong>to</strong> an estimated 1 million in 2002. <strong>AusAID</strong> support has played akey role in this achievement:• Provided elementary education opportunities for about 270,000 pupils in some4,200 schools, learning in 200 of <strong>PNG</strong>'s 800 languages. Ten years ago there wereno elementary schools in <strong>PNG</strong> and all children started school in English. A numberof sources indicate that <strong>AusAID</strong> is certainly the most significant if not the onlydonor in this area.• Increased the number of teachers trained from 600 <strong>to</strong> 1,000 per annum.• Physically upgraded 240 primary schools.• Provided scholarships for about 2,000 secondary students <strong>to</strong> study in Australia.• Upgraded 9 high schools in <strong>PNG</strong> so that Grade 11–12 enrolments could beincreased from 1,000 per annum (1993) <strong>to</strong> about 5,000 per annum (2002).• Achieved a gradual increase in the proportion of girls enrolled in secondaryschool. The participation rate of girls in Grade 10 has increased from 36% in 1985and 1990 through <strong>to</strong> 41% in 1998.• Provided up <strong>to</strong> 150 tertiary scholarships each year for study in Australia. A recentstudy found that over 80% of former scholarship recipients reported improvedconfidence, new and improved competencies, and innovative approaches <strong>to</strong> work.34 The Contribution of <strong>Australian</strong> <strong>Aid</strong> <strong>to</strong> Papua New Guinea’s Development 1975–2000
• Improved retention rates at school through curriculum development andmaterials supply.Quality• Successfully introduced and expanded the elementary school system, includingdevelopment of multigrade policy and teaching materials.• Improved the relevance of education at elementary level through support forvernacular language in community schools.• Improved the quality of language and mathematics training at elementary level.• Improved the quality of primary education through skills transfer, production anddistribution of new learning materials, provision of textbooks, teacher training,and support for the introduction of a life-skill-based curriculum <strong>to</strong> replace the oldacademic <strong>Australian</strong>-based curriculum.• Improved the relevance of secondary education by introducing life skills in<strong>to</strong> thecurriculum.• Provided essential textbooks <strong>to</strong> 272 secondary schools.• Improved the quality of teacher education – over 80% of primary teachers arenow grade 12 graduates, rather than grade 10.• Introduced competency based training in 7 core trades, establishing theframework and skills <strong>to</strong> expand <strong>to</strong> other trades.• Increased the relevance of technical and vocational training by linkingcompetencies <strong>to</strong> industry needs.• Encouraged gender equity (eg, gender equity curriculum materials and training).• Established twinning arrangements between the University of Goroka, QueenslandUniversity of Technology and the Charles Sturt University.Maintaining Impetus and Capacity for Reform• Introduced innovation in piloting many aspects of the reform agenda (eg,developed and tested new curriculum and teaching materials).• Enhanced capacity <strong>to</strong> implement and maintain significant aspects of the reformagenda (eg, establishing, training and facilitating the work of key new unitscentral <strong>to</strong> the implementation of the reform agenda).• Strengthened the professional and technical skills of staff in the Department ofEducation and improved linkages between the Department and provincialeducation units.The Contribution of <strong>Australian</strong> <strong>Aid</strong> <strong>to</strong> Papua New Guinea’s Development 1975–2000 35
5.2 GovernanceFormal targeting of governance as a key sec<strong>to</strong>r for <strong>Australian</strong> assistance inPapua New Guinea really only commenced in 1997, following Australia’sacceptance of the Simons Review recommendations in this regard. Prior <strong>to</strong> this,the vast bulk of Australia’s assistance <strong>to</strong> improve governance in Papua NewGuinea was focused on the law and justice sub-sec<strong>to</strong>r, particularly the policeforce. Since then, Australia’s efforts have intensified in support of public sec<strong>to</strong>radministration and economic management, as well as in helping develop aneffective judicial and law enforcement system and strengthening systems forthe protection of individual rights and freedoms. 17 Australia is also givingpriority <strong>to</strong> enhancing community awareness and participation, as a means <strong>to</strong>improving government accountability in Papua New Guinea through betterpublic scrutiny of policies and practices.5.2.1 LAW AND JUSTICENotwithstanding the difficult law and order situation (which has numerouscauses external <strong>to</strong> the law and justice sec<strong>to</strong>r), Australia’s support for law andjustice activities in Papua New Guinea has had a range of impacts vital <strong>to</strong>improving governance throughout the country. In <strong>to</strong>tal, Australia has providedmore than A$240 million in assistance <strong>to</strong> strengthen law and justice in PapuaNew Guinea, 68% of which has supported the police force.BOX 5.2 STRENGTHENING THE ROYAL PAPUA NEW GUINEA CONSTABULARY<strong>Australian</strong> project assistance has been provided <strong>to</strong> the Royal Papua New GuineaConstabulary (R<strong>PNG</strong>C) since 1984. Improvement initiatives have reached in<strong>to</strong> everypart of the R<strong>PNG</strong>C and have included substantial institutional strengthening, capacitybuilding, decentralised training, and provision of facilities and equipment. Some keyachievements <strong>to</strong> date, including broader development impacts where separatelyidentifiable, include:• Raised the level of discipline and professionalism in the police force.• Achieved significant management improvements, including in relation <strong>to</strong> seniorpolice executives, human resource management and corporate planning.• Introduced a strategic management system unique <strong>to</strong> the environment of PapuaNew Guinea.• Developed and introduced policies <strong>to</strong> support the advancement of women and thepromotion of equal employment opportunity within the Constabulary, wheredomestic violence is a serious problem.17 Such as the Law Courts, At<strong>to</strong>rney General’s Department, National Judicial Staff Service, Ombudsman’sCommission, and the proposed Human Rights Commission.36 The Contribution of <strong>Australian</strong> <strong>Aid</strong> <strong>to</strong> Papua New Guinea’s Development 1975–2000
• Achieved operational efficiencies in community policing, police prosecution, andfraud investigation.• Improved the national prosecution rate by 9% in five years (1994–1998).• Introduced administrative reforms <strong>to</strong> improve the efficiency and accountability ofbasic police operations.• Provided extensive training (including formal, on-the-job, and overseas workexperience) <strong>to</strong> 20,000 attendees.• Established excellent training facilities at Bomana.• Provided housing for 166 senior and junior staff in strategic locations.• Provided accommodation for women at Bomana Police Training College.• Improved police response times <strong>to</strong> reports of crime and disorder at the BorokoOperations Centre in Port Moresby.• Established Public Complaints Units in major population centres.At the broadest level, the positive impact of this extensive assistance isdemonstrated by the R<strong>PNG</strong>C’s performance during periods of major unrest.While Bougainville stands out as a telling reminder, the Sandline crisis andrecent Papua New Guinea Defence Force and anti-structural reform unrest bothhad the potential <strong>to</strong> spill over in<strong>to</strong> a full constitutional crisis. Through each ofthese crises, the R<strong>PNG</strong>C has maintained its loyalty <strong>to</strong> the State. This is apositive impact that is absolutely fundamental in a country so culturallydiverse and clan-based. Although detailed information has not been availablefor this report <strong>to</strong> analyse the different contributing fac<strong>to</strong>rs, the depth ofinternalisation of what we would call ‘good governance’ principles that musthave occurred <strong>to</strong> achieve this result should not be underestimated.Since 1990, Australia has also provided substantial ongoing support(A$52 million <strong>to</strong> June 2002) <strong>to</strong> strengthen Papua New Guinea’s correctionalservices system. This support has raised the profile of the system, placing i<strong>to</strong>n an equal footing with other law and justice agencies in Papua NewGuinea. It has enhanced management and strategic planning capacity, andintroduced operational efficiencies that are expected <strong>to</strong> be sustainable.Longstanding support for police and correctional services has been broadenedsince the late 1990s <strong>to</strong> incorporate all aspects of the criminal justice andjudicial services systems.The Contribution of <strong>Australian</strong> <strong>Aid</strong> <strong>to</strong> Papua New Guinea’s Development 1975–2000 37
BOX 5.3 STRENGTHENING LAW AND JUSTICE IN PAPUA NEW GUINEAIn addition <strong>to</strong> assisting the Constabulary, <strong>Australian</strong> project assistance has had arange of important positive impacts across the law and justice sec<strong>to</strong>r:• Provided access – for the first time since independence – <strong>to</strong> updated andconsolidated legislation and case law in electronic and paper form, as well as araft of new legal texts.• Enhanced court operations at all levels through professional developmenttraining for all judges and magistrates, as well as for court officers and villagecourt officials.• Strengthened corporate and human resource management in the At<strong>to</strong>rneyGeneral’s Department, resulting in a more strategic, client-focused approach.• Revitalised the Legal Training Institute, the only agency providing ongoing legaleducation <strong>to</strong> university graduates.• Raised the profile and strengthened the strategic planning capacity of theCorrectional Services system.• Upgraded Correctional Services staff housing and facilities, constructed twominimum-security prisons, a juvenile detention centre, a new training college anda new sewerage system for the main prison in Port Moresby, and upgraded andrenovated the other provincial prisons <strong>to</strong> make them more humane and secure.• Introduced an effective prison classification system that helps <strong>PNG</strong> manage itsprisons better and greatly assists with the rehabilitation of prisoners.• Facilitated the separation of juvenile prisoners from adults, a significant humanrights achievement.• Reinvigorated prison industries, providing a means <strong>to</strong> feed prisoners andproducing income for the institution.• Improved literacy and numeracy of prison staff and detainees, as well as HIV/AIDSawareness.• Introduced Minimum Security Units in prisons, allowing for increased security,improved management of detainees, and a change in the attitude <strong>to</strong> escaping.Despite the improvements <strong>to</strong> date, much remains <strong>to</strong> be done before principlessuch as discipline and accountability will truly be entrenched in Papua NewGuinea. These are still major problems within the various law and justiceagencies and more broadly. In spite of the institutional improvements that haveoccurred <strong>to</strong> date, the sec<strong>to</strong>r’s performance overall has, if anything, weakened 18 .The latest phase of the R<strong>PNG</strong>C Development Project is seeking <strong>to</strong> address thesedeep constraints. Crime prevention strategies based on principles of community18 A Review of the Law and Justice Sec<strong>to</strong>r Agencies in Papua New Guinea. Opportunities <strong>to</strong> Improve Efficiency,Effectiveness, Coordination and Accountability, Confidential Draft Report, Government of Papua New Guinea, 2002.38 The Contribution of <strong>Australian</strong> <strong>Aid</strong> <strong>to</strong> Papua New Guinea’s Development 1975–2000
policing are being introduced, along with procedures <strong>to</strong> reward goodperformance and discipline. The project is also initiating procedures <strong>to</strong> recordand investigate complaints about police behaviour. More broadly, Australia’sassistance strategy in the law and justice sec<strong>to</strong>r is being refined <strong>to</strong> foster asec<strong>to</strong>r-wide approach in support of Papua New Guinea’s new National Policyon Law and Order. 19 A focus on building links between key law and justiceagencies within government, as well as encouraging greater formal andinformal community involvement, is likely <strong>to</strong> improve the impact of <strong>Australian</strong>assistance and the prospects for sustainability of this assistance.5.2.2 ECONOMIC MANAGEMENT AND PUBLIC ADMINISTRATIONAlthough Australia contributed A$15 million <strong>to</strong> Papua New Guinea’s StructuralAdjustment Program in 1989–90, its support for this sub-sec<strong>to</strong>r of governancehas only really intensified since 1999–00. Since independence, a <strong>to</strong>tal of A$160million has been provided, two-thirds of which (A$107 million) has been in thelast three years.BOX 5.4 IMPROVING GOVERNANCE WITHIN THE PUBLIC SECTORThrough institutional strengthening and capacity building activities, as well assupport for multi-donor initiatives <strong>to</strong> assist Papua New Guinea’s public sec<strong>to</strong>r reformefforts, <strong>Australian</strong> assistance for economic management and public administrationhas had a number of positive impacts on improving governance in Papua New Guinea:• Introduced constitutional changes <strong>to</strong> strengthen the independence of the publicservice, in particular in the appointment and dismissal of permanent heads.• Introduced a new performance management system <strong>to</strong> improve public serviceperformance.• Improved the functioning of Cabinet processes.• Introduced improvements in the budget preparation process.• Introduced a process of major functional and expenditure reviews, <strong>to</strong> rationaliseand streamline the work of key central agencies and major spending agencies.• Provided extensive training in different aspects of financial management forpublic sec<strong>to</strong>r personnel across the country, <strong>to</strong> improve the accountability anddisbursement of public funds.• Improved competency levels and performance standards within the OmbudsmanCommission, which are expected <strong>to</strong> result in more open, transparent, accountable,equitable and responsive performance by government leaders and agencies. In2001, the Ombudsman Commission made ten referrals <strong>to</strong> the Leadership Tribunal,a 100 percent increase over the previous year.• Improved productivity within the Ombudsman Commission by 30–50%.19 See <strong>AusAID</strong> Concept paper for the Law and Justice Sec<strong>to</strong>r Program. November 2002.The Contribution of <strong>Australian</strong> <strong>Aid</strong> <strong>to</strong> Papua New Guinea’s Development 1975–2000 39
• Increased <strong>PNG</strong> public access <strong>to</strong> and confidence in the Ombudsman Commission,reflected in the 100% increase in complaints over the life of the project.• Heightened community awareness of elec<strong>to</strong>ral matters.• Strengthened capacity within the National Statistics Office, enabling thesuccessful planning and conduct of the 2000 national census.• Helped <strong>PNG</strong> <strong>to</strong> better control the movements of people in<strong>to</strong> and out of thecountry through installation of computerised migration control systems in PortMoresby and in overseas missions in the 1990s.• Developed relationships between central government agencies and theirstakeholders inside and outside of government, as well as with relevant agencieswithin Australia.• Improved the operational and institutional capacity of the Taxation Office,resulting in increased tax revenue, despite serious project implementationproblems.• Provided flexible and responsive advisory support across all aspects of governmentplanning and administration.• Improved macroeconomic forecasting capacity within the Treasury.• Developed new superannuation legislation.• Introduced initiatives <strong>to</strong> streamline revenue collection procedures within theTreasury.• Improved cus<strong>to</strong>mer servicing within the Bureau of Cus<strong>to</strong>ms and Excise, resultingin more timely revenue collection and fewer defaults.• Sustained improvement in cus<strong>to</strong>ms and excise processing and operations in PortMoresby.Institutional strengthening support and capacity building assistance is nowbeing provided across all central public sec<strong>to</strong>r agencies, with a particularemphasis on supporting public sec<strong>to</strong>r reform. In addition, Australia’s aidprogram is actively engaged in strengthening government at a provincial levelin a range of areas, but particularly in the management of public funds. Giventhe recency of most of these initiatives, and the long-term nature of capacitybuilding, it is not yet possible <strong>to</strong> identify broader impacts of <strong>Australian</strong> aid, or<strong>to</strong> assess the likely sustainability of the governance reforms being introduced inthis sub-sec<strong>to</strong>r in Papua New Guinea. Nevertheless, a range of shorter termbenefits can be identified which, if sustained, are likely <strong>to</strong> contribute <strong>to</strong>improving governance in Papua New Guinea.An important recent initiative has been the attempt <strong>to</strong> introduce incentives-basedprograms that encourage and strengthen good government. The Papua NewGuinea Incentive Fund was established in 2000 <strong>to</strong> assist organisations thatdemonstrate excellence in program management and financial accountability <strong>to</strong>40 The Contribution of <strong>Australian</strong> <strong>Aid</strong> <strong>to</strong> Papua New Guinea’s Development 1975–2000
deliver community and public services. Early reviews 20 of the two streams of theFund 21 have been positive about the concept of the Incentives Fund and thepotential for using incentives <strong>to</strong> motivate behaviour change in Papua New Guinea.5.2.3 CIVIL SOCIETYAustralia has consistently supported the development activities of nongovernmen<strong>to</strong>rganisations (NGOs) in Papua New Guinea since independence.Since the late 1980s, this support has been extended <strong>to</strong> other communitydevelopment initiatives, as well as support <strong>to</strong> strengthen human rights, labourrights and other industrial relations matters. To a much smaller extent,Australia has also provided support for private sec<strong>to</strong>r development, particularlythrough micro-enterprise development, but also in assisting with trade policydevelopment. In recent years, support for the development of civil society hasincreased markedly. By enhancing community awareness and participation, it ishoped that this support will facilitate better public scrutiny of governmentpolicies and practices over time, ultimately contributing <strong>to</strong> improvinggovernment accountability in Papua New Guinea. Since 1999–00, <strong>Australian</strong>funding for community and private sec<strong>to</strong>r development activities has averagedA$7.7 million per annum, compared with an average of A$2.5 million perannum over the previous decade (1989–90 <strong>to</strong> 1998–99). In addition <strong>to</strong> theseamounts, substantial assistance has been channelled through NGOs <strong>to</strong> supportpeace-building efforts on Bougainville, particularly since 1996.The largest activities, the Community Development Scheme (CDS) and theBougainville NGO Project, have been operating since 1996. In its first phase,the CDS succeeded in delivering grants <strong>to</strong> small NGOs, church, or communitybasedorganisations in all provinces, including in rural locations beyond thereach of other existing schemes. It was also able <strong>to</strong> achieve an equitabledistribution of available funding, including the active participation of women.Overall, the final report of Phase I concluded that the impact of the fundedprojects had been overwhelmingly positive on participating NGOs and recipientcommunities. The longer term viability of many of these small groups remainstenuous, and Phase II of the CDS is focused on developing strategies <strong>to</strong> promotesustainability. Australia has also provided training for more than 800 people insmall business and micro-enterprise training programs, located throughout ruralPapua New Guinea as well as in urban settlements of Port Moresby.20 Draft Report of Independent Review of the <strong>PNG</strong> Incentive Fund, <strong>AusAID</strong>, September 2002 and Draft Review ofIncentives and the <strong>Australian</strong> aid program, Program Evaluation Section, <strong>AusAID</strong>, December 2002.21 The <strong>PNG</strong> Incentive Fund has two components – a Program stream which, at the time of Review, had funded19 awards <strong>to</strong>talling K121m and a Policy stream that approved four awards, all in the Health sec<strong>to</strong>r, <strong>to</strong>talling K2m.The Contribution of <strong>Australian</strong> <strong>Aid</strong> <strong>to</strong> Papua New Guinea’s Development 1975–2000 41
In addition, <strong>Australian</strong> aid has facilitated improvements in media standards anddevelopment of the National Broadcasting Commission radio network, resultingin tangible improvements in the media’s ability <strong>to</strong> scrutinise governance issuessuch as government accountability.5.3 HealthAustralia has provided over A$250 million 22 in health sec<strong>to</strong>r assistance <strong>to</strong>Papua New Guinea since independence, 78% of which has been provided in thepast five years 23 . This level of funding represents about 70% of all donor healthsec<strong>to</strong>r funding in Papua New Guinea, suggesting that <strong>Australian</strong> aid has been akey contribu<strong>to</strong>r <strong>to</strong> the country’s health improvements. More than 25% ofAustralia’s aid has been provided through the Health Services Support Program,a sec<strong>to</strong>r-wide initiative that has grown significantly in the past three years. Afurther 20% has supported improvements in management and administrationwithin Papua New Guinea’s health sec<strong>to</strong>r.<strong>AusAID</strong>'s support in the health sec<strong>to</strong>r and for the development of Papua NewGuinea’s Health Sec<strong>to</strong>r Improvement Program (HSIP) has resulted in somesignificant recent achievements. The mutual goodwill developed by Australia’scommitment <strong>to</strong> HSIP and its more flexible funding modalities were criticalfac<strong>to</strong>rs in allowing the rapid and sustained growth in health expenditure overthe past three years. The commitment <strong>to</strong> move <strong>to</strong>wards a sec<strong>to</strong>r-wide approachand the subsequent reforms <strong>to</strong> aid delivery heralded by HSIP are substantiallyresponsible for the recent increase in donor support <strong>to</strong> the sec<strong>to</strong>r. Increasedresources have been flowing <strong>to</strong> the sec<strong>to</strong>r, there is greater policy engagement,and the National Department of Health and other donor partners areincreasingly focusing on performance. Structural changes and new planningand performance information mechanisms are providing the basis for improveddecision-making, resource allocation and accountability. Without HSIP it isunlikely other donors would have continued <strong>to</strong> be engaged.The most recent health sec<strong>to</strong>r study has found that increased donor funding inrecent years has not translated in<strong>to</strong> improved health services or positive changesin health indica<strong>to</strong>rs. What it has done, however, is prevent a decline in sec<strong>to</strong>rperformance that more than likely would otherwise have occurred, given the stateof service delivery and the severity of budget constraints. In essence, <strong>Australian</strong>aid has been helping <strong>to</strong> keep a collapsing health system functional, by providingessential health infrastructure and equipment, pharmaceuticals, immunisation,health education, institutional strengthening, technical assistance and training.22 This does not include A$13.8 million in support of water and sanitation infrastructure and services, whichare also vital <strong>to</strong> improved health.23 1997–98 <strong>to</strong> 2001–02.42 The Contribution of <strong>Australian</strong> <strong>Aid</strong> <strong>to</strong> Papua New Guinea’s Development 1975–2000
BOX 5.5 HEALTH IMPACTS OF AUSTRALIAN ASSISTANCE• Some evidence of a reduction in the number of deaths per 100,000 from malariaand pneumonia between 1996 and 2002, coinciding with increased <strong>Australian</strong>support across the health sec<strong>to</strong>r, including a $9 million project <strong>to</strong> field test an<strong>Australian</strong> candidate malaria vaccine and provide associated training andequipment.• Provided substantial support for immunisation against polio, triple antigen,tetanus <strong>to</strong>xoid, measles, tuberculosis and hepatitis B, including vaccine supplies,helping <strong>to</strong> arrest the decline in immunisation coverage after a fall in rates duringthe mid 1990s.• Immunised over 600,000 children aged under 5 years against polio. Polio has nowbeen eradicated in <strong>PNG</strong>.• Supplied drugs, vaccines and supplies essential <strong>to</strong> treating conditions such asmalaria, pneumonia and diarrhoea <strong>to</strong> over 500 health centres in 20 provinces,including 600 basic medical equipment kits and over 4,000 essential drug kits.• Conducted mobile health clinics and patrols in 8 provinces, immunising childrenagainst tuberculosis, polio and measles and providing antenatal care <strong>to</strong> mothers.• Rehabilitated <strong>PNG</strong>’s vaccine s<strong>to</strong>rage and distribution system.• Trained staff at 40 clinics in HIV/STD testing procedures.• Completed the first Demographic Health Survey in <strong>PNG</strong>, covering 19 provinces.The survey provides a significant database for planning future initiatives inreproductive and population health.• Provided approximately $5 million in goods and associated services, such assurgical equipment and supplies, ward furniture, administrative equipment such ascomputers, and ambulances, and an additional $3 million in biomedicalequipment <strong>to</strong> provincial hospitals.• Completed emergency repairs <strong>to</strong> make medical equipment at 19 provincialhospitals operational.• Reconstructed priority rural health facilities in four provinces, includinginstallation of solar panels, water tanks, water supply lines and bore pumps;renovated general and maternity wards; and constructed or rebuilt housing,<strong>to</strong>ilets, laundries and kitchens.• Upgraded four base hospitals.• Established 20 new provincial vaccine s<strong>to</strong>res, and rehabilitated 222 healthfacilities, including district vaccine s<strong>to</strong>res.• Constructed and equipped 10 new STD clinics.• Improved the level of HIV/AIDS awareness in selected urban and peri-urban areasin <strong>PNG</strong> from 80% <strong>to</strong> 97%, increased condom usage from 35% <strong>to</strong> 42%, andincreased the rate of individuals seeking AIDS tests from 9% <strong>to</strong> 18%.• Mobilised over 150 community and church groups <strong>to</strong> conduct HIV/AIDS awarenessprograms.The Contribution of <strong>Australian</strong> <strong>Aid</strong> <strong>to</strong> Papua New Guinea’s Development 1975–2000 43
• Provided core funding <strong>to</strong> the <strong>PNG</strong> Institute for Medical Research in recognition ofits contribution <strong>to</strong> malaria research, as well as broader disease control studies,including in the area of HIV and pneumonia and operational research supportinghealth delivery.• Enhanced operational efficiency of hospital services in 5 base hospitals, through anumber of planning, administrative, financial and human resource managementimprovements.• Provided technical assistance for development of annual work programs,budgeting and financial management in 6 provincial hospitals and 20 provincialhealth departments.• Improved and broadened the skills and knowledge base of <strong>PNG</strong> medical students,specialists, and residents by providing <strong>Australian</strong> medical specialists for shortperiods each year for cost-effective in-country training and consultancy services<strong>to</strong> hospitals. This assistance has also yielded less tangible benefits such asgoodwill between the medical professions of both countries.• Established <strong>PNG</strong>’s first degree-level health administration course.• Introduced a new student-centred curriculum at the University of Papua NewGuinea medical faculty.• Provided extensive training for medical officers, including 99 specialist medicalofficers (there were no such <strong>PNG</strong> specialists in the early 1970s).• Provided extensive training for nurses, biomedical technicians, rural health staff,hospital staff, specialist STD clinic workers, district health workers, healthadministra<strong>to</strong>rs, and hospital Board members and chief executives.At this stage, higher order outcomes of individual health projects are difficult<strong>to</strong> measure because the vast bulk of Australia’s programmed assistance in thehealth sec<strong>to</strong>r has only been provided in the last five years, and improvementsin key health indica<strong>to</strong>rs tend <strong>to</strong> take place over a much longer time frame.Also, it is difficult <strong>to</strong> isolate the effects of individual projects on healthindica<strong>to</strong>rs, since there are many other fac<strong>to</strong>rs that can affect health status, suchas access <strong>to</strong> clean water, health education, access <strong>to</strong> transport networks, etc.According <strong>to</strong> the Health Sec<strong>to</strong>r Moni<strong>to</strong>ring and Review Group, the healthsystem is only responsible for about 20% of the impact on mortality etc, withmost impact attributable <strong>to</strong> external fac<strong>to</strong>rs. Further, there is evidence thatpopulation figures were miscalculated during the 1990 census, which will haveaffected the reliability of a number of commonly used indica<strong>to</strong>rs of healthtrends. With these caveats, examination of improvements in social indica<strong>to</strong>rs(see Section 1) indicates that, while Papua New Guinea’s health status remainsextremely poor when compared with other similar countries, there have in factbeen a number of marked improvements since independence. Life expectancy,while still low, has improved significantly. Infant and child mortality rates have44 The Contribution of <strong>Australian</strong> <strong>Aid</strong> <strong>to</strong> Papua New Guinea’s Development 1975–2000
also improved 24 , and there is evidence of a reduction in some preventablediseases such as malaria and pneumonia. Likewise, there is some evidence thatimprovements have followed aid interventions. For example, deaths fromimmunisable diseases have reduced in periods following major donor-fundedimmunisation campaigns in Papua New Guinea.5.4 InfrastructureIn <strong>to</strong>tal, Australia has provided A$0.5 billion <strong>to</strong> support infrastructuredevelopment in Papua New Guinea, more than 80% of which has been in thetransport sec<strong>to</strong>r, particularly roads and civil aviation. Analysis of Papua NewGuinea’s performance in the infrastructure sec<strong>to</strong>r, and the contribution of<strong>Australian</strong> aid, indicates that the main impacts have been related <strong>to</strong> preventingrapid decline of essential infrastructure. Government funding for roadmaintenance, for example, has consistently been inadequate since the late 1980s,if not earlier. The bulk of <strong>Australian</strong> aid for infrastructure since 1993 (some$320 million) has been spent maintaining and rehabilitating roads and bridges.This has been sufficient <strong>to</strong> cover about 25% of the national road network. Otherdonors are also providing substantial assistance <strong>to</strong> maintain land transportinfrastructure. Papua New Guinea’s economic performance would have beeneven worse without this support, given the key role of accessible roads inenabling commercial activity, and the country would have faced much higherrisk of social tension and instability. Yet even this volume of aid is insufficientand, in the current fiscal environment, unsustainable. Overall, roads arecontinuing <strong>to</strong> deteriorate rapidly, and this is affecting other basic services thatdepend on land transport for access (such as health and education facilities). It isalso imposing further constraints on private sec<strong>to</strong>r and rural development, andefforts <strong>to</strong> achieve social cohesion. Even under an optimistic scenario, whereadequate internal funding is available for maintenance and upgrading ofexisting infrastructure, Papua New Guinea will face significant challenges wellin<strong>to</strong> the future in being able <strong>to</strong> maintain its existing road network, let alonefinance new major roads that may have high economic returns.Likewise, in civil aviation, <strong>Australian</strong> assistance has been instrumental inensuring the national airline carrier (Air Niugini) could continue operations overseveral years since independence. Unfortunately, these achievements have yet <strong>to</strong>prove sustainable, and the situation remains tenuous. As recently as mid-January2003, Australia's Civil Aviation Safety Authority threatened not <strong>to</strong> renew PapuaNew Guinea's Air Opera<strong>to</strong>r's Certificate 25 , over concerns about safety standards.24 Deeper analysis of these statistics is needed before firm conclusions can be drawn, as discernible trends differdepending on the data source used.25 Extended for three months from 31 January 2003.The Contribution of <strong>Australian</strong> <strong>Aid</strong> <strong>to</strong> Papua New Guinea’s Development 1975–2000 45
BOX 5.6 KEY ACHIEVEMENTS OF AUSTRALIAN AID FOR INFRASTRUCTURERoads & Bridges• Upgraded or maintained approximately 25% of the national road network(2,130 kilometres of rural roads and highways).• Upgraded or replaced 18 bridges, and provided maintenance for 60 bridges across11 provinces.• Constructed 7 remote footbridges.• Constructed one wharf.• Provided training for 112 Department of Works staff.• Improved road design specifications, and construction and maintenancedocumentation.• Rebuilt 21 kilometres of urban roads in Lae, <strong>to</strong>gether with associated works.• Rehabilitated and maintained roads on Bougainville, including 302 kilometres ofthe coastal trunk road, 25 kilometres of feeder roads and the repair of 45 bridgesand causeways.• Upgraded rural roads (44kms) and the highway (4.6km) for Kokopo <strong>to</strong>wnship,following the Rabaul volcano eruption.Civil Aviation• Maintenance of 19 of 22 of <strong>PNG</strong>’s national airports since 1992.• Established and supported <strong>PNG</strong> Civil Aviation Authority, including throughprovision of training in engineering and technical design, construction supervisionand management, and administration.• Upgraded 3 airports.• Resealed 9 airstrips.• Installed 17 navigation facilities.• Improved maintenance management systems and procedures.• Upgraded communications systems.• Improved aviation safety.Other Construction• Provided major infrastructure for Kokopo <strong>to</strong>wnship <strong>to</strong> assist victims displaced bythe volcanic eruption at Rabaul, and construction of a high school, 3 communityschools, 4 community resource centres, a business college, police headquarters,police station and police accommodation.• Enhanced water security for more than 6,000 people in Lae through installation ofs<strong>to</strong>rage tanks <strong>to</strong> double water supply capacity <strong>to</strong> 26 million litres.• Res<strong>to</strong>red radio services <strong>to</strong> Bougainville province <strong>to</strong> support the peace process.46 The Contribution of <strong>Australian</strong> <strong>Aid</strong> <strong>to</strong> Papua New Guinea’s Development 1975–2000
5.5 Renewable ResourcesIn <strong>to</strong>tal, Australia has provided aid <strong>to</strong>talling A$200 million since independence,mainly in support of agricultural development and research, but also across allother renewable resources sub-sec<strong>to</strong>rs. Australia’s assistance has been limited <strong>to</strong>specific priority concerns, and has covered a very wide range of issues, makingit difficult <strong>to</strong> isolate the impact of Australia’s contribution <strong>to</strong> improveddevelopment performance at a higher level. Also, broader impacts have notbeen well documented in individual project reports. Nevertheless, from themajor project outputs that have been documented, it is possible <strong>to</strong> concludethat <strong>Australian</strong> assistance has been carefully targeted <strong>to</strong> address some issues ofcritical importance. One can infer from the success of these aid activities thatthis aid has achieved some positive development impacts. 26 For example,<strong>Australian</strong> aid was instrumental in developing and introducing cost-effectivestrategies and technologies <strong>to</strong> deal with the serious problem of coffee rust.While objective data on the impact of this are not available, these initiativesincreased the quantity of coffee produced by plantations and smallholders,presumably increasing the revenue from this important crop.BOX 5.7 IMPACTS OF AUSTRALIAN AID ON THE MANAGEMENT ANDPROTECTION OF RENEWABLE RESOURCESAgriculture• Developed a world first labora<strong>to</strong>ry scale micro-fermentation system, enabling a“quickening" of the cocoa clone development cycle. The system was claimed <strong>to</strong> beuseful internationally for assisting with the release of improved cocoa clones. Therevised breeding program was expected <strong>to</strong> lead <strong>to</strong> improved clones in the late1990s which, if and when fully adopted, would increase export values by over$1 million per annum.• Improved the quality of cocoa through development of a mini-box fermenter, anappropriate farm-level processing technology that was expected <strong>to</strong> add aboutK80 per <strong>to</strong>nne <strong>to</strong> the value of cocoa. From a smallholder's perspective this wouldequate <strong>to</strong> an internal rate of return of between 9 and 15%.• Rehabilitated some 500 copra and cocoa driers on Bougainville, significantlyincreasing potential farm incomes and local community business opportunities.• Developed appropriate, lower-cost coffee rust spraying technology valued atalmost K1.0 million per annum <strong>to</strong> the plantation sec<strong>to</strong>r, with no negative impactfrom chemical residues.26Although this rapid assessment has not had time <strong>to</strong> examine this area in depth, it appears likely from theachievements documented that Australia’s aid has probably had disproportionate positive benefits, ie. greaterbenefits from lower but very targeted expenditure.The Contribution of <strong>Australian</strong> <strong>Aid</strong> <strong>to</strong> Papua New Guinea’s Development 1975–2000 47
• Reduced the incidence of coffee rust amongst smallholders by facilitatingwidespread adoption of coffee pruning, increasing yield potential by anestimated 13%.• Reduced soil erosion in coffee gardens and stream pollution by coffee pulp waste.• Introduced taro varieties less susceptible <strong>to</strong> taro blight.• Improved research capacity within the National Agricultural Research Institute(NARI) and ensured an appropriate focus on food security and improvingagricultural sec<strong>to</strong>r income earning opportunities.• Improved productivity in the agricultural sec<strong>to</strong>r, notably in pest and crop diseasemanagement, through <strong>Australian</strong> Centre for International Agricultural Research(ACIAR) research outcomes.• Identified, documented and mapped detailed information on smallholderagricultural farming systems for the whole of <strong>PNG</strong>.• Established a good network between the <strong>PNG</strong> and <strong>Australian</strong> quarantine agencies.Forestry• Generated a five-fold increase in recoverable timber in Kandrian-Gloucesterthrough successful demonstration of the natural reforestation method. Alsoincreased forestry incomes through better application of reforestation levies,payments <strong>to</strong> local people for timber, a micro-credit scheme for women andpurchase of Galip Nuts.• Enhanced the capacity of forestry sec<strong>to</strong>r personnel in technical and professionalareas, landholder education and industry technical skills developmentFisheries• Strengthened the capacity of the National Fisheries Authority's College in Kavieng<strong>to</strong> meet the human resource needs of the <strong>PNG</strong> fishing industry. The nationalfishing industry has committed <strong>to</strong> taking graduates, and is funding its own staff<strong>to</strong> attend.• Increased the number of graduates from National Fisheries College <strong>to</strong> 180(up from 20 per annum).Environment• Developed a new Environmental Bill and Environmental Regula<strong>to</strong>ry System withCodes of Practice.• Successfully protected the Queen Alexandra Birdwing Butterfly in Oro province.Vulcanology• Upgraded volcano moni<strong>to</strong>ring facilities run by the Rabaul VulcanologicalObserva<strong>to</strong>ry.• Strengthened capacity of the Rabaul Vulcanological Observa<strong>to</strong>ry <strong>to</strong> moni<strong>to</strong>r andminimise the risks from further volcanic activity in this and other regions of <strong>PNG</strong>.48 The Contribution of <strong>Australian</strong> <strong>Aid</strong> <strong>to</strong> Papua New Guinea’s Development 1975–2000
Land Use Management• Established one of the world's first national computerised resource informationsystems, which is now taught at UniTech in Lae, and which has proved useful incatchment management planning.• Developed the National Mapping Bureau <strong>to</strong> the point where it should be asustainable commercial proposition.• Produced a comprehensive series of provincial, district and statistical area mapsfor the national census, as well as a series of digital cadastral data base maps forthe main urban areas.• Improved rental income for the National Housing Commission by K2.4 millionper annum from land not on the existing rent register, and identified an estimatedK4.0 million per annum from currently vacant land, through production of betterland records resulting from Land Data Verification Project.The Contribution of <strong>Australian</strong> <strong>Aid</strong> <strong>to</strong> Papua New Guinea’s Development 1975–2000 49
6 LOOKING FORWARD6.1 SustainabilityMuch of the positive impact <strong>to</strong> date of Australia’s aid has been in providinginfrastructure, equipment, and basic services that, in the interests of sustainabledevelopment, should eventually be provided by the national government. Whilethis use of <strong>Australian</strong> aid funds is ultimately unsustainable, there is little doubtthat it has been necessary <strong>to</strong> prevent further declines in basic service deliveryand living standards – and it has achieved significant results in terms ofoutputs and impacts in this regard.Papua New Guinea <strong>to</strong>day is in a difficult economic and social situation <strong>to</strong> achievesustainable development. The systems of government are very weak; financialmismanagement over many years has left the country confronting its mostdifficult fiscal environment <strong>to</strong> date, and poverty remains extensive. There arenumerous areas in which successive governments could have taken a much moreproactive and determined approach <strong>to</strong> pursuing fiscal and development goals,and some of these are identified in this report. The opportunity cost for PapuaNew Guinea in using <strong>Australian</strong> aid funds <strong>to</strong> deliver basic government serviceshas been that these aid funds have not been available for activities that mightaccelerate development or assure sustainable future economic and social progress.At the same time, expectations of what Papua New Guinea could or shouldhave achieved since independence need <strong>to</strong> be tempered in recognition that it isstill a very young country. Stable and sustainable development, and a cohesivecultural identity, evolve over generations. Culturally, Papua New Guinea is oneof the most diverse countries in the world, with 832 living languages. Themountainous terrain that separates many groups makes adequate infrastructureprovision extremely difficult and costly, and perpetuates the strong triballoyalties that have existed over centuries. Although Papua New Guinea has nowbeen an independent nation for 27 years, most of the population still has littlesense of national identity. Papua New Guinea has also had <strong>to</strong> deal withnumerous major external shocks since independence, each one causing arealignment of economic and social development priorities, and each onefurther weakening an already fragile young nation.The sense of understanding that <strong>Australian</strong> budget support did not promotegenuine self-reliance, developed over a number of years in Papua New Guinea.Prior <strong>to</strong> that, the difficult choice <strong>to</strong> move away from budget support grantscompeted with the short-term attraction of assured and untied funding. Inmany ways, Papua New Guinea faces a similar decision <strong>to</strong>day in relation <strong>to</strong> thefinancing of its recurrent budget requirements. There is no doubt that Papua50 The Contribution of <strong>Australian</strong> <strong>Aid</strong> <strong>to</strong> Papua New Guinea’s Development 1975–2000
New Guinea needs donor financing for maintenance, essential equipment andbasic service delivery in its present circumstances. But this is, in effect, a moreconditional form of budget support. In the interests of self-reliance, Papua NewGuinea will need <strong>to</strong> consider the desirability of continuing reliance on such aid.In addition <strong>to</strong> being unsustainable, donor financing <strong>to</strong> meet recurrent budgetitems over the longer term could well entrench dependency.The scale of Australia’s continuing role also raises questions about prospects forself-reliance in Papua New Guinea. In spite of various efforts <strong>to</strong> expand PapuaNew Guinea’s range of donor partners, Australia remains very much thedominant influence. Even if inadvertently, this dominance is likely <strong>to</strong> skew aidprogramming and implementation priorities in Papua New Guinea in favour of<strong>Australian</strong> priorities, working against efforts <strong>to</strong> promote local ownership.Continued attention <strong>to</strong> broadening Papua New Guinea’s donor base is in bothcountries’ interests, and would enhance Papua New Guinea’s prospects forsustainable development and self-reliance.The gradual shift from project aid <strong>to</strong> a program approach through the 1990swas specifically structured and managed <strong>to</strong> help reduce absorptive capacityproblems and thus improve the prospects for generating sustainabledevelopment gains. This was a mammoth task given the volume of <strong>Australian</strong>funding <strong>to</strong> be absorbed in development programs rather than the recurrentbudget, magnified further by increasing economic and social problems.However, it was considered necessary <strong>to</strong> enhance prospects for thesustainability of aid activities over the longer term. Traditional projectstructures have often imposed parallel management systems and overburdenedalready weak capacity within Papua New Guinea. They have also been <strong>to</strong>odispersed, often putting pressure on marginal areas. These are criticisms thatcan be levelled at all donors in Papua New Guinea, and are not specific <strong>to</strong><strong>Australian</strong> aid. They have led <strong>to</strong> negative impacts in areas such as capacitybuilding and priority setting, reducing prospects for sustainability. Within aprogram approach, joint programming seeks <strong>to</strong> ensure local ownership ofactivities and is targeted <strong>to</strong> help strengthen Papua New Guinea’s own capacity<strong>to</strong> deliver basic services. It is still <strong>to</strong>o early <strong>to</strong> judge Australia’s impact onimproving absorptive and delivery capacity through these programs, many ofwhich are still underway. However, the emerging trend <strong>to</strong>wards sec<strong>to</strong>r-wideapproaches that are led by Papua New Guinea, and more fully integrated withits own policy and program priorities, will further assist this process.Australia’s role as a major aid donor must be <strong>to</strong> respond <strong>to</strong> the country’sdevelopment needs, providing services and facilities where they are needed <strong>to</strong>prevent declines in living standards while, at the same time, helping <strong>to</strong> buildPapua New Guinea’s capacity <strong>to</strong> deliver these services itself. Australia fullyThe Contribution of <strong>Australian</strong> <strong>Aid</strong> <strong>to</strong> Papua New Guinea’s Development 1975–2000 51
ecognises that Papua New Guinea’s longer-term future depends on improvingits fiscal and administrative management capacity, its skills base, and itsrevenue sources. This is obvious from the progressions that have occurred sincePapua New Guinea obtained independence in both Australia’s aid strategies andthe changing nature of its delivery mechanisms. <strong>Australian</strong> aid has a role <strong>to</strong>play in each of these areas, so that Papua New Guinea can achieve self-relianceand begin focusing on initiatives <strong>to</strong> accelerate the country’s growth, rather thansimply maintaining current levels of development. Recent fundamental changesin the emphasis of Australia’s aid program, such as increasing the degree ofPapua New Guinean participation in and ownership of aid activities, integratingaid funding within national policies and programs, and developing workablecost recovery systems, will all be important elements in achieving thisprogression <strong>to</strong>wards sustainable development within Papua New Guinea.6.2 Improving Impact and its MeasurementAt present, the data available <strong>to</strong> assess the impact of <strong>Australian</strong> aid in PapuaNew Guinea are very limited, and their reliability is questionable. In Australia,until the late 1980s, the success or failure of aid interventions was assessedprimarily against efficiency and input-based criteria. The development and useof performance indica<strong>to</strong>rs <strong>to</strong> measure the effectiveness of aid programs andinterventions was an initiative first introduced around 1987, as part of the<strong>Australian</strong> Government’s adoption of program budgeting. Performancemeasurement processes evolved through the 1990s, with increasing emphasisgiven <strong>to</strong> measures of the effectiveness of activity outputs.Beyond this, the very recent introduction of benchmarks or miles<strong>to</strong>nes is anattempt <strong>to</strong> develop more complete performance information, including of broaddevelopment impacts. This effort is complicated by the fact that economic andsocial statistics are often very weak in developing countries, and reliablebaseline data are rarely available. This is certainly the case in Papua NewGuinea. Baseline data are still being sought or developed <strong>to</strong> allow reliableassessments of the broader development impact of aid <strong>to</strong> be undertaken infuture. At present, efforts <strong>to</strong> attribute development advances and failures <strong>to</strong>the work of aid donors can only be based on trends and often subjectivejudgements.Even when accurate information is available, it is important <strong>to</strong> recognise thatthe question of determining the broad development impact of aid funding isextremely complex. A multitude of fac<strong>to</strong>rs influence a country’s growth anddevelopment. <strong>Aid</strong> is never the sole fac<strong>to</strong>r determining development results. It isnot usually even the primary fac<strong>to</strong>r. Even countries that are highly aiddependent have a strong desire for self-determination, and aid programs can52 The Contribution of <strong>Australian</strong> <strong>Aid</strong> <strong>to</strong> Papua New Guinea’s Development 1975–2000
only assist within the context of the partner government’s own policies,practices and management capacity.The need for much more rigorous moni<strong>to</strong>ring, measurement, and evaluation of<strong>Australian</strong> aid is crucial given the volume of <strong>Australian</strong> funding for Papua NewGuinea’s development since independence, and its significant developmentchallenges. Such performance information needs <strong>to</strong> be accessible not only atthe activity and sec<strong>to</strong>r level but also, importantly, at the broadest level, in thecontext of Papua New Guinea’s development policies and developmentprogress, as well as in the context of Australia’s own objectives.<strong>AusAID</strong> already has a range of systems in place that could be used <strong>to</strong> improvethe quality of baseline data and regular moni<strong>to</strong>ring and assessment of projectand sec<strong>to</strong>r-level performance. At present, logical framework matrices(logframes) are prepared for all aid activities, which identify performanceindica<strong>to</strong>rs and link these <strong>to</strong> higher order objectives as well as <strong>to</strong> project-specificoutputs. These should (and usually do) establish a framework for the sort ofbaseline data that ought <strong>to</strong> be collected, and the extent of ongoing moni<strong>to</strong>ringthat would be required <strong>to</strong> assess performance against impact indica<strong>to</strong>rs. Theresults of such moni<strong>to</strong>ring should routinely be documented as part of theexisting reporting requirements for projects. This would then allow moreeffective impact assessment of project outcomes and achievements at projectcompletion. It would also provide a valuable basis for the conduct ofsubsequent ex-post or cluster evaluations.The Project Completion Report (PCR) format in AusGUIDE explicitly requires themanaging contrac<strong>to</strong>r <strong>to</strong> make a preliminary judgement about the impact of theactivity. In practice however, most reporting is confined <strong>to</strong> specific, verifiableoutputs. Few project completion reports comment on broader developmentimpacts and, where they do, the comments tend <strong>to</strong> be confined <strong>to</strong>unsubstantiated assertions. This is probably because baseline data were notrequired <strong>to</strong> be collected at the outset of most projects, making subsequentperformance assessment difficult. The paucity of performance information is alsoa function of the very small number of ex-post evaluations that have been done.Improving the information base on which <strong>to</strong> assess the development impact ofAustralia’s aid requires some relatively straightforward changes in <strong>AusAID</strong>’scurrent processes, <strong>to</strong> develop an integrated moni<strong>to</strong>ring and evaluation system.For example, design teams should be required <strong>to</strong> identify appropriate baselinedata <strong>to</strong> allow measurement of performance and impact as well as outputs. Ifnot done during the design phase, the conduct of a baseline survey should be apriority during the inception phase of project implementation. This processshould document the methodology required for the project <strong>to</strong> moni<strong>to</strong>r changesThe Contribution of <strong>Australian</strong> <strong>Aid</strong> <strong>to</strong> Papua New Guinea’s Development 1975–2000 53
in the baseline indica<strong>to</strong>rs over the life of the project. Depending on the sec<strong>to</strong>rand the project, this moni<strong>to</strong>ring may need <strong>to</strong> be done by the managingcontrac<strong>to</strong>r, with reporting required through current mechanisms (eg, annualplans, six-monthly reports). Alternatively, it may be done more appropriatelythrough mechanisms such as mid-term reviews, technical advisory groups,sec<strong>to</strong>r moni<strong>to</strong>ring and review groups, or evaluations. Some sec<strong>to</strong>r programswithin <strong>AusAID</strong>’s <strong>PNG</strong> Branch are already developing systems that will go someway <strong>to</strong>ward improving the performance information available <strong>to</strong> <strong>AusAID</strong>, suchas a more rigorous approach <strong>to</strong> developing and using moni<strong>to</strong>ring andevaluation frameworks. Where these are being developed, it is important thatthey be in place as early as possible in the life of a project.<strong>AusAID</strong>'s move <strong>to</strong> in-country management will facilitate moni<strong>to</strong>ring andevaluation of program outcomes, and increase dialogue on programperformance with the Government of Papua New Guinea.A number of activities, such as in the renewable resources or infrastructuresec<strong>to</strong>rs, lend themselves <strong>to</strong> quantification of benefits through use of cost benefitanalysis (CBA). Ignoring for the moment the desirability of using CBA as aplanning <strong>to</strong>ol at the feasibility study stage, it may be worth considering moresystematic use of CBA for appropriate projects at the completion or evaluationstage. Activity guidelines in <strong>AusAID</strong> already specify that:“When possible and essential <strong>to</strong> determining the worth of a project, calculatethe financial rate of return (FIRR) and the economic internal rate of return(EIRR), and compare these with that estimated at the time of project design." 27In the interests of isolating and estimating the economic and financial impactsof activities, it would be highly desirable for project completion reports <strong>to</strong> berequired <strong>to</strong> calculate the FIRR and EIRR wherever practicable.Once effective systems are in place <strong>to</strong> gather performance information beyondthe output level, it is important that <strong>AusAID</strong> systematically moni<strong>to</strong>r thecollection and periodic review of such data through appropriate systems.<strong>AusAID</strong> has not required impact-level data until very recently, and has notmoni<strong>to</strong>red or supervised this aspect of project reports closely. Nevertheless, arange of systems is already in place in <strong>AusAID</strong> that could be used <strong>to</strong> facilitatethis process easily. 28 Systematic moni<strong>to</strong>ring and reporting of project and sec<strong>to</strong>rwideoutcomes and impacts of <strong>Australian</strong> aid activities would enable morerigorous analysis of performance against higher order development goals. Thiswould allow defensible conclusions <strong>to</strong> be drawn, <strong>to</strong> the benefit of future policyand programming decisions.27 AusGUIDElines 13 – Preparing Project Completion Reports.28 For example: annual plans, activity moni<strong>to</strong>ring briefs, mid-term reviews, technical advisory groups, sec<strong>to</strong>rmoni<strong>to</strong>ring and review groups, and project completion reports.54 The Contribution of <strong>Australian</strong> <strong>Aid</strong> <strong>to</strong> Papua New Guinea’s Development 1975–2000
Both within sec<strong>to</strong>rs and more broadly, as the quality of available performanceinformation improves, consideration should be given <strong>to</strong> strengthening theperformance miles<strong>to</strong>nes used at the highest level of scrutiny of the Papua NewGuinea – Australia aid program, ie. Treaty indica<strong>to</strong>rs. It has not been possiblein this paper <strong>to</strong> analyse whether the current Treaty indica<strong>to</strong>rs are provingvaluable but, in a general sense, Australia should encourage use of miles<strong>to</strong>nesand indica<strong>to</strong>rs at this level, <strong>to</strong> help build ownership and capacity within PapuaNew Guinea itself <strong>to</strong> assess the impact of donor support on development.The Contribution of <strong>Australian</strong> <strong>Aid</strong> <strong>to</strong> Papua New Guinea’s Development 1975–2000 55
7 FINDINGS AND RECOMMENDATIONSPapua New Guinea’s development record <strong>to</strong> date is generally regarded as poorbecause, by international standards and in comparison <strong>to</strong> similar countries, itslevel of development remains extremely low based on most key economic andsocial indica<strong>to</strong>rs. Nonetheless, improvements have been made in the standard ofliving. While there are some differences between data sources in the estimatedextent of the improvement, it appears reasonable <strong>to</strong> conclude that key socialindica<strong>to</strong>rs have improved substantially since independence.These improvements have been achieved despite some deep-rooted developmentconstraints, including consistently weak government capacity for servicedelivery, a deteriorating law and order situation over many years, an unstablepolitical environment, and a firmly clan-based civil society.Quantitative analysis of the sources of development is precluded by a shortageof reliable data. But because these development gains are <strong>to</strong> an extentdependent on the quality of public programs, it appears reasonable <strong>to</strong> attributeat least some of the improvements <strong>to</strong> effective public programs. In reaching thisconclusion, it is important <strong>to</strong> recognise that credit for the gains in developmentshould also be shared with the communities themselves, the NGO movementand, in particular, the churches.At an aggregate level, it is not really possible <strong>to</strong> separate out the effects ofGovernment and donor-funded programs. For much of the period there wasessentially no difference, with most donor funds provided by Australia asbudget support. However even under program support there are insufficientdata <strong>to</strong> distinguish the effect of government versus donor programs throughaggregate analysis. But by implication, it appears reasonable <strong>to</strong> conclude thataid has generated at least moderate development returns in improving theefficiency, effectiveness and impact of key public programs. It follows that itappears reasonable <strong>to</strong> conclude that aid has made a significant contribution <strong>to</strong>alleviating poverty. Education and health are important dimensions of thepoverty problem, so the improvements made over time <strong>to</strong> the standards ofeducation and health are likely <strong>to</strong> have eased poverty over time.In reviewing these conclusions, the implications of fungibility need <strong>to</strong> be keptin mind. A widely held concern is that by boosting the funding available <strong>to</strong> thebudget and relaxing the budget constraint, aid may have seen some low valueor inappropriate activities or practices emerge that otherwise could not havebeen afforded. So even though aid may be allocated <strong>to</strong> a specific, desirableexpenditure, the <strong>to</strong>tal impact also needs <strong>to</strong> consider the consequences of anyexpenditure that is in effect indirectly funded by aid.56 The Contribution of <strong>Australian</strong> <strong>Aid</strong> <strong>to</strong> Papua New Guinea’s Development 1975–2000
However, it seems reasonable <strong>to</strong> argue that the poor state of governance wouldhave seen at least some of the inappropriate practices take place even in theabsence of aid. A key fac<strong>to</strong>r in this regard is the ability for MPs <strong>to</strong> be electedon only a small share of the vote gain in their elec<strong>to</strong>rate. This has created abias <strong>to</strong>wards expenditure that channels funding <strong>to</strong> selected groups rather thanthe elec<strong>to</strong>rate as-a-whole and provides opportunities for other means ofgathering support. It follows that it is unrealistic <strong>to</strong> have expected the samelevel of funding for high priority expenditures such as basic education andhealth care as was actually seen in the presence of aid. So while aid probablyhas indirectly funded some inappropriate activities, it appears reasonable <strong>to</strong>argue that aid also achieved a net increase in funding <strong>to</strong> important expenditure.Papua New Guinea’s main shortcoming has been in terms of growth. Overallthe growth that has been seen is mainly attributable <strong>to</strong> population growth and,on a per capita basis, there has been little or no growth. <strong>Aid</strong> may have played arole in preventing a worse outcome, but it cannot claim <strong>to</strong> have achievedgrowth. It appears that, despite improvements <strong>to</strong> human capital, the country’seconomic potential has been constrained by the poor policy and institutionalenvironment and public infrastructure.This rapid assessment has highlighted the importance of further research in<strong>to</strong>Papua New Guinea’s development record and the contribution of <strong>Australian</strong> aid.In particular:i. There is a need <strong>to</strong> clarify the accuracy and comparability of the mainindica<strong>to</strong>rs of development. This assessment has been based on the bestreadily available approximations of the indica<strong>to</strong>rs established under theMillenium Development Goals (MDGs). The World Development Indica<strong>to</strong>rs(WDI) is used as the primary data source in the analysis. For some indica<strong>to</strong>rs,data from the 1998 Human Development Report shows a less favourableoutcome. There would be considerable value in ensuring agreement betweenthe Government and the main donor agencies as <strong>to</strong> the data that will beused <strong>to</strong> measure performance against the MDGs. 29 It would also potentiallybe useful <strong>to</strong> investigate the basis of Papua New Guinea’s ranking as a lowmiddle-income country. This ranking in the face of social indica<strong>to</strong>rs of thelow-income countries is seen as evidence of poor performance, but theconclusion may be misleading, particularly recognising the highly dualisticnature of the economy in Papua New Guinea.ii. There is an opportunity <strong>to</strong> bridge the gap between the preliminary, positiveinterpretation offered by the aggregate data and the detailed sec<strong>to</strong>ral datathrough a more detailed analysis of sec<strong>to</strong>ral achievements. Thisexamination need not examine the full range of activities, but couldinstead focus on areas offering a rich source of information on lessons29 It is noted that such work may already be underway.The Contribution of <strong>Australian</strong> <strong>Aid</strong> <strong>to</strong> Papua New Guinea’s Development 1975–2000 57
learned. A good example would probably be the tracking of theimmunisation program since independence.iii. It may be possible <strong>to</strong> shed more light on the determinants of growth anddevelopment, and the contribution of aid, through provincial or local-levelanalysis. Detailed time series analysis is largely precluded by the absenceof poor quality of data on growth and its key determinants. However, it ispossible that productive research could be undertaken on cross-sectional(and perhaps pooled) data drawing on the provincial or local level data.For example, analysis of the local level data (eg, on cash incomes,employment) provided by the census could provide useful insights in<strong>to</strong> thegrowth process.iv. Treaty Indica<strong>to</strong>rs – The findings of assessments undertaken <strong>to</strong> date againstthe various Treaty indica<strong>to</strong>rs were not available for this rapid assessment.Thus it has not been possible <strong>to</strong> comment on their quality or value forcurrent or future impact assessment. Such analysis, through discussionwith the Papua New Guinea Government and <strong>AusAID</strong>’s <strong>PNG</strong> Branch andPost, would be helpful.v. Budget Support – A more detailed assessment of the impact of <strong>Australian</strong>budget support would require analysis of Papua New Guinea governmentexpenditure by sec<strong>to</strong>r during these years.vi. Comparisons – A more detailed impact assessment of <strong>Australian</strong> aid couldcompare development performance in certain areas for provinces andsec<strong>to</strong>rs in which Australia has not played a major role.vii. Poverty – A useful suggestion by an independent peer reviewer of the draf<strong>to</strong>f this report is <strong>to</strong> explore systematically the impact of <strong>Australian</strong> aid onpoverty. This is a complex issue, beyond the scope of this rapidassessment, but well worth pursuing.viii. Education – More detailed analysis of the impact of scholarship programswould be of value. It is unders<strong>to</strong>od a tracer study is planned.ix. Health – It is difficult <strong>to</strong> locate reliable anthropometric data on, forexample, height for age, or weight for height, for Papua New Guinea. It ispossible such data have not been collected, however references in otherresearch suggest such data may be obtainable, for instance from the 1996<strong>PNG</strong> Household Survey and the 1982 Nutrition Study. The NationalDepartment of Health collects data on weight for age, although it appearsthis has only been the case since 1997.x. Infrastructure – Based on available information for this rapid assessment,the report tends <strong>to</strong> focus on road maintenance issues rather than on newinvestments. At the same time, it appears there are reports that support theeconomic benefits of constructing certain new roads in Papua New Guinea.In the time available, it has not been possible <strong>to</strong> analyse the his<strong>to</strong>ry behindthe shift in policy <strong>to</strong>ward giving priority <strong>to</strong> maintenance. It would be58 The Contribution of <strong>Australian</strong> <strong>Aid</strong> <strong>to</strong> Papua New Guinea’s Development 1975–2000
useful <strong>to</strong> document the findings of such analyses, if they are available. Forexample, while the logic of focusing on maintenance issues is clear, hasthe economic benefit of maintaining existing roads been quantified andcompared with the alternative of letting the state of certain roads declinewhile investing in certain new roads?xi. Renewable Resources – Time constraints have not allowed adequateanalysis of <strong>Australian</strong> aid in this sec<strong>to</strong>r. Although less significant involume terms than other sec<strong>to</strong>rs, it is clear from the projects that havebeen summarised that <strong>Australian</strong> aid has been of enormous value inspecific priority areas. It is likely that, if completed and expanded, a rangeof other impacts of <strong>Australian</strong> aid could be identified. Given theimportance of this sec<strong>to</strong>r <strong>to</strong> Papua New Guinea’s future sustainabledevelopment, further analysis may be of value. This should includeconsultation with ACIAR.xii. One specific project that may be worth further evaluation is the CocoaQuality Improvement Project. Indications at project completion were thatthis project had the potential <strong>to</strong> yield significant gains in terms ofincreased export values and improved smallholder returns, and earlyestimates suggested a quite favourable economic outcome. The ProjectDesign Document (PDD) estimated a 23% EIRR (which is very good foragriculture), but the EIRR was not recalculated at completion.xiii. Non-Government Organisations – Limited time and information haveprecluded detailed analysis of <strong>Australian</strong> aid provided through NGOs. Thereis an assumption that they are a better delivery mechanism in variouscircumstances, but this needs further analysis. In particular, difficulties ofsustainability need <strong>to</strong> be addressed.xiv. Sustainability – Future programming would benefit from further analyticalwork <strong>to</strong> identify strategies that can help improve the prospects forsustainability of aid activities in Papua New Guinea. Existing strategiessuch as joint programming, incentives-based activities, and the integrationof activities within Papua New Guinea’s own policy framework areimportant initiatives. But achieving sustainability in Papua New Guinea isan extremely complex endeavour, the success of which will depend onturning around some deeply-rooted cultural constraints, such as the lack ofa real sense of nationhood and the widespread acceptance of corruption.Program strategies and activity designs need <strong>to</strong> be developed which directlytarget improvements in these areas. For example, structural efforts <strong>to</strong> reducecorruption (such as tightening procurement procedures) will, in and ofthemselves, change little. They need <strong>to</strong> be combined with strategies <strong>to</strong>change the attitude <strong>to</strong>wards corruption. Such attitudinal change may thenallow development programs <strong>to</strong> harness cultural systems such as the wan<strong>to</strong>ksystem <strong>to</strong> work for the benefit of development in Papua New Guinea.The Contribution of <strong>Australian</strong> <strong>Aid</strong> <strong>to</strong> Papua New Guinea’s Development 1975–2000 59
xv. Performance assessment – There is considerable scope <strong>to</strong> improve thequality of impact information available <strong>to</strong> <strong>AusAID</strong>, building on bestpractice systems and processes that already exist within the Agency butwhich are not followed (see Section 6.2). Greater investment in baselinestudies, performance measurement and formal evaluations would not onlyimprove the quality of performance information available, but would alsocontribute <strong>to</strong> improved activity targeting and design over time.60 The Contribution of <strong>Australian</strong> <strong>Aid</strong> <strong>to</strong> Papua New Guinea’s Development 1975–2000
ANNEX A EVOLUTION OF AUSTRALIAN AID OBJECTIVES IN PAPUA NEW GUINEAThe Contribution of <strong>Australian</strong> <strong>Aid</strong> <strong>to</strong> Papua New Guinea’s Development 1975–2000 61Year Catalysts Objectives Priorities1975 • Independence• Somare Governmentemphasis on equityand stability, ratherthan growth1980 • High expectationsfor minerals sec<strong>to</strong>r• Crawford Review1982 • Impact of worldrecession affects <strong>PNG</strong>economy, particularlymining sec<strong>to</strong>r – fallin gold price,declining BougainvilleCopper profits1986 • Introduction ofproject aid• Wingti Governmentemphasis oneconomic growth,away from socialservices• To assist <strong>PNG</strong> achieve a smooth transition <strong>to</strong> independenceand enable it <strong>to</strong> continue its development strategies in thepost-independence period.• To enable <strong>PNG</strong> <strong>to</strong> pursue its economic development policieswith assured funding while, at the same time, meeting itsstated objective of self-reliance.• To provide <strong>PNG</strong> with a practicable framework in which <strong>to</strong> planits development.• To accelerate progress <strong>to</strong>wards self-reliance.• In addition <strong>to</strong> budget support, <strong>to</strong> introduce a country programutilising a range of instruments (projects, training,scholarships, and technical assistance).• To enable <strong>PNG</strong> <strong>to</strong> set its own development priorities• To bridge the resource gap between <strong>PNG</strong>’s high investmentrequirements and low savings• To ensure <strong>PNG</strong> is able <strong>to</strong> maintain a stable, viable and unitedcountry after its rapid transition <strong>to</strong> independence• To reduce budget support gradually and predictably• To ease the rate of decline of budget support• Revenue generation• Institution strengthening for key economic departments• Technical assistance for state enterprises• Management development in the Departments of Health,Works, Police and Justice.
62 The Contribution of <strong>Australian</strong> <strong>Aid</strong> <strong>to</strong> Papua New Guinea’s Development 1975–2000Year Catalysts Objectives Priorities1989 • First Treaty• Namaliu Governmentincreased priority ofsocial sec<strong>to</strong>rs1995 • Economic recoveryprogram following1994 financial crisis• Devolution <strong>to</strong>provincialgovernments1998 • Recovery from majordrought in 1997• Res<strong>to</strong>ration of peaceon Bougainville• To promote self sustaining economic growth with equity andcontribute <strong>to</strong> <strong>PNG</strong>’s stability and social cohesion.• To reduce progressively the overall level of <strong>Australian</strong> aid,shifting from budget support <strong>to</strong> project aid.• To maintain support within Australia for aid <strong>to</strong> <strong>PNG</strong>.• To consolidate the geographic spread of <strong>Australian</strong> aid andachieve an appropriate balance in sec<strong>to</strong>ral emphasis betweenprojects supporting economic growth and those supportingsocial development.• To assist <strong>PNG</strong> meet its objectives of greater self-reliance,economic stability, social and gender equity and povertyalleviation.• To strengthen <strong>PNG</strong>’s abilities <strong>to</strong> develop sec<strong>to</strong>ral policies,improve basic service delivery especially in rural areas, fosterinvestment and create employment.• To promote sustainable development, self-reliance, stabilityand social cohesion.• To assist with implementation of <strong>PNG</strong>’s economic reforms.• To strengthen <strong>PNG</strong>’s ability <strong>to</strong> improve basic service deliveryespecially in rural areas, implement development programs,foster investment and create employment.• To enhance <strong>PNG</strong>’s capacity <strong>to</strong> plan for devolution of servicedelivery responsibilities <strong>to</strong> provinces.2000 • Second Treaty • To relieve poverty and achieve sustainable development.• Budget support • To introduce contestability among <strong>PNG</strong> organisations seekingphase-out completed aid funds.• Human resource development and institution strengthening,especially at provincial level• Rural development• Civil aviation• Forest & environmental management• Continued support for law and order projects• Revenue generation (taxation/cus<strong>to</strong>ms)• Health• Education & training• Transport & communication• Renewable resources• Law & justice• Private sec<strong>to</strong>r developmentSame sec<strong>to</strong>rs, but emphasis on:• Maximising involvement of <strong>PNG</strong> agencies in delivery, includingproject funding through <strong>PNG</strong> agencies• Greater NGO involvement• Increased commodity supply• Strengthen governance• Improve social indica<strong>to</strong>rs• Build prospects for sustainable economic growth• Consolidate the peace process in Bougainville
ANNEX B SECTOR BREAKDOWN OF AUSTRALIANAID TO PAPUA NEW GUINEA, 1975–2002Sec<strong>to</strong>r Sub-Sec<strong>to</strong>r A$ (Nominal) % of % ofSec<strong>to</strong>r ProgrammableTotal <strong>Aid</strong>CIVIL SOCIETYCommunity Development 37,436,329 33.8Post-Conflict Peace Building 58,925,748 53.2Private Sec<strong>to</strong>r Development 14,330,392 12.9Sec<strong>to</strong>r Total 110,692,469 100.0 5.4GOVERNANCEEconomic & Public Administration 159,064,406 37.1Law & Justice 240,202,725 56.1Post-Conflict Peace Building 29,239,560 6.8Sec<strong>to</strong>r Total 428,506,690 100.0 20.8EDUCATIONElementary, Primary, Secondary 284,454,879 53.0Management & Administration 24,289,870 4.5Non-Formal, Managerial & Teacher Training 39,347,198 7.3Technical & Vocational Education 43,469,664 8.1Tertiary 145,605,949 27.1Sec<strong>to</strong>r Total 537,167,560 100.0 26.1HEALTHBasic Health Infrastructure 11,017,121 4.3Health Education 20,127,238 7.9Infectious Diseases 35,797,894 14.1Management & Administration 51,439,498 20.2Maternal & Child Health 48,816,961 19.2Medical Services 19,259,987 7.6Sec<strong>to</strong>r-wide Programs 68,006,680 26.7Sec<strong>to</strong>r Total 254,465,379 100.0 12.3INFRASTRUCTURECommunications 27,357,028 5.5Housing, Construction, Urban Planning 798,920 0.2Management & Administration 15,035,432 3.0Cross-Sec<strong>to</strong>r 56,308 0.0Post-Conflict Peace Building 15,195,144 3.0Power & Energy 4,101,567 0.8Air Transport 99,471,954 19.9Land Transport 311,811,400 62.4The Contribution of <strong>Australian</strong> <strong>Aid</strong> <strong>to</strong> Papua New Guinea’s Development 1975–2000 63
Water Transport 11,990,866 2.4Water & Sanitation 13,751,017 2.8Sec<strong>to</strong>r Total 499,569,636 100.0 24.2NATURAL RESOURCESAgriculture 65,774,649 32.9Environmental Management & Protection 14,263,316 7.1Fisheries & Lives<strong>to</strong>ck 5,884,783 2.9Forestry 38,316,575 19.2Land & Water Resources 34,478,895 17.3Vulcanology, Geology & Mining 7,739,679 3.9Sec<strong>to</strong>r-wide Programs 33,334,803 16.7Sec<strong>to</strong>r Total 199,792,700 100.0 9.7DONOR ADMINISTRATIONProgram Development, Administration &Review 30,323,256 1.5Total Programmable Funding 2,060,517,690% of Total Flows 25.4UNPROGRAMMABLEBudget Support 5,515,792,500Other (retirement benefits,emergency relief) 530,785,200Total Unprogrammable Funding 6,046,577,700% of Total Flows 74.6Total <strong>Aid</strong> 8,107,095,390 100.0Included in the above figures is assistance <strong>to</strong> Bougainville. Separately identifiable assistance <strong>to</strong> Bougainville <strong>to</strong>tals:147,013,86064 The Contribution of <strong>Australian</strong> <strong>Aid</strong> <strong>to</strong> Papua New Guinea’s Development 1975–2000
8 REFERENCESAhai, N., 1988, The Development Problem in Papua New Guinea, NationalResearch Institute Discussion Paper, Number 88.AIDAB (<strong>Australian</strong> International Development Assistance Bureau), 1989, JointParliamentary Committee on Foreign Affairs, Defence and Trade Inquiry in<strong>to</strong>Australia’s Relations with Papua New Guinea: Development Cooperation,August.AIDAB, 1994, Papua New Guinea, The Role of Government in EconomicDevelopment, International Development Issues No. 33, June.AIDAB, 1994, Private Sec<strong>to</strong>r Development in Papua New Guinea, A BackgroundAnalysis for the Private Sec<strong>to</strong>r Working Group, prepared by Economic InsightsPty Ltd, March.Asian Development Bank, 1997, Emerging Asia: Changes and Challenges, AsianDevelopment Bank, July.Asian Development Bank, 2000, Annual Report 2000, Asian DevelopmentBank, July.<strong>AusAID</strong> (<strong>Australian</strong> Agency for International Development), 1984, Desk Study:Papua New Guinea (Literature Review), May.<strong>AusAID</strong>, 1995, Papua New Guinea, Improving the Investment Climate,International Development Issues, No. 39, November.<strong>AusAID</strong>, 1996, The Economy of Papua New Guinea, International DevelopmentIssues No. 46, prepared by Economic Insights Pty Ltd, July.<strong>AusAID</strong>, 1997, Economic Survey of Papua New Guinea, August.<strong>AusAID</strong>, 1998, Papua New Guinea, Coping with Shocks and Achieving Broad-Based Economic Development, International Development Issues No. 52,prepared by Economic Insights Pty Ltd, May.<strong>AusAID</strong>, 1999, The Economy of Papua New Guinea – Macroeconomic Policies:Implications for Growth and Development in the Informal Sec<strong>to</strong>r, <strong>AusAID</strong>International Development Issues, No. 53, June.<strong>AusAID</strong>, 1999, The Economy of Papua New Guinea, Macroeconomic Policies:Implications for Growth and Development in the Informal Sec<strong>to</strong>r, InternationalDevelopment Issues No. 53, prepared by Economic Insights Pty Ltd, June.<strong>AusAID</strong>, 2000, Papua New Guinea Program Profiles 1999–2000, February.<strong>AusAID</strong>, 2002, Draft Report of Independent Review of the <strong>PNG</strong> Incentive Fund,September.The Contribution of <strong>Australian</strong> <strong>Aid</strong> <strong>to</strong> Papua New Guinea’s Development 1975–2000 65
<strong>AusAID</strong>, 2002, Concept Paper for the Law and Justice Sec<strong>to</strong>r Program,November.<strong>AusAID</strong>, 2002, Draft Review of Incentives and the <strong>Australian</strong> <strong>Aid</strong> Program,Program Evaluation Section, December.<strong>AusAID</strong>, (various editions), Australia’s Overseas <strong>Aid</strong> Program StatisticalSummary (“the blue book"). Australia’s Overseas <strong>Aid</strong> Program StatisticalSummary, Canberra.Bank of Papua New Guinea, 1998, Money and Banking in Papua New Guinea,November.Bueno de Mesquita, B., Morrow, J., Silverson, R. and Smith, A., 2001, PoliticalCompetition and Economic Growth, Journal of Democracy, 12(1), pp. 58–72.Commonwealth of Australia, 1997, One Clear Objective: Poverty ReductionThrough Sustainable Development, Report of the Committee of Review ofAustralia’s Overseas <strong>Aid</strong> Program, April.Connell, John, 1997, Papua New Guinea – The Struggle for Development,Routledge Studies in the Growth Economies of Asia.Dunaway, Steven and Ebrill, Liam P., 2002, Staff Report for the 2002 Article IVConsultation, International Monetary Fund, Papua New Guinea, Prepared by theStaff Representatives for the 2002 Consultation with Papua New Guinea, May.Duncan, Ron, 2001, <strong>PNG</strong> Economic Survey: a scorecard for the Morautaadministration, Pacific Economic Bulletin, Volume 16, Number 2, The<strong>Australian</strong> National University, Canberra.Duncan, R., and T. Lawson, 1997, “Cost Structures in Papua New Guinea"Institute for National Affairs, Discussion Paper No. 69.Duncan R., Chand S., Graham B, Lawson T. and Duncan R., 1998, ExchangeRate Policy in Papua New Guinea, Institute of National Affairs Discussion PaperNo. 64, Port Moresby, April.Fallon, John; King, Tim and Zeitsch, John, 1995, Exchange Rate Policy inPapua New Guinea, Economic Insights Pty Ltd for the Institute of NationalAffairs, Discussion Paper No. 64, January.Fernando, N. A., 1992, Provincial Human Development in Papua New Guinea:Its Level and Inequality, National Research Institute, Boroko, Papua NewGuinea.Gannicott, Ken, 1993, Human resource development, The Papua New GuineaEconomy, Prospects for Sec<strong>to</strong>ral Development & Broad Based Growth, AIDAB(<strong>Australian</strong> International Development Assistance Bureau), pp. 138–158, April.66 The Contribution of <strong>Australian</strong> <strong>Aid</strong> <strong>to</strong> Papua New Guinea’s Development 1975–2000
Garnaut, R., and Baxter, P., 1984, in consultation with A. O. Krueger, ExchangeRate and Macroeconomic Policy in Independent Papua New Guinea,Development Studies Centre, <strong>Australian</strong> National University, Canberra.Goodman, Raymond; Lepani, Charles and Morawetz, David, 1987, The Economyof Papua New Guinea, An Independent Review, National Centre forDevelopment Studies, The <strong>Australian</strong> National University, Canberra, PacificPolicy Papers No. 1.Government of Papua New Guinea, 1999, Papua New Guinea, HumanDevelopment Report 1998, prepared by the Office of National Planning, PortMoresby, Papua New Guinea.Government of Papua New Guinea, 2002, A Review of the Law and JusticeSec<strong>to</strong>r Agencies in Papua New Guinea. Opportunities <strong>to</strong> Improve Efficiency,Effectiveness, Coordination and Accountability, Confidential Draft Report.Grey, Michael, 1993, Agriculture: problems and prospects, The Papua NewGuinea Economy, Prospects for Sec<strong>to</strong>ral Development & Broad Based Growth,AIDAB (<strong>Australian</strong> International Development Assistance Bureau), pp. 85–123,April.Gupta, Desh, and Levantis, Theodore, 1999, Comparative economic performancein Papua New Guinea and Fiji, in Pacific Economic Bulletin, Volume 14,Number 1, The <strong>Australian</strong> National University, Canberra.Hayes, G., 2001, A Population Profile of Papua New Guinea, UNFPA CountryTechnical Services Team, Office for the South Pacific, Discussion Paper No.25,August.Heenan, Geoffrey; Berezin, Peter; Dieterich, Christine and Mlachila, Montfort,2002, Selected Issues and Statistical Index, International Monetary Fund, PapuaNew Guinea, May.Jarrett, Frank G. and Anderson, Kym, 1989, Growth, Structural Change andEconomic Policy in Papua New Guinea – Implications for agriculture, PacificPolicy Paper No. 5, National Centre for Development Studies, The <strong>Australian</strong>National University.Jarrett, F. G., 1991, Papua New Guinea’s Economic Development Prior <strong>to</strong>Independence.Jones, L. T. and McGavin, P. A., 2001, Land Mobilisation in Papua New Guinea,Asia Pacific Press at The <strong>Australian</strong> National University, Canberra.Kaufman D., Kraay A. and Zoido-Loba<strong>to</strong>n P., 2002, Governance Matters II –Updated Indica<strong>to</strong>rs for 2001–02, Policy Research Working Paper No. 2772, TheWorld Bank Development Research Group and World Bank Institute, February.The Contribution of <strong>Australian</strong> <strong>Aid</strong> <strong>to</strong> Papua New Guinea’s Development 1975–2000 67
Kakwani N., Prakash B. and Son H., Growth, Inequality and Poverty: AnIntroduction, Asian Development Review, Volume 18, No. 2, pp.1–21.King T. and Sugden C., 1996, Managing Papua New Guinea’s Kina, PacificEconomic Bulletin, Volume 12, Issue 1, June, pp 20–29.Levantis, Theodore, 1997, The urban labour market in Papua New Guinea, postderegulation,in Pacific Economic Bulletin, Volume 12, Number 2, The<strong>Australian</strong> National University, Canberra.Manning, M., 1999, Obstacles <strong>to</strong> Doing Business in <strong>PNG</strong> – a private sec<strong>to</strong>rsurvey, Institute of National Affairs, Port Moresby.McGavin, P. A., 1993, The 1992 Minimum Wages Board Determination:implications for employment and growth, The Papua New Guinea Economy,Prospects for Sec<strong>to</strong>ral Development & Broad Based Growth, AIDAB (<strong>Australian</strong>International Development Assistance Bureau), pp. 52–84, April.McGavin, P. A., 1991, Wages, Incomes and Productivity in Papua New Guinea,Institute of National Affairs, Discussion Paper No. 48, June.Meesook, Kanitta, 1997, Financial sec<strong>to</strong>r development, 1980–96, in Papua NewGuinea: a 20/20 Vision by Ila Temu (edi<strong>to</strong>r), The <strong>Australian</strong> National University,Canberra and National Research Institute, Papua New Guinea.Millett, John, 1990, Private Sec<strong>to</strong>r Development in Papua New Guinea, Instituteof National Affairs, Discussion Paper No. 42, August.Millett, John, 1997, Institutional Strengthening in Papua New Guinea, PacificEconomic Bulletin, Volume 12, Number 2, pp. 105–9.Naylor, Ross; Dewdney, John and Mylius, Ray, 1993, The health system, ThePapua New Guinea Economy, Prospects for Sec<strong>to</strong>ral Development & BroadBased Growth, AIDAB (<strong>Australian</strong> International Development AssistanceBureau), pp. 159–189, April.Pitts, Maxine, 2002, Crime, Corruption and Capacity in Papua New Guinea,Asia Pacific Press at The <strong>Australian</strong> National University, Canberra.Quibria M.G., 2002, Growth and Poverty: Lessons from the East Asian MiracleRevisited, ADB Institute Research Paper No. 33, February.Reilly, Benjamin, 2002, Economic decline and political reform in Papua NewGuinea, in Pacific Economic Bulletin, Volume 17, Number 2, The <strong>Australian</strong>National University, Canberra.Somare, M., 1985, The Past Ten Years of Independence, Yagl-Ambu, 12(1),March, pp. 5–10.SRI International and ECFA (Japan), 1992, Papua New Guinea: Industrial68 The Contribution of <strong>Australian</strong> <strong>Aid</strong> <strong>to</strong> Papua New Guinea’s Development 1975–2000
Growth Strategy, Final Report, prepared for Asian Development Bank and theGovernment of Papua New Guinea, August.Srinivasan T.N., 2000, Growth and Poverty .Alleviation: Lessons fromDevelopment Experience, Working Paper No.17, Asian Development BankInstitute, Tokyo.Sugden C., 2002, Managing Papua New Guinea’s Costly Economic Cycles,Pacific Economic Bulletin, Volume 17, Number 2, pp.1–14.The Parliament of the Commonwealth of Australia, 1991, Australia’s Relationswith Papua New Guinea, Joint Committee on Foreign Affairs, Defence andTrade, December.World Bank, 1980, Papua New Guinea, Sec<strong>to</strong>r Review: Transport, Report No.2819a-<strong>PNG</strong>, January.World Bank, 1983, Public Sec<strong>to</strong>r Management in Papua New Guinea, AnAdministrative Overview, Report No. 4396-<strong>PNG</strong>, June.World Bank, 1990, Papua New Guinea, The Forestry Sec<strong>to</strong>r: A Tropical ForestryAction Plan Review, Report No. 8031-<strong>PNG</strong>, February.World Bank, 1991, Papua New Guinea – Structural Adjustment, Growth andHuman Resource Development, Report No. 9396-<strong>PNG</strong>, May.World Bank, 1993, Papua New Guinea – Jobs, Economic Growth andInternational Competitiveness, Report No. 11653-<strong>PNG</strong>, May.World Bank, 1999a, Papua New Guinea, Poverty and Access <strong>to</strong> Public Services,Report No. 19584-<strong>PNG</strong>, Oc<strong>to</strong>ber.World Bank, 1999b, Papua New Guinea, Improving Governance andPerformance, Report No. 19388-<strong>PNG</strong>, Oc<strong>to</strong>ber.World Bank, 2000, Papua New Guinea, Country Assistance Evaluation, ReportNo. 20183, March.World Bank, 2001, World Development Report 2000/2001: Attacking Poverty,Oxford University Press.Yala, Charles and Levantis, Theodore, 1998, Recent economic events in PapuaNew Guinea: a continuing drought in development, in Pacific EconomicBulletin, Volume 13, Number 2, The <strong>Australian</strong> National University, Canberra.Zvekic, U. and Alvazzi, A., 1995, Criminal victimisation in the developingworld, Interregional Crime and Justice Research Institute, New York.The Contribution of <strong>Australian</strong> <strong>Aid</strong> <strong>to</strong> Papua New Guinea’s Development 1975–2000 69
The Contribution of <strong>Australian</strong> <strong>Aid</strong> <strong>to</strong> Papua New Guinea’sDevelopment 1975–2000Evaluation and Review SeriesNo. 34 June 2003As part of a broader focus on improved learning and accountability, <strong>AusAID</strong> is takingsteps <strong>to</strong> improve its ability <strong>to</strong> measure the effectiveness of the aid program <strong>to</strong> <strong>PNG</strong>. Thisreport was commissioned as a background document <strong>to</strong> inform that exercise.The key findings of the Report are:• <strong>PNG</strong> faces serious development challenges, most notably a weak institutionalenvironment with poor control of government spending and a serious law and orderproblem;• However, <strong>PNG</strong> has made some development progress since independence, even in theface of stagnant per capita incomes;• There is evidence that the aid program has contributed materially <strong>to</strong> development.For example, it has been central <strong>to</strong> education reform, prevented health systemcollapse and maintained some essential infrastructure;• Many questions remain <strong>to</strong> be answered, and our capacity <strong>to</strong> complete a rigorousassessment of the program needs <strong>to</strong> be improved.For further information, contact:Direc<strong>to</strong>r, Program Evaluation<strong>AusAID</strong> Office of Review and EvaluationGPO Box 887Canberra ACT 2601Phone (02) 6206 4640Fax (02) 6206 4949Internet www.ausaid.gov.auEmail evaluation@ausaid.gov.auOnline copies of publications by the aid program are available on the <strong>AusAID</strong> internet site:www.ausaid.gov.au/publicationsHard copies are available from:Canberra MailingPO Box 650Fyshwick ACT 2609Phone (02) 6269 1230Fax (02) 6269 1229Email books@ausaid.gov.au