Taxonomy and Evolution of Gibbons
Taxonomy and Evolution of Gibbons
Taxonomy and Evolution of Gibbons

Create successful ePaper yourself
Turn your PDF publications into a flip-book with our unique Google optimized e-Paper software.
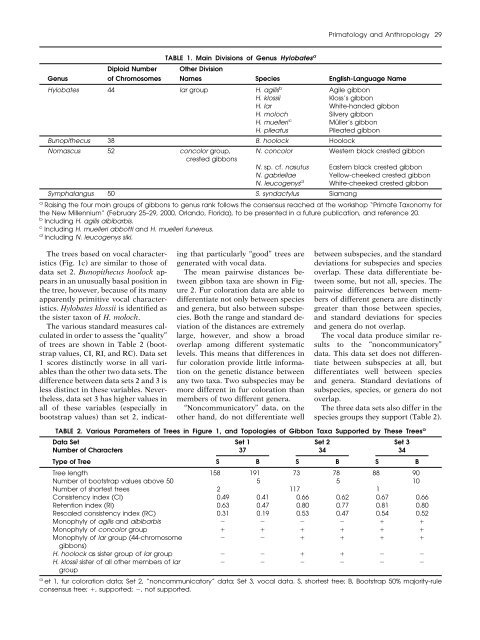
Primatology <strong>and</strong> Anthropology 29Diploid NumberTABLE 1. Main Divisions <strong>of</strong> Genus Hylobates aOther DivisionGenus<strong>of</strong> Chromosomes Names Species English-Language NameHylobates 44 lar group H. agilis b Agile gibbonH. klossii Kloss’s gibbonH. lar White-h<strong>and</strong>ed gibbonH. moloch Silvery gibbonH. muelleri c Müller’s gibbonH. pileatus Pileated gibbonBunopithecus 38 B. hoolock HoolockNomascus 52 concolor group, N. concolor Western black crested gibboncrested gibbonsN. sp. cf. nasutus Eastern black crested gibbonN. gabriellae Yellow-cheeked crested gibbonN. leucogenys d White-cheeked crested gibbonSymphalangus 50 S. syndactylus Siamanga Raising the four main groups <strong>of</strong> gibbons to genus rank follows the consensus reached at the workshop “Primate <strong>Taxonomy</strong> forthe New Millennium” (February 25–29, 2000, Orl<strong>and</strong>o, Florida), to be presented in a future publication, <strong>and</strong> reference 20.b Including H. agilis albibarbis.c Including H. muelleri abbotti <strong>and</strong> H. muelleri funereus.d Including N. leucogenys siki.The trees based on vocal characteristics(Fig. 1c) are similar to those <strong>of</strong>data set 2. Bunopithecus hoolock appearsin an unusually basal position inthe tree, however, because <strong>of</strong> its manyapparently primitive vocal characteristics.Hylobates klossii is identified asthe sister taxon <strong>of</strong> H. moloch.The various st<strong>and</strong>ard measures calculatedin order to assess the “quality”<strong>of</strong> trees are shown in Table 2 (bootstrapvalues, CI, RI, <strong>and</strong> RC). Data set1 scores distinctly worse in all variablesthan the other two data sets. Thedifference between data sets 2 <strong>and</strong> 3 isless distinct in these variables. Nevertheless,data set 3 has higher values inall <strong>of</strong> these variables (especially inbootstrap values) than set 2, indicatingthat particularly “good” trees aregenerated with vocal data.The mean pairwise distances betweengibbon taxa are shown in Figure2. Fur coloration data are able todifferentiate not only between species<strong>and</strong> genera, but also between subspecies.Both the range <strong>and</strong> st<strong>and</strong>ard deviation<strong>of</strong> the distances are extremelylarge, however, <strong>and</strong> show a broadoverlap among different systematiclevels. This means that differences infur coloration provide little informationon the genetic distance betweenany two taxa. Two subspecies may bemore different in fur coloration thanmembers <strong>of</strong> two different genera.“Noncommunicatory” data, on theother h<strong>and</strong>, do not differentiate wellbetween subspecies, <strong>and</strong> the st<strong>and</strong>arddeviations for subspecies <strong>and</strong> speciesoverlap. These data differentiate betweensome, but not all, species. Thepairwise differences between members<strong>of</strong> different genera are distinctlygreater than those between species,<strong>and</strong> st<strong>and</strong>ard deviations for species<strong>and</strong> genera do not overlap.The vocal data produce similar resultsto the “noncommunicatory”data. This data set does not differentiatebetween subspecies at all, butdifferentiates well between species<strong>and</strong> genera. St<strong>and</strong>ard deviations <strong>of</strong>subspecies, species, or genera do notoverlap.The three data sets also differ in thespecies groups they support (Table 2).TABLE 2. Various Parameters <strong>of</strong> Trees in Figure 1, <strong>and</strong> Topologies <strong>of</strong> Gibbon Taxa Supported by These Trees aData Set Set 1 Set 2 Set 3Number <strong>of</strong> Characters 37 34 34Type <strong>of</strong> Tree S B S B S BTree length 158 191 73 78 88 90Number <strong>of</strong> bootstrap values above 50 5 5 10Number <strong>of</strong> shortest trees 2 117 1Consistency index (CI) 0.49 0.41 0.66 0.62 0.67 0.66Retention index (RI) 0.63 0.47 0.80 0.77 0.81 0.80Rescaled consistency index (RC) 0.31 0.19 0.53 0.47 0.54 0.52Monophyly <strong>of</strong> agilis <strong>and</strong> albibarbis Monophyly <strong>of</strong> concolor group Monophyly <strong>of</strong> lar group (44-chromosome gibbons)H. hoolock as sister group <strong>of</strong> lar group H. klossii sister <strong>of</strong> all other members <strong>of</strong> largroup a et 1, fur coloration data; Set 2, “noncommunicatory” data; Set 3, vocal data. S, shortest tree; B, Bootstrap 50% majority-ruleconsensus tree; , supported; , not supported.