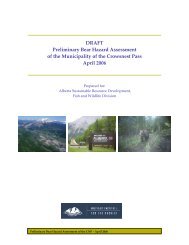
Crowsnest Pass Wildlife Mortality Report - Miistakis Institute for the ...
Crowsnest Pass Wildlife Mortality Report - Miistakis Institute for the ...
Crowsnest Pass Wildlife Mortality Report - Miistakis Institute for the ...

You also want an ePaper? Increase the reach of your titles
YUMPU automatically turns print PDFs into web optimized ePapers that Google loves.
<strong>Miistakis</strong> <strong>Institute</strong> <strong>for</strong> <strong>the</strong> RockiesH IGHWAY 3 WILDLIFE MORTALITYCONTENTSIntroduction 1Methods 2Data Limitations 3Results 3Discussion 8Special points of interest:• The analysis includes mortalitydata from 1997-2004from <strong>the</strong> Alberta/ BritishColumbia border to Lundbreck.INTRODUCTIONThe Municipality of <strong>Crowsnest</strong><strong>Pass</strong> is situated in a rare east-westcorridor bisecting <strong>the</strong> CanadianRocky Mountains in SW Alberta.Highway 3, which runs <strong>the</strong> lengthof <strong>the</strong> <strong>Pass</strong>, is a major transportationroute supporting over 6000vehicles per day. <strong>Wildlife</strong> mortality,due to collisions with vehicles,has been identified as amajor human safety and wildlifeconservation issue on this 44 kmstretch of highway with approximately109 large mammal deathseach year. It is important thatdecision makers acquire in<strong>for</strong>mationon where wildlife are mostlikely to cross <strong>the</strong> road to ensure effectivemitigation measures are implemented. Thisreport highlights <strong>the</strong> results of an analysisof eight years of wildlife mortality dataBighorn Sheep Grazing close to <strong>the</strong> Highway (M. Quinn)(1997-2004) collected by Volker Stevins from<strong>the</strong> Alberta/ British Columbia border extendingeast to Lundbreck, Alberta.• Deer account <strong>for</strong> 88% of<strong>the</strong> mortality records.• An average of 109 largemammals are killed eachyear.• Ten high collision zoneswere identified in <strong>the</strong> studyarea.M ETHODS<strong>Mortality</strong> data are collected daily alongHighway 3 by Volker Stevins, a contractorhired by Alberta Transportation to maintainHighway 3. Volker Stevin’s staff drive<strong>the</strong> road in <strong>the</strong> morning and evening to removewildlife killed on <strong>the</strong> highway. In<strong>for</strong>mationis recorded on <strong>the</strong> type of species,date (d/m/y), time (AM or PM), sex andlocation (distance from local landmarks) onhard copy <strong>for</strong>ms. The majority of recordsare <strong>for</strong> ungulates. Alberta Fish and <strong>Wildlife</strong>are contacted when a carnivore is killedand in<strong>for</strong>mation on <strong>the</strong> event is enteredinto <strong>the</strong> ENFOR database at <strong>the</strong> Fish and<strong>Wildlife</strong> office. ENFOR data were not includedin this analysis. Volkers Stevinsmortality data was obtained from AlbertaFish and <strong>Wildlife</strong> Blairmore office. The mortalitydata was entered into a GIS database.Location in<strong>for</strong>mation was entered as a distancein meters east or west from specifiedlocal landmarks. Local landmarks were givena spatial location by driving highway 3 andusing a global positioning system (GPS) tomark <strong>the</strong>ir location. A route processing wizardin ArcGIS was used to accurately placeeach morality point <strong>the</strong> appropriate distancefrom <strong>the</strong> specified landmark. The resultingdatabase was used to create graphs highlighting<strong>the</strong> total mortality per year, type of speciesand seasonal variations in mortality. Thespatial data were used to determine highmortality zones along Highway 3.
Page 2D ATA LIMITATIONSThere are a number of data limitations thatshould be considered when evaluating <strong>the</strong>results of this analysis. The true accuracyof each morality point is unknown. Thedata collected by Volker Stevins is describedin meters from a local landmark.As with any study that relies on humanestimates of distance, we are not sure of <strong>the</strong>accuracy level. O<strong>the</strong>r studies have documentedmortality points within 250 m segmentsor 1/10 of a mile. In our spatial analysiswe also used 250 m segments to representhigh collision areas. O<strong>the</strong>r data limitationsinclude missing data <strong>for</strong> <strong>the</strong> months of Apriland July 2001 and December and February2002. These data are missing from <strong>the</strong> analysisand represent an inconsistency and limitationof <strong>the</strong> database.R ESULTS<strong>Mortality</strong> (Number of Animals)180160140120100806040200<strong>Mortality</strong> per Year (1997-2004)1997 1998 1999 2000 2001 2002 2003 2004YearM O R T A L I T Y P E R Y E A RThe mortality data indicate that over <strong>the</strong>eight year period (1997-2004) an averageof 109 animals were killed per year. Thisis likely an underestimate because <strong>the</strong>calculation does not include animals(mainly carnivores) that are collected byAlberta Fish and <strong>Wildlife</strong>, animals thatare picked up by people <strong>for</strong> various purposesor injured animals that may wanderoff into <strong>the</strong> bush to die. Additionally,<strong>the</strong>re are data missing <strong>for</strong> 2001 and 2002,resulting in a lower overall average peryear.A VERAGE MORTALITY PER MONTH<strong>Mortality</strong>varies seasonallyin <strong>the</strong>region. Themortalitydata indicatesthat monthsof higher collisionsincludeFebruaryto Apriland Octoberto November.<strong>Mortality</strong> (average number per month)14121086420Average <strong>Mortality</strong> per Month (1997-2004)Jan Feb Mar Apr May Jun Jul Aug Sep Oct Nov DecMonth
Page 4H IGH COLLISION ZONES ALONG HIGHWAY3To assess high collision zones along Highway3 <strong>the</strong> highway was divided into 187,250 m segments. The total number of mortalityrecords occurring in each segmentwas summed. The mean number of mortalityrecords per segment was 8.57, with astandard deviation of 7.5. The data rangedfrom 0 to 37 total mortalities per segment.To determine high collision zones, we compared<strong>the</strong> spatial pattern exhibited by <strong>the</strong>mortality data with that expected from arandom distribution based on a Poissondistribution. Assuming a Poisson distributionand a significance level of 0.05, eachsegment is expected to have 0-14 mortalityrecords. This means that <strong>the</strong>re is a 95%chance of a segment having between 0 and14 mortality records assuming a Poissondistribution. High collision zones weredefined as a minimum of 2 adjacent segmentswith 15 or greater mortality records.This analysis includes total morality (all species).Based on <strong>the</strong>se criteria <strong>the</strong>re are 10high collision zones in <strong>the</strong> study area from<strong>the</strong> Alberta/British Columbia border toLundbreck, based on <strong>the</strong> mortality datafrom 1997-2004. The graph below depicts<strong>the</strong> segments along <strong>the</strong> y-axis and <strong>the</strong> numberof wildlife mortality records on <strong>the</strong> x-axis. The green line represents <strong>the</strong> cut off <strong>for</strong>expected results assuming a Poisson distribution.High Collision Zones on Highway 34035Number of Animals per segment3025201510501 9 17 25 33 41 49 57 65 73 81 89 97 105 113 121 129 137 145 153 161 169 177 185Segment Number (250 m)
Highway 3 <strong>Wildlife</strong> <strong>Mortality</strong>Page 5H IGH COLLISION ZONES ALONG HIGHWAY 3A new project, “RoadWatch in <strong>the</strong> <strong>Pass</strong>”provides <strong>the</strong> communitywith an opportunityto report <strong>the</strong>irwildlife observationsalong Highway 3 usingan on-line tool.This project will provideano<strong>the</strong>r valuablein<strong>for</strong>mation source onwildlife movement andcrossing locations. Thewebsite is www.rockies.ca/roadwatch.F OCUS AREA OF HIGH COLLISION ZONE 3The map above depicts allhigh collision zones alongHighway 3. High collisionzones are defined as 2 ormore adjacent segmentswith 15 or greater mortalityrecords. The zones are labeledfrom 1 through 10.Zones 1-6 occur within <strong>the</strong>Municipality of <strong>Crowsnest</strong><strong>Pass</strong>.The map to <strong>the</strong> right focuseson high collision zone 3 near<strong>the</strong> West Coleman assess.This type of in<strong>for</strong>mation isuseful when consideringhuman safety issues in <strong>the</strong><strong>Pass</strong>, because it reflectswhere collisions have beenmost prominent in <strong>the</strong> lasteight years.
Page 6M ORTALITY OCCURENCES ALONG HIGHWAY 3The map to <strong>the</strong> left depictstotal mortalityper 250m segment.The red bars illustrateproportional mortality,visually highlighting<strong>the</strong> high collisionzones.E LK HIGH COLLISION ZONESThe graph and maps represented on <strong>the</strong>previous page depict total mortality (88%deer). Species can be assessed separatelyto depict species-specific high collisionzones. Elk account <strong>for</strong> 5% of <strong>the</strong> mortalityrecords and are a species of managementinterest. Thegraph below depictshigh collisionzones <strong>for</strong> elk5based on <strong>the</strong>same methodologyused <strong>for</strong> <strong>the</strong>4total mortalityhigh collision3zones. The meanmortality per250m segment2was 0.223 with astandard deviationof 0.717.1<strong>Mortality</strong> recordsper segment0ranged from 0-4.There<strong>for</strong>e any<strong>Mortality</strong> (Number of Elk)segment with 1 or greater mortality recordsoccurring in 2 or more adjacent segments isconsidered a high collision zone. Based on<strong>the</strong>se assumptions <strong>the</strong>re are five high collisionzones <strong>for</strong> elk.High Collision Zones <strong>for</strong> Elk along Highway 31 8 15 22 29 36 43 50 57 64 71 78 85 92 99 106 113 120 127 134 141 148 155 162 169 176 183Segment Number
Highway 3 <strong>Wildlife</strong> <strong>Mortality</strong> Page 7E LK HIGH COLLISION ZONES ALONG HIGHWAY 3E LK FOCUS AREA OF COLLISION ZONES 3 AND 4The map at <strong>the</strong>top of <strong>the</strong> pagedepicts spatially<strong>the</strong> high collisionzonesalong Highway3 <strong>for</strong> elk. All <strong>the</strong>five zones occurwithin <strong>the</strong> Municipalityof<strong>Crowsnest</strong> <strong>Pass</strong>.The map to <strong>the</strong>right focuses inon high collisionzones 3and 4.
D ISCUSSIONAtlas Sawmill in <strong>the</strong> <strong>Crowsnest</strong> <strong>Pass</strong> (M. Quinn)<strong>Miistakis</strong> <strong>Institute</strong> <strong>for</strong> <strong>the</strong>Rockies,C/o EVDS, University ofCalgary2500 University Drive NWCalgary, Alberta, T2N 1N4T: 403-220-8968E: institute@rockies.caIt is important that decision makers and<strong>the</strong> community of <strong>the</strong> <strong>Crowsnest</strong> <strong>Pass</strong> haveaccess to in<strong>for</strong>mation regarding <strong>the</strong> locationof collision zones along Highway 3.This in<strong>for</strong>mation is important when addressinghuman safety through <strong>the</strong> developmentof mitigation measures to reducevehicle and wildlife collisions. The collisionzones along Highway 3 identified by<strong>the</strong> mortality data are based on 877 mortalityrecords from 1997-2004. Eighty-eightpercent of <strong>the</strong> records are comprised ofdeer. Zones of high collision may belinked to habitat variables or road characteristics,such as curvature and line ofsight. Characteristics associated with <strong>the</strong>sezones were not assessed in this report.The in<strong>for</strong>mation presented in this report isACKNOWLEDGEMENTSimportant <strong>for</strong> decision makers to identifyboth general and species-specific movementareas. As an example, we highlighted highcollision zones <strong>for</strong> elk. There were 42 mortalityrecords <strong>for</strong> elk over <strong>the</strong> eight year period.There were not enough mortality records <strong>for</strong>Bighorn sheep to run a similar analysis.The mortality data presented in this reportrepresents one in<strong>for</strong>mation source of in<strong>for</strong>mationthat focuses on wildlife and Highway3. However, it does not contain sufficient in<strong>for</strong>mation<strong>for</strong> carnivores. O<strong>the</strong>r data sets thatprovide insight on crossing locations in thisregion will greatly enhance <strong>the</strong> knowledgebase needed by decision makers.The in<strong>for</strong>mation in this unsolicited reportwas prepared <strong>for</strong> <strong>the</strong> community of <strong>the</strong><strong>Crowsnest</strong> <strong>Pass</strong>.<strong>Miistakis</strong> would like to acknowledge <strong>the</strong> assistance of Jim Clark, from <strong>the</strong> Alberta Fishand <strong>Wildlife</strong> Blairmore office, Chester Markowski, from Volker Stevins ContractingLtd. and Janet Quinn from Road Watch in <strong>the</strong> <strong>Pass</strong> in providing <strong>Miistakis</strong> with <strong>the</strong>mortality data.