Gender differences in the use of computers and the Internet
Gender differences in the use of computers and the Internet
Gender differences in the use of computers and the Internet

Create successful ePaper yourself
Turn your PDF publications into a flip-book with our unique Google optimized e-Paper software.
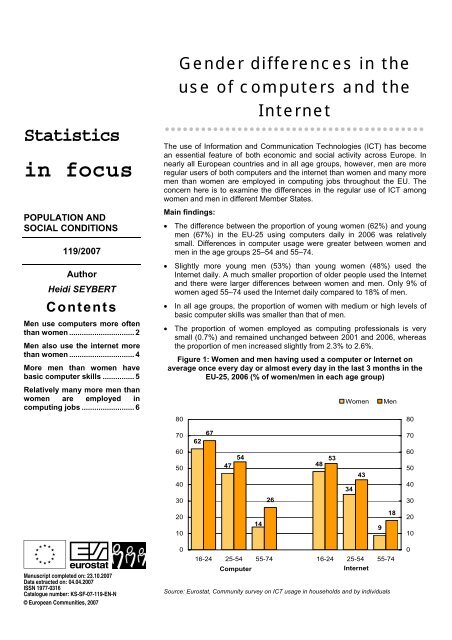
Men <strong>use</strong> <strong>computers</strong> more <strong>of</strong>ten than womenA larger proportion <strong>of</strong> men than women <strong>use</strong> <strong>computers</strong>on a regular basis. In <strong>the</strong> European Union as a whole,some 48% <strong>of</strong> men aged 16–74 surveyed <strong>in</strong> 2006reported us<strong>in</strong>g a computer at least once a day dur<strong>in</strong>g<strong>the</strong> preced<strong>in</strong>g three months as opposed to 39% <strong>of</strong>women (Fig. 2).Figure 2: Women <strong>and</strong> men hav<strong>in</strong>g <strong>use</strong>d a computer on average every day or almost every day <strong>in</strong> <strong>the</strong> last 3months, 2006 (% <strong>of</strong> women/men 16-74 years)WomenMen8080707060605050404030302020101000EU-25BEBGCZDKDEIEEEELESITCYLVLTLUHUNLATPLPTSISKFISEUKISNOSource: Eurostat, Community survey on ICT usage <strong>in</strong> ho<strong>use</strong>holds <strong>and</strong> by <strong>in</strong>dividualsNote: FR, MT, RO: no data availableOnly <strong>in</strong> Cyprus was <strong>the</strong> proportion <strong>of</strong> women us<strong>in</strong>g acomputer on a daily basis marg<strong>in</strong>ally larger than formen; <strong>in</strong> three countries — Bulgaria, Estonia <strong>and</strong>Lithuania — <strong>the</strong> proportion was <strong>the</strong> same. In <strong>the</strong> o<strong>the</strong>rMember States, <strong>the</strong> gap <strong>in</strong> frequency <strong>of</strong> <strong>use</strong> betweenmen <strong>and</strong> women varies considerably. In Luxembourg,<strong>the</strong> proportion <strong>of</strong> men us<strong>in</strong>g a computer daily was 24percentage po<strong>in</strong>ts higher than for women <strong>and</strong> <strong>in</strong>Germany, Italy, <strong>the</strong> Ne<strong>the</strong>rl<strong>and</strong>s, Austria <strong>and</strong> <strong>the</strong> UnitedK<strong>in</strong>gdom, 10–14 percentage po<strong>in</strong>ts higher. In all <strong>the</strong>new Member States, except Malta <strong>and</strong> Romania, forwhich data are not available, <strong>and</strong> with <strong>the</strong> partialexception <strong>of</strong> Slovenia (where <strong>the</strong> gap was 8 percentagepo<strong>in</strong>ts), <strong>the</strong>re was only a small difference <strong>in</strong> <strong>the</strong> daily<strong>use</strong> <strong>of</strong> <strong>computers</strong> between women <strong>and</strong> men — smallerthan <strong>in</strong> all EU-15 countries apart from Irel<strong>and</strong>, Denmark<strong>and</strong> F<strong>in</strong>l<strong>and</strong>.Across countries, <strong>the</strong> proportions <strong>of</strong> women <strong>and</strong> menus<strong>in</strong>g <strong>computers</strong> daily varied from around 60% or more<strong>in</strong> Denmark, <strong>the</strong> Ne<strong>the</strong>rl<strong>and</strong>s <strong>and</strong> Sweden, as well as <strong>in</strong>Icel<strong>and</strong> <strong>and</strong> Norway (<strong>and</strong> Luxembourg <strong>and</strong> F<strong>in</strong>l<strong>and</strong> formen only) to 20% <strong>in</strong> Bulgaria <strong>and</strong>, for women only, <strong>in</strong>Greece.The gap <strong>in</strong> usage between men <strong>and</strong> women across <strong>the</strong>EU-25 does not change much if those us<strong>in</strong>g a computerat less frequent <strong>in</strong>tervals are also <strong>in</strong>cluded. At EU-25level, an additional 12% <strong>of</strong> women <strong>and</strong> men <strong>use</strong>d acomputer at least once a week, while a fur<strong>the</strong>r 4–5% <strong>of</strong>both women <strong>and</strong> men did so at least once a month.Differences <strong>in</strong> computer usage between men <strong>and</strong>women are more significant <strong>in</strong> older age groupsThe gap between men <strong>and</strong> women <strong>in</strong> <strong>the</strong> <strong>use</strong> <strong>of</strong><strong>computers</strong> is repeated for each broad age group,though it is more significant <strong>in</strong> older age groups where<strong>the</strong> overall scale <strong>of</strong> <strong>use</strong> decl<strong>in</strong>es. For young peopleaged 16–24 some 62% <strong>of</strong> women <strong>in</strong> <strong>the</strong> EU-25 <strong>use</strong> acomputer daily as opposed to 67% <strong>of</strong> men, but <strong>the</strong> gapnarrows to only 2 percentage po<strong>in</strong>ts if those us<strong>in</strong>g oneat least once a week are <strong>in</strong>cluded as well (Table 1).2 Statistics <strong>in</strong> focus — Population <strong>and</strong> social conditions — 119/2007 ________________________________________
Table 1: Proportion <strong>of</strong> women <strong>and</strong> men who <strong>use</strong>d a computer on average once a day <strong>and</strong> at least once a week <strong>in</strong> <strong>the</strong>last three months by age, 200616-24 25-5455-74on average daily or on average at least on average daily or on average at least on average daily or on average at leastalmost once a week almost once a week almost once a weekWomen Men Women Men Women Men Women Men Women Men Women MenEU-25 62 67 81 83 47 54 60 66 14 26 21 35BE 68 71 86 84 56 62 70 75 15 30 24 39BG 38 38 59 57 25 22 33 29 4 5 5 7CZ 44 51 75 77 36 33 50 50 7 13 12 21DK 76 85 91 100 79 80 89 91 45 54 60 67DE 68 76 91 93 57 66 77 81 22 36 33 49IE 43 42 72 65 41 46 57 59 11 14 22 23EE 75 74 92 90 50 44 69 63 13 13 18 21EL 43 43 65 69 24 33 33 43 2 8 3 11ES 52 56 76 78 35 43 49 58 5 14 9 19FR : : : : : : : : : : : :IT 64 67 67 69 39 51 40 52 6 19 6 19CY 62 37 82 66 35 38 41 45 6 12 7 15LV 66 66 83 89 41 37 57 51 9 8 13 14LT 59 62 83 84 34 28 48 43 5 6 8 9LU 67 77 92 95 49 72 68 86 15 51 26 61HU 61 66 84 87 47 45 60 57 14 16 17 22MT : : : : : : : : : : : :NL 81 89 96 97 70 78 86 90 30 48 43 62AT 72 72 89 87 52 66 68 78 14 31 21 39PL 56 64 82 83 32 31 45 44 5 9 8 13PT 60 64 78 79 31 37 40 46 4 10 : 13RO : : : : : : : : : : : :SI 68 72 87 87 48 52 60 62 6 20 8 24SK 50 69 80 87 50 48 64 63 9 13 15 19FI 78 81 93 93 69 70 86 83 29 37 40 50SE 77 80 95 95 68 78 88 92 36 47 55 64UK 61 63 77 77 54 65 70 80 20 33 33 49IS 85 89 96 96 81 77 93 90 41 60 55 72NO 78 86 96 98 68 76 87 90 38 50 51 60Source: Eurostat, Community survey on ICT usage <strong>in</strong> ho<strong>use</strong>holds <strong>and</strong> by <strong>in</strong>dividualsThere are marked variations <strong>in</strong> <strong>the</strong> scale <strong>of</strong> daily <strong>use</strong>across <strong>the</strong> Member States, with <strong>the</strong> proportion be<strong>in</strong>garound 75% or more for both young women <strong>and</strong> youngmen <strong>in</strong> Denmark, Estonia, <strong>the</strong> Ne<strong>the</strong>rl<strong>and</strong>s, F<strong>in</strong>l<strong>and</strong> <strong>and</strong>Sweden, as well as <strong>in</strong> Icel<strong>and</strong> <strong>and</strong> Norway, but below40% <strong>in</strong> Bulgaria.The scale <strong>of</strong> daily computer <strong>use</strong> among 25–54 yearolds varies more widely between countries than among<strong>the</strong> younger group. The proportion ranged from nearly70% or more for both men <strong>and</strong> women <strong>in</strong> Denmark, <strong>the</strong>Ne<strong>the</strong>rl<strong>and</strong>s, F<strong>in</strong>l<strong>and</strong> <strong>and</strong> Sweden, as well as Icel<strong>and</strong><strong>and</strong> Norway, to under 35% <strong>in</strong> Bulgaria, Greece,Lithuania <strong>and</strong> Pol<strong>and</strong>. The average <strong>in</strong> <strong>the</strong> EU as awhole was 47% for women <strong>and</strong> 54% for men.For those aged 25–54, <strong>the</strong> difference <strong>in</strong> daily <strong>use</strong>between men <strong>and</strong> women is wider than for <strong>the</strong> 16–24age group (some 7 percentage po<strong>in</strong>ts aga<strong>in</strong>st 5percentage po<strong>in</strong>ts). Conversely, <strong>in</strong> 8 Member States (all<strong>of</strong> <strong>the</strong>m new ones) <strong>and</strong> Icel<strong>and</strong>, <strong>the</strong> proportion <strong>of</strong>women us<strong>in</strong>g a computer at least once a day washigher than for men. This contrasts with <strong>the</strong> situation <strong>in</strong>Luxembourg, Austria, Sweden <strong>and</strong> <strong>the</strong> UK, where <strong>the</strong>proportion <strong>of</strong> women <strong>in</strong> this age group us<strong>in</strong>g <strong>computers</strong>daily was markedly below that <strong>of</strong> men (10 percentagepo<strong>in</strong>ts or more), though this was still above <strong>the</strong> EU-25average.The scale <strong>of</strong> <strong>use</strong> among those aged 55–74 issubstantially lower than among <strong>the</strong> younger groups,with average daily <strong>use</strong> at only 26% for men <strong>and</strong> just14% for women <strong>in</strong> <strong>the</strong> EU-25. Denmark, <strong>the</strong>Ne<strong>the</strong>rl<strong>and</strong>s, F<strong>in</strong>l<strong>and</strong> <strong>and</strong> Sweden (toge<strong>the</strong>r with Icel<strong>and</strong><strong>and</strong> Norway) st<strong>and</strong> out with 29% or more <strong>of</strong> women <strong>and</strong>37% or more <strong>of</strong> men us<strong>in</strong>g <strong>computers</strong> <strong>in</strong> this age group.There are no countries, except Latvia to a very smallextent, where <strong>the</strong> proportion <strong>of</strong> women us<strong>in</strong>g acomputer was larger than for men, though it was <strong>the</strong>same or virtually <strong>the</strong> same as for men <strong>in</strong> Estonia,Bulgaria <strong>and</strong> Lithuania.________________________________________ 119/2007 — Population <strong>and</strong> social conditions — Statistics <strong>in</strong> focus 3
The frequency <strong>of</strong> <strong>in</strong>ternet <strong>use</strong> among women <strong>and</strong> menis similar to that <strong>of</strong> <strong>computers</strong>, with once aga<strong>in</strong> asignificant gap between <strong>the</strong> proportion <strong>of</strong> men <strong>and</strong>women us<strong>in</strong>g it on a daily basis <strong>in</strong> <strong>the</strong> EU-25 as awhole. The proportion <strong>of</strong> men averaged 38% as aga<strong>in</strong>st28% <strong>of</strong> women (Fig. 3). In all EU Member States moreMen also <strong>use</strong> <strong>the</strong> <strong>in</strong>ternet more than womenmen than women <strong>use</strong> <strong>the</strong> <strong>in</strong>ternet on average at leastonce a day. However, <strong>the</strong> difference between <strong>the</strong>shares <strong>of</strong> men <strong>and</strong> women us<strong>in</strong>g <strong>the</strong> <strong>in</strong>ternet was only 7percentage po<strong>in</strong>ts or less <strong>in</strong> all <strong>the</strong> new Member States,Irel<strong>and</strong>, Greece, France, Portugal <strong>and</strong> F<strong>in</strong>l<strong>and</strong> as wellas Icel<strong>and</strong>.Figure 3: Women <strong>and</strong> men hav<strong>in</strong>g <strong>use</strong>d <strong>the</strong> <strong>Internet</strong> on average every day or almost every day <strong>in</strong> <strong>the</strong> last 3months, 2006 (% <strong>of</strong> women/men 16-74 years)% <strong>of</strong> women/men 16-74 yearsWomenMen8080707060605050404030302020101000EU-25BEBGCZDKDEIEEEELESFRITCYLVLTLUHUNLATPLPTSISKFISEUKISNOSource: Eurostat, Community survey on ICT usage <strong>in</strong> ho<strong>use</strong>holds <strong>and</strong> by <strong>in</strong>dividualsNote: MT, RO: no data availableTable 2: Proportion <strong>of</strong> women <strong>and</strong> men who <strong>use</strong>d <strong>the</strong> <strong>Internet</strong> on average once a day <strong>and</strong> at least once a week <strong>in</strong> <strong>the</strong>last three months by age, 200616-24 25-5455-74on average daily on average at least on average daily on average at least on average daily on average at leastor almost once a week or almost once a week or almost once a weekWomen Men Women Men Women Men Women Men Women Men Women MenEU-25 48 53 73 73 34 43 50 58 9 18 15 26BE 66 67 83 81 47 55 64 70 13 26 20 34BG 27 31 45 48 16 17 25 24 2 3 3 5CZ 28 38 64 66 18 22 38 41 3 7 8 16DK 71 82 92 95 72 77 85 88 36 49 51 60DE 53 65 82 85 40 53 65 73 11 24 22 37IE 33 32 61 57 25 34 46 51 7 10 16 18EE 74 72 91 89 46 41 67 61 11 12 17 19EL 22 19 44 49 13 20 21 32 1 4 1 7ES 41 44 68 71 23 33 40 49 3 10 6 15FR 41 42 73 69 30 36 45 50 6 11 10 16IT 49 54 54 57 30 41 31 43 4 13 4 14CY 34 22 63 47 18 27 27 36 2 6 4 10LV 61 59 85 88 35 33 52 47 7 8 11 12LT 46 48 75 78 27 22 42 36 3 5 7 7LU 58 68 87 91 39 63 61 81 12 43 20 55HU 45 46 74 74 33 33 47 46 9 13 12 17MT : : : : : : : : : : : :NL 76 88 94 98 63 75 82 89 23 43 36 58AT 58 61 80 80 36 53 57 68 9 24 16 33PL 40 47 69 72 22 23 34 35 3 7 6 10PT 47 50 68 69 21 27 31 38 : 7 : :RO : : : : : : : : : : : :SI 65 68 79 83 39 43 52 56 4 16 6 19SK 33 47 65 78 28 32 44 49 4 7 7 12FI 78 80 94 93 64 68 84 80 23 30 34 43SE 77 77 94 94 63 74 86 91 29 47 48 65UK 50 50 72 71 40 54 59 74 13 26 25 41IS 84 86 95 97 76 76 91 88 34 57 48 70NO 69 81 96 99 57 72 81 87 30 44 43 53Source: Eurostat, Community survey on ICT usage <strong>in</strong> ho<strong>use</strong>holds <strong>and</strong> by <strong>in</strong>dividuals4 Statistics <strong>in</strong> focus — Population <strong>and</strong> social conditions — 119/2007 ________________________________________
In most <strong>of</strong> <strong>the</strong> new Member States, <strong>the</strong> scale <strong>of</strong> <strong>use</strong> waslower than <strong>the</strong> EU-25 average. This contrasts withusage <strong>in</strong> <strong>the</strong> Nordic Member States (Denmark, F<strong>in</strong>l<strong>and</strong><strong>and</strong> Sweden), <strong>the</strong> Ne<strong>the</strong>rl<strong>and</strong>s as well as Icel<strong>and</strong> <strong>and</strong>Norway, where over 50% <strong>of</strong> women <strong>use</strong>d <strong>the</strong> <strong>Internet</strong>,<strong>the</strong> highest shares <strong>in</strong> <strong>the</strong> EU.As with <strong>the</strong> <strong>use</strong> <strong>of</strong> <strong>computers</strong>, <strong>use</strong> <strong>of</strong> <strong>the</strong> <strong>in</strong>ternetdecl<strong>in</strong>es <strong>in</strong> older age groups, though <strong>the</strong> gap betweenmen <strong>and</strong> women does not widen as much. In 2006, anaverage <strong>of</strong> 48% <strong>of</strong> women aged 16–24 <strong>use</strong>d <strong>the</strong> <strong>in</strong>ternetdaily as opposed to 53% <strong>of</strong> men (Table 2). The figurefor women ranged from over 70% <strong>in</strong> Denmark, Estonia,<strong>the</strong> Ne<strong>the</strong>rl<strong>and</strong>s, F<strong>in</strong>l<strong>and</strong> <strong>and</strong> Sweden, along withIcel<strong>and</strong>, to under 30% <strong>in</strong> Bulgaria, <strong>the</strong> Czech Republic<strong>and</strong> Greece.Among 25–54 year-olds, daily <strong>use</strong> <strong>of</strong> <strong>the</strong> <strong>in</strong>ternet falls to34% <strong>of</strong> women <strong>and</strong> 43% <strong>of</strong> men, with <strong>the</strong> proportion <strong>of</strong><strong>use</strong>rs among women exceed<strong>in</strong>g that <strong>of</strong> men <strong>in</strong> onlythree countries, Estonia, Latvia <strong>and</strong> Lithuania.Among those aged 55–74, <strong>the</strong> proportion <strong>of</strong> daily<strong>in</strong>ternet <strong>use</strong>rs decl<strong>in</strong>es even fur<strong>the</strong>r to 18% <strong>of</strong> men <strong>and</strong>only 9% <strong>of</strong> women. For this age group, moreover, <strong>the</strong>relative number <strong>of</strong> women <strong>use</strong>rs was lower than that <strong>of</strong>men <strong>in</strong> all countries.More men than women have basic computer skillsThe gap between men <strong>and</strong> women is even wider forbasic computer skills than <strong>in</strong> <strong>the</strong> take-up <strong>and</strong> <strong>use</strong> <strong>of</strong> ICT.In 2006, almost half <strong>of</strong> young men aged 16–24surveyed <strong>in</strong> <strong>the</strong> EU-25 were considered to have highskills as opposed to only 30% <strong>of</strong> women (Table 3).Table 3: Proportion <strong>of</strong> women <strong>and</strong> men by age <strong>and</strong> level <strong>of</strong> basic computer skills, 2006While <strong>the</strong>re were 7 Member States where 60% or more<strong>of</strong> men <strong>in</strong> this age group had high computer skills <strong>and</strong>ano<strong>the</strong>r 6 where <strong>the</strong> figure was over 50%, only <strong>in</strong>Austria <strong>and</strong> Slovenia were more than 50% <strong>of</strong> youngwomen considered to have such skills.16-24 25-5455-74High At least medium High At least medium High At least mediumWomen Men Women Men Women Men Women Men Women Men Women MenEU-25 30 48 73 78 18 34 47 57 3 12 13 25BE 28 44 68 70 17 32 46 57 3 12 11 27BG 10 17 41 39 5 8 22 21 1 1 3 5CZ 25 40 66 70 10 19 38 38 2 7 11 18DK 41 75 88 95 28 57 72 82 11 32 39 55DE 29 59 82 88 21 42 61 72 4 16 23 38IE 24 24 41 34 18 26 31 34 3 6 8 10EE 42 60 76 75 21 30 47 45 0 8 9 13EL 33 40 65 62 15 21 32 36 1 3 3 8ES 35 48 78 79 20 33 45 53 2 7 7 16FR 27 44 76 82 19 35 50 60 3 10 10 19IT 25 39 62 65 13 28 34 47 1 7 5 15CY 41 35 78 61 15 24 38 40 2 6 5 11LV 23 36 66 72 8 14 33 31 1 2 7 7LT 32 51 76 77 11 17 38 32 1 2 7 6LU 48 73 85 95 22 56 54 80 3 27 15 49HU 47 58 83 80 23 31 53 50 5 10 15 19MT : : : : : : : : : : : :NL 30 66 82 93 23 54 57 81 4 20 18 46AT 51 64 82 87 20 48 53 71 3 17 14 34PL 20 34 63 68 7 14 27 31 1 2 5 7PT 46 53 74 75 17 26 34 39 0 6 4 12RO : : : : : : : : : : : :SI 56 73 89 93 21 37 50 56 2 9 7 20SK 15 47 74 81 10 26 48 52 1 4 10 15FI 28 58 76 90 25 44 65 70 6 16 20 31SE 30 60 77 87 20 50 61 79 6 19 36 45UK 35 51 74 81 22 40 54 69 6 18 21 36IS 27 58 89 90 34 49 76 77 6 26 32 54NO 38 69 84 98 30 53 63 77 12 18 32 39Source: Eurostat, Community survey on ICT usage <strong>in</strong> ho<strong>use</strong>holds <strong>and</strong> by <strong>in</strong>dividuals________________________________________ 119/2007 — Population <strong>and</strong> social conditions — Statistics <strong>in</strong> focus 5
Computer skills for women <strong>and</strong> men aged 25–54 tend tobe lower than for <strong>the</strong> younger age group. In <strong>the</strong> EU as awhole, around a third <strong>of</strong> men but only 18% <strong>of</strong> womenwere recorded as hav<strong>in</strong>g high skills <strong>and</strong> <strong>in</strong> all countries,more men than women have <strong>the</strong>se skills. The differencebetween men <strong>and</strong> women amounted to 20 percentagepo<strong>in</strong>ts or more <strong>in</strong> Denmark, Germany, Luxembourg, <strong>the</strong>Ne<strong>the</strong>rl<strong>and</strong>s, Austria <strong>and</strong> Sweden as well as <strong>in</strong> Norway.For <strong>the</strong> 55–74 age group, only 3% <strong>of</strong> women <strong>in</strong> <strong>the</strong>EU-25 had high computer skills compared with 12% <strong>of</strong>men. In most countries, <strong>the</strong> proportion <strong>of</strong> women withhigh computer skills was under 10%, except <strong>in</strong> Denmark<strong>and</strong> Norway, while for men, <strong>the</strong> proportion with highskills was 10% or more <strong>in</strong> 11 Member States <strong>and</strong> <strong>in</strong>Icel<strong>and</strong> <strong>and</strong> Norway. The gap between men <strong>and</strong> womenwas also particularly wide (12 percentage po<strong>in</strong>ts ormore) <strong>in</strong> <strong>the</strong> same Member States as for <strong>the</strong> 25–54 agegroup as well as <strong>in</strong> <strong>the</strong> United K<strong>in</strong>gdom.Relatively many more men than women are employed <strong>in</strong> comput<strong>in</strong>g jobsMany more men than women are employed <strong>in</strong>comput<strong>in</strong>g jobs across <strong>the</strong> EU-25. In 2006, some 2.6%<strong>of</strong> men <strong>in</strong> employment <strong>in</strong> <strong>the</strong> EU worked as comput<strong>in</strong>gpr<strong>of</strong>essionals or as "computer associate pr<strong>of</strong>essionals"(ISCO categories 213 <strong>and</strong> 312). This is almost fourtimes <strong>the</strong> proportion <strong>of</strong> women (0.7%). While <strong>the</strong> scale<strong>of</strong> <strong>the</strong> difference varies across countries, <strong>the</strong> proportion <strong>of</strong>men <strong>in</strong> employment work<strong>in</strong>g <strong>in</strong> <strong>the</strong>se occupationsexceeded <strong>the</strong> proportion <strong>of</strong> women <strong>in</strong> all Member Statesfor which data are available (Table 4). In Bulgaria, <strong>the</strong>Ne<strong>the</strong>rl<strong>and</strong>s, Austria <strong>and</strong> Portugal, this difference wasmore than 5 to 1 <strong>and</strong> only <strong>in</strong> Latvia <strong>and</strong> Romania was itless than 2 to 1 (though <strong>in</strong> Bulgaria, Austria <strong>and</strong> Latvia<strong>the</strong> numbers are relatively uncerta<strong>in</strong>).No change <strong>in</strong> <strong>the</strong> share <strong>of</strong> women employed <strong>in</strong>comput<strong>in</strong>g jobs <strong>in</strong> 2001–2006The gap between men <strong>and</strong> women employed <strong>in</strong>comput<strong>in</strong>g jobs has tended to widen ra<strong>the</strong>r than narrowover time. In <strong>the</strong> five years 2001–2006, <strong>the</strong> proportion <strong>of</strong>men work<strong>in</strong>g <strong>in</strong> comput<strong>in</strong>g jobs <strong>in</strong> <strong>the</strong> EU <strong>in</strong>creased by0.3 <strong>of</strong> a percentage po<strong>in</strong>t, whereas <strong>the</strong> proportion <strong>of</strong>women rema<strong>in</strong>ed at 0.7%.Table 4: Employment <strong>in</strong> comput<strong>in</strong>g activities by sex,2001 <strong>and</strong> 2006 (% <strong>of</strong> women/men <strong>in</strong> all occupations)2001 2006 % po<strong>in</strong>t change2001-06Women Men Women Men Women MenEU-25 0.7 2.3 0.7 2.6 0.0 0.3BE 0.5 2.6 0.6 2.8 0.1 0.1BG (0.9) (4.9) (0.8) 4.8 (0.0) -(0.1)CZ 0.9 2.3 0.6 2.8 -0.3 0.5DK 0.9 3.2 1.1 3.8 0.2 0.6DE 0.7 2.5 0.7 2.9 0.0 0.4EE . . . (2.6) . .IE 0.9 1.6 0.6 1.6 -0.3 0.1EL 0.3 0.4 0.3 0.7 0.0 0.3ES 0.6 1.4 0.6 2.0 0.0 0.5FR 0.7 2.8 0.7 2.6 0.0 -0.1IT 0.6 1.4 0.6 1.9 0.0 0.5CY (0.5) 1.2 (0.5) 1.0 . -0.2LV . . (1.4) 1.8 . .LT . 0.7 . . . .LU (1.0) 2.7 . 3.2 . 0.4HU 0.6 1.6 0.5 2.4 0.0 0.8MT : : . (1.6) : :NL 0.9 4.9 0.8 4.8 0.0 -0.1AT 0.6 2.6 (0.4) 2.7 -(0.2) 0.2PL 0.5 1.2 0.5 1.7 0.0 0.5PT (0.5) 1.2 0.3 1.8 . 0.6RO : : 0.5 0.6 : :SI (0.4) (1.5) (0.7) 3.3 (0.3) (1.8)SK 0.6 1.6 0.9 2.6 0.3 0.9FI 1.2 3.0 1.3 4.0 0.1 1.0SE 1.4 5.2 1.5 4.9 0.0 -0.3UK 1.0 3.4 0.8 3.3 -0.2 -0.1HR : : . (1.1) : :IS . 3.3 . 3.7 . 0.4NO 0.8 3.9 1.0 4.0 0.2 0.1CH 0.8 4.7 0.7 5.0 0.0 0.3Note: LU, CH <strong>and</strong> IS 2005. Figures <strong>in</strong> brackets: uncerta<strong>in</strong> reliabilitySource: Eurostat, Labour Force Survey, 2nd quarter, 20066 Statistics <strong>in</strong> focus — Population <strong>and</strong> social conditions — 119/2007 ________________________________________
Fur<strong>the</strong>r <strong>in</strong>formation:Data: EUROSTAT Website/Home page/Population <strong>and</strong> social conditions/DataPopulation <strong>and</strong> social conditionsInformation society statisticsPolicy <strong>in</strong>dicatorsInformation society: Structural IndicatorsTelecommunication servicesComputers <strong>and</strong> <strong>the</strong> <strong>Internet</strong> <strong>in</strong> ho<strong>use</strong>holds <strong>and</strong> enterprisesE-Commerce by <strong>in</strong>dividuals <strong>and</strong> enterprisesE-skills <strong>of</strong> <strong>in</strong>dividualsor see Eurostat’s dedicated website:http://epp.eurostat.ec.europa.eu/portal/page?_pageid=2973,64549069,2973_64553608&_dad=portal&_schema=PORTALJournalists can contact <strong>the</strong> media support service:Bech Build<strong>in</strong>g Office A4/125L - 2920 LuxembourgTel. (352) 4301 33408Fax (352) 4301 35349E-mail: eurostat-mediasupport@ec.europa.euEuropean Statistical Data Support:Eurostat set up with <strong>the</strong> members <strong>of</strong> <strong>the</strong> ‘Europeanstatistical system’ a network <strong>of</strong> support centres, whichwill exist <strong>in</strong> nearly all Member States as well as <strong>in</strong> someEFTA countries.Their mission is to provide help <strong>and</strong> guidance to <strong>Internet</strong><strong>use</strong>rs <strong>of</strong> European statistical data.Contact details for this support network can be found onour <strong>Internet</strong> site: http://ec.europa.eu/eurostat/A list <strong>of</strong> worldwide sales outlets is available at <strong>the</strong>:Office for Official Publications <strong>of</strong> <strong>the</strong> EuropeanCommunities.2, rue MercierL - 2985 LuxembourgFor fur<strong>the</strong>r <strong>in</strong>formation <strong>and</strong> methodologyHeidi SeybertEurostat / L-2920 LuxembourgTel: (+ 352) 4301 37416E-mail: Heidi.Seybert@ec.europa.euURL: http://publications.europa.euE-mail: <strong>in</strong>fo@publications.europa.euManuscript prepared <strong>in</strong> cooperation with Fadila Sanoussi <strong>and</strong> Terry Ward.Файл загружен с http://www.ifap.ru