Ten Year Capital Improvement Program - Contra Costa Water District
Ten Year Capital Improvement Program - Contra Costa Water District
Ten Year Capital Improvement Program - Contra Costa Water District

Create successful ePaper yourself
Turn your PDF publications into a flip-book with our unique Google optimized e-Paper software.
ZBV ZÜRCHER STUDIENGESELLSCHAFT FÜR BAU- UND VERKEHRSFRAGENWinter 07/08 Stadt - Land - Schaft - LimmattalMontag, 21. Januar 2008, 17:30 - 19:00Landschaft Limmattal - Rückgrat oder Restfläche?ZBV 21. Januar 2008Monika Schenk, quadra gmbh, Zürich
Project TeamFran Garland, Principal PlannerWayne Niehus, Rate and Financial AnalystJeff Quimby, Principal EngineerLars Sandberg, Project Controls Manager
Table of ContentsI. Executive Summary............................................................... I-12008-2017 CIP Update .............................................. I-1CIP Structure.............................................................. I-2<strong>Program</strong> Highlights.................................................... I-3Operation and Maintenance Costs…………………. I-6Financial Highlights................................................... I-7II. Background ........................................................................... II-1<strong>District</strong> Mission and Goals ........................................ II-1Existing Facilities and Operations… ......................... II-3III. CIP Context and Structure. .................................................... III-1Financial Planning Context........................................ III-1CIP Structure.............................................................. III-2Development of the CIP and Financial Plan ............. III-5IV. <strong>Program</strong> Summary ................................................................. IV-1Administrative, Support and Maintenance Facility…<strong>Program</strong>…………………………………………….. IV-2Delta Projects............................................................. IV-5Equipment and Other <strong>Capital</strong> Purchases <strong>Program</strong>..... IV-7Expansion of Services <strong>Program</strong>................................. IV-9Future <strong>Water</strong> Supplies <strong>Program</strong>................................. IV-11Los Vaqueros <strong>Water</strong>shed and Recreation <strong>Program</strong> .. IV-13Treated <strong>Water</strong> Distribution and Storage Facilities<strong>Program</strong>...................................................................... IV-15Untreated <strong>Water</strong> Supply and Transport <strong>Program</strong> ..... IV-18<strong>Water</strong> Demand Reduction <strong>Program</strong>........................... IV-22<strong>Water</strong> Treatment Facility <strong>Improvement</strong>s <strong>Program</strong> .... IV-241
Section IEXECUTIVE SUMMARY
Section I: Executive SummaryThe <strong>Ten</strong>-<strong>Year</strong> <strong>Capital</strong> <strong>Improvement</strong> <strong>Program</strong> (CIP) identifies and prioritizes the capital assetsrequired over the next ten years for <strong>Contra</strong> <strong>Costa</strong> <strong>Water</strong> <strong>District</strong> (CCWD or <strong>District</strong>) tosuccessfully carry out the <strong>District</strong>'s mission to "...strategically provide a reliable supply of highquality water at the lowest cost possible, in an environmentally responsible manner." The CIPcontains the <strong>Ten</strong>-<strong>Year</strong> Financial Plan that projects revenue requirements and long-term rateimpacts to fund the proposed projects and anticipated operating costs. The CIP and FinancialPlan are updated annually as part of an ongoing financial planning cycle that includes bi-annualbudgets and annual rate reviews.2009 – 2018 CIP UpdateThe proposed CIP for fiscal years 2009 - 2018 (2009 CIP) includes 55 projects with a totalestimated cost of approximately $525.2 million. CIP projects are ranked in three priority levels.The Financial Plan assumes that priority level 1 and 2 projects totaling $362.9 million arefunded. This funded level is $4.4 million lower than the 2008 CIP funded level ($367.3 million)and is the net result of adding new projects, adjusting cost estimates to reflect new information,and progress toward project completion. The 2009 CIP continues the aggressive implementationof the Alternative Intake Project, which will further the <strong>District</strong>’s commitment to improvingwater quality by building a new intake in the Delta to increase access to high-quality water yearround.Design of this important project has been completed and the <strong>District</strong> is moving forwardwith an accelerated construction schedule and an in-service date of July 2010, a full year earlierthan the schedule in last year’s CIP. Another significant project reaching a milestone in this CIPis the potential expansion of the Los Vaqueros Reservoir. The 2009 CIP includes completion ofthe planning and environmental studies for this project, which will clear the path for design andconstruction of an expanded reservoir of up to 275,000 acre-feet. Design and construction costsfor this project will depend on regional, federal, or state partnership agreements. Next year’sCIP will reflect the results of these partnership agreements.The Financial Plan anticipates the cost of water increasing at 10.5% annually as result of theDelta Vision process and the Bay Delta Conservation Plan (BDCP), which is 1.5 times the ratepreviously assumed. Both processes include the assessment of charges for diversion of waterfrom the Delta. The Delta Vision Task Force recommended a stable source of funding for theDelta. The BDCP process will include ecosystem restoration projects that have a local costcomponent. As a proactive measure to ensure the financial impacts of this additional expense areminimized, this CIP includes a total of $18 million in revenues between Fiscal <strong>Year</strong> (FY) 2010and FY2018 to cover these costs.All of the priority level 1 and 2 projects in the 2009 CIP can be funded and all operating costsand debt service obligations met with modest revenue increases over the ten-year CIP planningperiod. The proposed rate increases meet the Board’s rate policy that all projected rate increasesmust be at or below annual inflation. Projected untreated water and treated water revenueincreases do not exceed assumed inflation in any year, and the highest projected annual revenueincrease over ten years is 3.75 percent. The <strong>District</strong> is able to achieve these consistently modestincreases by reducing controllable operating costs, increasing competitiveness throughexpansion of service, investing in employee productivity through training, improved supportI-1
facilities and equipment, and use of reserves to reach Board established levels over the ten-yearCIP period consistent with the reserve policy.CIP StructureThe CIP is organized into ten separate program areas, each representing a different function ofthe <strong>District</strong>. Organizing projects by function allows the CIP to be viewed as a series of programsfor improvements in specific areas of <strong>District</strong> responsibility. The ten programs are:• Administrative, Support and Maintenance Facility <strong>Improvement</strong>• Delta Projects• Equipment and Other <strong>Capital</strong> Purchases• Expansion of Services• Future <strong>Water</strong> Supplies• Los Vaqueros <strong>Water</strong>shed and Recreation• Treated <strong>Water</strong> Distribution and Storage Facilities• Untreated <strong>Water</strong> Supply and Transport• <strong>Water</strong> Demand Reduction• <strong>Water</strong> Treatment Facility <strong>Improvement</strong>sSignificant elements of each of the ten program areas are summarized in the <strong>Program</strong> Highlightssection later in this Executive Summary. A more detailed description of the programs isincluded in Section IV: <strong>Program</strong> Summary.Within each program area, projects are prioritized according to a standard set of criteria thatmeasure the relative importance of a project based upon factors such as protection of health andsafety, legal requirements, relationship to <strong>District</strong> goals, and rate of return on the <strong>District</strong>'sinvestment. The priority levels provide a basis for deciding which projects should be done inany given year. They also provide a basis for scheduling projects over the ten-year span of theCIP.The following three levels are used to reflect a range of priorities from high to low:Priority Level 1 -- These are the highest priority capital projects. They include projectsalready under construction and those required by legislation, regulation, contract, or forprotecting health and safety. Priority level 1 also includes applicant and grant-fundedprojects.Priority Level 2 -- These are projects that provide measurable progress toward achievingthe <strong>District</strong>’s goals, but over which the <strong>District</strong> has a moderate level of control as to whenthey should be performed. Where return on investment is a determining factor, projectsin this priority level will have a payback of less than five years.Priority Level 3 -- These are projects that are projected to be needed, but over which the<strong>District</strong> has a significant level of control as to when they should be performed or the<strong>District</strong> is awaiting response to a grant application. Where return on investment is aI-2
determining factor, projects in this priority level will generally have a payback of greaterthan five years.A more detailed description of the prioritization system is provided in Section III: CIP Contextand Structure.<strong>Program</strong> HighlightsEach of the ten programs addresses a specific area of capital investment. Highlights of eachprogram, including the planning basis, significant projects or capital improvements, andexpected contributions to meeting CCWD’s goals, are presented below.Administrative, Support and Maintenance Facility <strong>Improvement</strong> -- Buildings and facilitiesnot directly involved in the treatment, transmission, or storage of water are organized within thisprogram. The planning basis is the Facilities Master Plan. Estimated funding required for thisprogram is $8 million over the ten-year CIP period, with $4.3 million for the Annual Buildingand Facility <strong>Improvement</strong>s (priority level 1). The Annual Building and Facility <strong>Improvement</strong>sproject provides for capital replacement of and improvements to existing <strong>District</strong> buildings andgrounds. A new Energy Demand Reduction Project ($150,000, priority level 2) has been addedto identify strategies to reduce energy cost and to ensure the <strong>District</strong> is well positioned to meetany new greenhouse gas emission regulations.Delta Projects -- This program includes water quality and reliability improvement projectsbeing managed by the <strong>District</strong> under contract with the State or projects that implement Deltawater quality objectives. Estimated funding for this program is approximately $96.3 millionover the ten-year CIP period. Sources of funding include State agencies, CCWD revenues, andother local agencies. There are two projects in this program, Los Vaqueros Reservoir ExpansionProject (priority level 2, $7.7 million) and the Alternative Intake Project (priority level 2, $88.5million).The Los Vaqueros Reservoir Expansion Project is a project being managed by the <strong>District</strong> onbehalf of State and federal agencies. The remaining planning level effort is focused oncompleting environmental and engineering studies including an Environmental ImpactReport/Environmental Impact Study (EIR/EIS) and a public outreach program.Funding assumptions for the Alternative Intake Project have been modified to reflect current costestimates and prospects for State and federal funding. Total project costs are approximately$111 million, with $22.7 million projected to be spent through FY2008 and $88.5 millionincluded in this CIP. The Alternative Intake Project is a pivotal initiative in meeting the<strong>District</strong>’s goal of improving drinking water quality. Source water quality will be improved withthis project operational. Chloride levels in Victoria Canal during the summer and fall are lowerthan the <strong>District</strong>’s other Delta intakes, thereby reducing the need for Los Vaqueros blending andsaving more water in the reservoir.Equipment and Other <strong>Capital</strong> Purchases -- The <strong>District</strong> has an ongoing need to invest in newor replacement capital equipment. Equipment replacement schedules are based on useful life, orwhen it is most cost effective based on anticipated future operating and repair costs. ThisI-3
program includes nine projects for purchases of capital equipment totaling approximately $14.8million. Significant projects include:• Fleet Vehicles and Heavy Equipment Replacement (priority level 2, $7.6 million)• GIS Implementation (priority level 2, $0.7 million; level 3 ,$0.3 million)• Replacement/Upgrade of Computer Systems (priority level 2, $2.5 million)• Replacement/Upgrade of Network Systems and Hardware (priority level 2, $1.2 million)The Replacement/Upgrade of Computer Systems (Financial, Customer Information, and HumanResources Information Systems; formerly referred to as the Mainframe Computer) needs to becompleted every seven to eight years based on hardware and software life cycles. The nextreplacement is scheduled for FY2011 – FY2012. The fleet vehicle and heavy equipmentreplacement program is funded from the Vehicle Replacement Fund. The Vehicle ReplacementFund, established in 1989, is a sinking fund with consistent annual contributions reflected in theten-year Financial Plan. Continued implementation of a <strong>District</strong>-wide Geographic InformationSystem (GIS) is included in this CIP following completion of the master plan in FY2007. TheGIS is anticipated to result in significant operational efficiencies through improved utilizationand management of <strong>District</strong> facilities, resources, and assets.Expansion of Services -- The purpose of this program is to increase the competitiveness of the<strong>District</strong> through expanding services. Service expansion diversifies revenue sources andincreases efficiencies through improved utilization of existing assets (e.g., sharing treatmentplant facilities). This program includes $49.5 million in capital improvements. The mostsignificant project in this program is the CCWD/Brentwood <strong>Water</strong> Treatment Plant project(priority level 1, $5.4 million) that includes design and construction of treatment facilities atRandall-Bold dedicated to serve Brentwood. Construction of the new 12 million gallon per day(MGD) plant is ahead of schedule and is anticipated to come online in July 2008. The newfacilities are being funded by the City and will be owned and operated by the <strong>District</strong>. A 15MGD expansion of this facility (priority level 1, $44 million) is also included in the later years ofthe CIP. The expansion will serve the ultimate needs of the City of Brentwood and will be fullypaid for by the City.Future <strong>Water</strong> Supplies -- This program includes $10 million in projects related to meetingfuture water supply requirements except conservation projects, which are in the <strong>Water</strong> DemandReduction program. The program includes two projects, both priority level 2: 1) periodicupdates to the Future <strong>Water</strong> Supply Study ($0.4 million), and 2) a placeholder for water supplyprojects ($9.6 million). The water supply projects in this program will serve future growth andare fully funded from Facility Reserve Charge (FRC) revenues. These projects help meetCCWD’s goals of increasing water supply reliability (meeting all demands in normal years andat least 85% of supply in dry years for existing and future customers).Los Vaqueros <strong>Water</strong>shed and Recreation -- The projects in this program total $5.1 million andprovide for renewal and replacement of recreation equipment and facilities (Recreation Facilitiesand Equipment, priority level 2, $1.3 million), <strong>Water</strong>shed <strong>Improvement</strong>s (priority level 2, $2.3million), and Land Acquisition and Real Property Management (priority level 2, $1.4 million).Projects within this program are based on the Resource Management Plan and Recreation Planfor the <strong>Water</strong>shed. The <strong>Water</strong>shed projects are predominantly focused on meeting regulatoryI-4
permit requirements and helping to maintain water quality in the reservoir. This program alsoincludes funding for projects that may increase revenues through leases of <strong>District</strong> lands forgrazing, wind power, or other enterprises.Treated <strong>Water</strong> Distribution and Storage Facilities -- This program is vital to maintaining thelevel of service, quality, and safety of the <strong>District</strong>'s existing treated water system, as well asproviding for expansion to meet future needs. The program relies on the following planningstudies: 1) the Treated <strong>Water</strong> Master Plan (TWMP), approved in 2007; and 2) the Treated <strong>Water</strong>Renewal and Replacement Study (2005). Investments of approximately $74.6 million over theten-year CIP period are projected for this program. Of this, approximately $51 million is toupgrade existing facilities—investments that directly advance the goals of increasing systemreliability and improving delivered water quality. These projects also improve efficiencies andcustomer satisfaction. The program also includes $1.4 million in new facilities to serve growthand an additional $18.5 million is estimated for applicant-funded projects. Significant projectswithin this program include the following:• Distribution Facilities (applicant projects) (priority level 1, $18.5 million)• Pipeline Renewal/Replacement (priority level 2, $22 million)• Port Chicago Pipeline Phase II (priority level 1 $1.2 million)• TW Facilities <strong>Improvement</strong> <strong>Program</strong> (priority level 2, $16 million)• TW Reservoir Rehabilitation (priority level 2, $7 million)Funding for rehabilitation projects is from treated water rate revenues. Funding for new facilitiesis split between treated water rate revenues and FRC revenues, depending on whether the facilityis for growth or to improve efficiencies.Untreated <strong>Water</strong> Supply and Transport -- The projects in this program serve to improvesource water quality and to replace, expand, and improve the <strong>District</strong>'s untreated water facilities.The planning bases are diverse and include the Untreated <strong>Water</strong> Facilities <strong>Improvement</strong> Plan andthe Seismic Reliability <strong>Improvement</strong> Plan. The funding estimate for this program isapproximately $145.1 million. Significant projects within this program include the following:• Canal Replacement Project (priority level 1, $13.5 million; level 2, $13 million; prioritylevel 3, $55.3 million)• Los Vaqueros Energy Recovery (priority level 2, $4.6 million)• Untreated <strong>Water</strong> Data Logger Replacements (priority level 2, $2 million)• Untreated <strong>Water</strong> Facilities <strong>Improvement</strong> <strong>Program</strong> (priority level 2, $19.6 million)• Untreated <strong>Water</strong> Pipeline (priority level 2, $20.1 million)This program includes the Canal Replacement Project that improves source water quality,improves flood protection, and enhances public safety in areas adjacent to the unlined canal.Much of this project will be funded by others, including Reclamation, developers, State bondfunds, and other State and federal funding programs. This project helps the <strong>District</strong> achieve itsgoal of improving water quality. The Untreated <strong>Water</strong> Facilities <strong>Improvement</strong> <strong>Program</strong> fundsrenewal and replacement of pumping and conveyance facilities and includes such activities ascanal lining replacement and pump station rehabilitation. Overall, the Untreated <strong>Water</strong> Supplyand Transport program contains approximately $42 million for renewal and replacement ofI-5
existing untreated water facilities. This investment directly advances the goal of increasingsystem reliability. Construction of the Untreated <strong>Water</strong> Pipeline (the “Green Line”) is includedin the latter portion of the ten-year CIP window. This project is scheduled to begin in FY2014and will include a 36 MGD pump station and a four-mile untreated water pipeline to parallel theexisting Canal and increase conveyance capacity and improve system reliability. The $4.6million Los Vaqueros Energy Recovery project has been moved from a priority 3 to a priority 2and grants are being sought to fund up to 50% of the project costs.<strong>Water</strong> Demand Reduction -- Activities in this program relate to planning and implementationof water conservation projects required to meet future water needs and the Best ManagementPractices (BMPs) required by the Central Valley Project <strong>Improvement</strong> Act (CVPIA) and theState Memorandum of Understanding regarding urban conservation. The <strong>Water</strong> ConservationIncentives project ($8 million) consists of rebates for high efficiency toilets and waterconservinghorizontal axis washing machines. Conservation incentives are expected to producecumulative water savings of over 16,000 acre-feet over the ten-year CIP period. Three additionalBMP projects that are funded in the annual operating budget are also included in this program.They are captured in the CIP so that all activities for conservation can be viewed together. Theoperating project costs are not included in CIP capital cost totals, but are shown as a componentof the projected operating costs.<strong>Water</strong> Treatment Facility <strong>Improvement</strong>s -- This program contains capital improvementsrelated to the <strong>District</strong>'s water treatment facilities. The projects were identified in the <strong>Water</strong>Treatment Plant (WTP) Master Plan (2003). Estimated costs for the program are $113.9 million,including $17 million in priority level 2 projects to renew, replace, and enhance existingtreatment facilities. These projects result in improved drinking water quality and increasedsystem reliability. The priority level 3 costs are primarily related to the Membrane FiltrationPlaceholder ($80 million), a water quality improvement project that may be necessary if Deltawater quality degrades or if future new regulations require advanced treatment. Significantprojects in this program include:• Bollman WTP <strong>Improvement</strong>s (priority level 2, $10.7 million; priority level 3, $5.2million)• City of Brentwood WTP <strong>Improvement</strong>s (priority level 2, $1.9 million; priority level 3,$0.6 million)• Membrane Filtration Placeholder (priority level 3, $80 million)• Randall-Bold WTP <strong>Improvement</strong>s (priority level 2, $4.3 million; priority level 3, $4.7million)Operation and Maintenance CostsThe Financial Plan considers total <strong>District</strong> operating costs in its analysis, including currentoperating costs inflated over time, as well as future costs related to implementing the CIPprojects. Projected operating costs for the first year of the 2009 CIP are $66.9 million. Theactual operating expenses for FY2009 will be determined through the budget process. Futureoperating costs are assumed to increase by 4% annually, with the exception of CVP water coststhat increase at approximately twice the rate of inflation. Operating cost impacts resulting fromcapital projects are incorporated into the operating cost projections in the year the facility comeson line. In addition, the Financial Plan anticipates an increase in water costs of $18 millionI-6
etween FY2010 and FY2018 as a result of the implementation of the Delta Vision and BDCPprocess.Estimates of operating costs for each project are documented in the project summaries. CIPSection V: Operating Impacts of the <strong>Capital</strong> <strong>Improvement</strong> <strong>Program</strong>, includes an analysis ofoperating costs, including labor, related to implementing the CIP. In the tenth year of the CIP,the annual increase in operating costs related to implementing all of the priority level 1 and 2projects in the CIP is estimated to be approximately $2.6 million, including nine additional fulltime employees. Operating costs for the CCWD/Brentwood <strong>Water</strong> Treatment Plant will befunded by the City, which accounts for approximately 80% of the projected increase.Financial HighlightsThe financial information in the CIP has been updated to include actual operating and capitalexpenditures and reserve balances through FY2008, and revised revenue projections andanticipated costs projected for the ten-year CIP period. The Financial Plan reflects the <strong>District</strong>’scontinued commitment to provide outstanding customer service while controlling costs thatimpact water rates. It also reflects continued compliance with the <strong>District</strong>’s bond covenantsincluding maintaining a debt service coverage ratio of at least 1.25 times annual debt service.Projected coverage ratios in this ten-year Financial Plan range from 2.0 to 1.43 times annual debtservice. All of the priority level 1 and 2 projects can be funded and all operating costs and debtservice obligations met with minimal, orderly revenue increases over the ten-year CIP planningperiod. The proposed rate increases meet the Board’s rate policy that all projected rate increasesmust be at or below the assumed annual rate of inflation. Projected untreated water and treatedwater revenue increases do not exceed assumed inflation in any year, and the highest projectedrevenue increase is three percent. Highlights of the ten-year Financial Plan are presented below.<strong>Capital</strong> Projects and Funding SourcesThe total cost of projects in the CIPis approximately $525.2 million, anincrease of approximately $22million from the 2008 CIP. Theincrease in total CIP costs is the netresult of inflation, adding newprojects, and adjusting cost estimatesto reflect new information andprogress towards completion. TheFinancial Plan assumes priority level1 and priority level 2 projects arefunded. Priority level 1 and prioritylevel 2 projects total approximatelyPriorityLevel 2009 CIP Costs 2008 CIP Costs1 $ 100.2 million $123.8 million2 $ 262.7 million $243.5 millionSubtotal $ 362.9 million $367.3 million3 $ 162.3 million $136.1 millionTotal $ 525.2 million $503.4 millionTable I-1 CIP Project Cost Comparisonby Priority$362.9 million in the 2009 CIP. As shown in Table I-1, this total is approximately $4.4 millionless than the priority level 1 and 2 totals in the 2008 CIP. The lower costs reflect progress onseveral of the <strong>District</strong>’s larger projects, including completion of the design for the AlternativeIntake Project and accelerated construction of the CCWD/Brentwood <strong>Water</strong> Treatment Plant.Priority level 3 projects have increased by approximately $26 million over the 2008 CIP. TheI-7
primary driver is an $18 million increase in the cost estimate for the Membrane FiltrationPlaceholder project based on updated project cost information.As shown in Table I-2, of the $362.9 million in funded project costs, approximately $196.5million are revenue funded (54%), $146.3 million are funded by others (40%), and $20.1 million(6%) are debt-funded. For comparison purposes, the funding sources for the 2008 CIP are alsoshown.The decrease in debt-fundedBrentwood reflects the Cityof Brentwood’s decision toissue long-term debt for thenew water treatment plantand progress onconstruction. Funded byothers has increased byapproximately $22 milliondriven primarily by outsidefunding being pursued forFunding Source 2009 CIP Costs 2008 CIP CostsDebt-funded CCWD $ 20.1 million $ 18.7 millionDebt-funded Brentwood $ 0 $ 35.4 millionFunded by others $146.3 million $124.0 millionRevenue-funded $196.5 million $189.2 millionTotal $362.9 million $367.3 millionTable I-2 CIP Priority Level 1 and 2 Project Cost Comparisonby Funding Sourcethe Canal Replacement Project. Funded by others also includes $30 million in State and federalfunds for the Alternative Intake Project. The <strong>District</strong> has secured approximately $6 million forthis project, however the likelihood of additional funding is uncertain. This uncertainty has beenconsidered in the projected revenue increases for both untreated and treated water. Revenuefundedprojects have increased by $7.3 million which is the net result of inflation, updated costinformation, and progress on projects. The revenue-funded category also includes the use ofcommercial paper as a short-term cash flow tool for the Alternative Intake Project to takeadvantage of favorable interest rates. The related commercial paper will be retired by 2014using CCWD reserves, but enables CCWD to maintain its reserve investments at a higher rate ofreturn during construction.CIP funding by fiscal year for priority levels 1 and 2 projects is shown in Table I-3. Forcomparison purposes, the estimated costs from the 2008 CIP are also shown. The total CIP costsfor priority level 1 and 2 projects are down slightly from the 2008 CIP ($362.9 million versus$367.3 million).Table I-3 Priority Level 1 and 2 Project Costs by Fiscal <strong>Year</strong>(in millions of dollars, current dollars)FY08 FY09 FY10 FY11 FY12 FY13 FY14 FY15 FY16 FY17 FY18 TOTAL2009 CIP N/A 77.0 66.8 29.5 25.2 26.1 26.1 42.8 33.5 21.4 14.7 362.92008 CIP 61.7 55.8 61.3 38.4 17.2 21.5 23.5 34.0 31.8 22.2 N/A 367.3I-8
Revenue-Funded <strong>Capital</strong> and Debt Service CostsThe <strong>District</strong>’s annual investment in capital facilities is the sum of revenue-funded capital costsand existing and future debt service costs. CCWD currently pays debt service for Los Vaqueros,Randall-Bold, the Bisso Administration Building, the Multi-Purpose Pipeline and other seismicprojects. The <strong>District</strong> also has low interest State Revolving Fund (SRF) loans for the BollmanSafety and <strong>Water</strong> Quality (SWQ) Project, the <strong>Contra</strong> Loma Swim Lagoon, and the BollmanSedimentation Basin project. Rates are set to meet capital and debt service costs as well as<strong>District</strong> operating costs. Table I-4 shows a comparison of untreated and treated water capital anddebt service costs by fiscal year between the 2009 CIP and the 2008 CIP for priority level 1 and2 projects.Table I-4 CIP <strong>Capital</strong> and Debt Service Cost EstimateComparison by Fiscal <strong>Year</strong> for Untreated and Treated <strong>Water</strong>Priority Level 1 and 2 Projects(in millions of dollars, inflated dollars)a) Untreated <strong>Water</strong>CIP FY08 FY09 FY10 FY11 FY12 FY13 FY14 FY15 FY16 FY17 FY18 TOTAL2009 N/A 42.6 48.6 50.3 66.9 65.4 64.7 57.7 44.7 44.7 45.6 531.22008 50.2 64.0 82.2 45.2 44.1 43.2 43.8 48.7 44.3 44.9 N/A 510.6b) Treated <strong>Water</strong>CIP FY08 FY09 FY10 FY11 FY12 FY13 FY14 FY15 FY16 FY17 FY18 TOTAL2009 N/A 16.3 18.2 14.9 13.3 12.6 14.8 13.3 15.6 13.7 17.9 150.62008 22.4 14.3 16.5 17.1 15.4 15.0 16.3 15.6 18.0 20.1 N/A 170.7The increase in untreated water costs is predominantly due to increases in the cost estimates forthe Future <strong>Water</strong> Supplies Placeholder ($8.3 million) and the Alternative Intake Project ($11million). The cost of the large water purchase identified in FY2015 was updated based on the<strong>District</strong>’s anticipated supply need and recent water cost information. This water purchase isFRC funded and does not impact rates. The cost estimate for the Alternative Intake Project wasupdated to reflect refinements made during design.There was a decrease in treated water costs of approximately $20 million over the ten-yearperiod. The primary driver for the decrease is the City of Brentwood’s decision to financeconstruction of the new CCWD/Brentwood water treatment facilities. The 2008 CIP assumedthat the <strong>District</strong> would be financing the new treatment plant with all costs reimbursed by theCity.I-9
Revenue Increase ProjectionsThe projected untreated and treated water revenue increases required to fund priority level 1 andlevel 2 projects, while covering operating costs and debt service and maintaining requiredreserve balances, are shown on Tables I-5 (a) and (b), respectively. For comparison purposes,projected water revenue increases from the 2008 CIP are also shown. These are preliminaryprojections only. The Board of Directors determines actual revenue increases at the time of eachannual rate study.Table I-5(a) Projected Untreated <strong>Water</strong> Revenue Increases ComparisonPriority Levels 1 and 2 ProjectsFY08 FY09 FY10 FY11 FY12 FY13 FY14 FY15 FY16 FY17 FY182009 CIP N/A 3.0% 3.25% 3.5% 3.5% 3.5% 3.5% 3.75% 3.75% 3.75% 3.75%2008 CIP 3.0% 3.0% 3.0% 3.0% 3.0% 3.0% 3.0% 3.0% 3.0% 3.0% N/ATable I-5(b) Projected Treated <strong>Water</strong> Revenue Increases ComparisonPriority Levels 1 and 2 ProjectsFY08 FY09 FY10 FY11 FY12 FY13 FY14 FY15 FY16 FY17 FY182009 CIP N/A 3.0% 3.15% 3.3% 3.3% 3.3% 3.3% 3.5% 3.5% 3.5% 3.5%2008 CIP 3.0% 3.0% 3.0% 3.0% 3.0% 3.0% 3.0% 3.0% 3.0% 3.0% N/AImplementing the 2009 CIP will require annual untreated revenue increases ranging from 3% to3.75%. Projected treated water revenue increases range from 3% to 3.5%. Both the untreatedand treated water revenue increases consider the potential that not all of the outside funding forthe Alternative Intake Project will be secured. Because the Board reviews and considers rateadjustments on an annual basis, outside funding actually secured for <strong>District</strong> projects will beincorporated in future CIPs and rate analyses.These revenue increases are higher than those projected in the 2008 CIP. These increases areprimarily the result of anticipated higher water costs due to implementation of the Delta Visionand BDCP process. Projected revenue increases remain consistent with the Board’s policy ofkeeping increases at or below the long-term rate of inflation (4%).I-10
Section IIBACKGROUND
Section II: BackgroundThe <strong>Ten</strong>-<strong>Year</strong> <strong>Capital</strong> <strong>Improvement</strong> <strong>Program</strong> (CIP) and Financial Plan are annuallyupdated as authorized under <strong>Contra</strong> <strong>Costa</strong> <strong>Water</strong> <strong>District</strong> (<strong>District</strong>) Code of RegulationsChapter 7.16.030.B. The CIP provides a comprehensive view of the asset investmentsrequired over the next ten years to meet the mission and goals of the <strong>District</strong>. TheFinancial Plan projects operating costs and reserve balances, and estimates revenuerequirements necessary to fund the required projects and operate the <strong>District</strong>. Thiscomprehensive approach provides an opportunity for the <strong>District</strong> to prioritize capitalinvestments, monitor progress toward meeting its goals, manage cash flow, diversifyrevenue sources, and project rates and charges over ten years.The 2009-2018 CIP is an update of the previous CIP covering fiscal years 2008-2017,adopted by the Board on February 21, 2007. Board adoption of the CIP establishes thescope and estimated costs of various capital projects designed to meet the long-termneeds of the <strong>District</strong>. Adoption does not commit funds or authorize projects. Projectapprovals and funding are obtained through the budget process.The <strong>District</strong>’s mission and goals are set forth below. Also included is an overview ofexisting facilities and operations to provide context for the projects and programs in theCIP.<strong>District</strong> Mission and GoalsThe Mission Statement represents the <strong>District</strong>’s statement of purpose. The statementincludes a set of seven values that govern how the <strong>District</strong> will conduct itself in meetingits mission. <strong>Ten</strong> major goals were developed to measure the success of meeting thepurpose as defined by the Mission Statement, and Key Performance Measures have beendeveloped to assess the <strong>District</strong>’s progress in meeting those goals. The MissionStatement and <strong>District</strong> Goals were established by the Board and guide the development ofthe CIP and Financial Plan and are explained in more detail below.Mission StatementThe mission of the <strong>Contra</strong> <strong>Costa</strong> <strong>Water</strong> <strong>District</strong> is to strategically provide a reliablesupply of high quality water at the lowest cost possible, in an environmentallyresponsible manner.In fulfilling this mission, The <strong>District</strong> will:• Responsibly serve the public• Provide <strong>District</strong> employees a safe and healthy work environment• Ensure fair and equitable rates and charges• Work cooperatively with local, regional, state, and federal agencies• Practice ethical behavior• Ensure an open processII-1
• Ensure equal opportunity and diversity in personnel matters and contracting<strong>District</strong> GoalsThe goals of the <strong>Contra</strong> <strong>Costa</strong> <strong>Water</strong> <strong>District</strong> are:1. Ensure that the <strong>District</strong> delivers high quality and reliable water supplies forcurrent and future needs.2. Provide excellent customer service and high levels of customer satisfaction.3. Plan, design, and construct high quality facilities consistent with <strong>District</strong> needsand industry standards.4. Effectively manage the <strong>District</strong>’s financial resources in conformance with Boardpolicies.5. Ensure that all <strong>District</strong> activities surpass all applicable laws and regulations.6. Operate, maintain, and protect <strong>District</strong> facilities in a safe and cost-effectivemanner.7. Provide leadership in water affairs.8. Actively enhance effective community relations and public information.9. Create and maintain a work environment that fosters teamwork and individualexcellence.10. Manage and maintain Reclamation and <strong>District</strong> natural and recreation resources,and protect public safety and water quality.Key Performance MeasuresThe purpose of the Key Performance Measures is to provide the Board with a summarytool for assessing the <strong>District</strong>’s progress in meeting its goals. The five measures are:• Customer Service – Achieve sustained improvement in customer ratings of theirsatisfaction levels for contacts with <strong>District</strong> employees on a satisfaction scalefrom poor to excellent.• <strong>Water</strong> Production – Hold increases in operating labor costs per equivalentconnection at less than annual inflation.• Employee Safety – Reduce the number of calendar year recordable accidents andlost workdays to achieve frequency and severity rates for industrial injuries belowthe <strong>District</strong>’s five year rolling average.• <strong>Water</strong> Quality/Reliability – Have no reportable Department of Health Servicesviolations and no excesses of the Maximum Contaminant Level for substanceslisted in the Annual <strong>Water</strong> Report.• <strong>Capital</strong> Projects – Ensure all <strong>District</strong> costs for administration, planning, design,and construction management on completed projects be less than the <strong>District</strong>’sfive year rolling average without reducing quality or performance.II-2
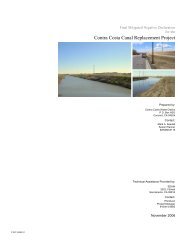
Existing Facilities and OperationsThe <strong>District</strong> provides water to approximately 550,000 people in <strong>Contra</strong> <strong>Costa</strong> County. Inperforming this service, the <strong>District</strong> operates and maintains a complex system of watertransmission, treatment, and storage facilities to supply both treated and untreated (raw)water to its customers.The <strong>Contra</strong> <strong>Costa</strong> County <strong>Water</strong> <strong>District</strong> was approved by the voters in 1936 as the legalentity to contract, purchase, and distribute water provided by the U.S. Bureau ofReclamation through the <strong>Contra</strong> <strong>Costa</strong> Canal. (In 1981, "County" was dropped from thename, leaving <strong>Contra</strong> <strong>Costa</strong> <strong>Water</strong> <strong>District</strong>.) The 48-mile canal conveys water from theSacramento-San Joaquin Delta, through Rock Slough and Old River, to eastern andcentral <strong>Contra</strong> <strong>Costa</strong> County.The <strong>District</strong>'s service area encompasses most of central and northeastern <strong>Contra</strong> <strong>Costa</strong>County, a total area of more than 137,127 acres (including the Los Vaqueros watershedarea of approximately 19,100 acres). <strong>Water</strong> is provided to a combination of municipal,residential, commercial, industrial, landscape irrigation, and agricultural customers.Major untreated water municipal customers include the Golden State <strong>Water</strong> Company(Bay Point), Diablo <strong>Water</strong> <strong>District</strong> (Oakley), and the Cities of Antioch, Pittsburg, andMartinez. Treated water is distributed to customers living in the following communities:Clayton, Clyde, Concord, Pacheco, Port <strong>Costa</strong>, and parts of Martinez, Pleasant Hill, andWalnut Creek. In addition, CCWD treats and delivers water to the City of Brentwood,Golden State <strong>Water</strong> Company (Bay Point), Diablo <strong>Water</strong> <strong>District</strong> (DWD), and the City ofAntioch.For the first 25 years of itsexistence, the <strong>District</strong>'s mainresponsibility was the purchaseand distribution of untreatedwater through the <strong>Contra</strong> <strong>Costa</strong>Canal. The cities and other waterutilities within the <strong>District</strong> wereresponsible for treating waterused by their customers.However, in the late 1950s, manycitizens and public officialsbecame concerned about thequality and cost of the water inthe central county area. To solvethis problem, the <strong>District</strong>Figure II-1 <strong>District</strong> Service Areapurchased the California <strong>Water</strong>Service Company's Concord-areatreatment, pumping, storage, and distribution facilities. In 1968, the <strong>District</strong> replaced theold treatment facilities with the construction of its own Ralph D. Bollman <strong>Water</strong>Treatment Plant in Concord. The Bollman plant and the Randall-Bold Plant built in 1992II-3
now provide treated water to approximately 265,000 people in the central county areaand by contract to Bay Point. The Randall-Bold <strong>Water</strong> Treatment Plant in Oakley isjointly owned with DWD. The Randall-Bold plant provides treated water to DWD, andby contract, to the City of Brentwood and the City of Antioch and new growth in CentralCounty. The Multi-Purpose Pipeline, constructed in 2003, transports treated water tonew customers in Central County from the Randall-Bold plant.<strong>Water</strong> SupplyThe <strong>District</strong> is a Central Valley Project (CVP) contractor, historically relying almostentirely on the federal government (the United States Bureau of Reclamation) to supplyits water through the Sacramento-San Joaquin Delta. The 2005 Long-Term Renewal<strong>Contra</strong>ct with Reclamation provides for the operation of the Los Vaqueros Project, andfor a maximum delivery of 195,000 acre-feet per year from the CVP, with a reduction indeliveries during water shortages including regulatory restricted and drought years. TheLong-Term Renewal <strong>Contra</strong>ct was executed in May 2005 and is consistent with theCentral Valley Project <strong>Improvement</strong> Act of 1992.Other <strong>District</strong> supplies include water rights at Mallard Slough (License No. 10514 andPermit No. 19856) for a maximum diversion of Delta water of up to 26,700 acre feet peryear. This water is subject to quality degradation and can only be used intermittently.On June 2, 1994, the State <strong>Water</strong> Resources Control Board issued <strong>Water</strong> Rights Decision1629 that gives CCWD additional rights to divert and store water for beneficial uses.The State Board subsequently issued <strong>Water</strong> Rights Permits No. 20749 and 20750 forfilling Los Vaqueros Reservoir from the new intake at Old River near Highway 4 anddiversion and storage of the water of Kellogg Creek. These rights are in addition to thecontractual rights to divert and store water furnished through the CVP. Construction ofthe reservoir began in September 1994 and was completed in January 1998. Diversionfrom the Old River intake for delivery to CCWD's service area began in the summer of1997. Up to 95,850 acre-feet annually may be diverted for storage between November 1of each year to June 30 of the succeeding year under <strong>Water</strong> Rights Permit No. 20749. OnJanuary 28, 1999, the Los Vaqueros Reservoir was filled to 100,000 acre-feet for the firsttime. In February 1999, CCWD released water from the reservoir for the first time foruse in the <strong>District</strong>'s service area. Releases were scheduled in compliance with theproject’s Biological Opinions to allow CCWD to cease all diversions from the Delta andprovide benefits to Delta fisheries. Additionally, releases of high quality reservoir waterhave been used to blend with Delta water to improve delivered water quality as needed.Additionally, the <strong>District</strong> has a contract with the East <strong>Contra</strong> <strong>Costa</strong> Irrigation <strong>District</strong>(ECCID) for untreated water that can be used in areas in East County within theboundaries of both the <strong>District</strong> and ECCID, and for additional drought supplies availablethrough groundwater exchange. The <strong>District</strong> has an ongoing program to obtainadditional sources for use during drought and to provide for future demands.An intertie connecting the Los Vaqueros Pipeline with East Bay Municipal Utility<strong>District</strong>’s (EBMUD) Mokelumne Aqueducts in Brentwood has recently been completedand will enable the wheeling of a portion of the <strong>District</strong>’s CVP water via the FreeportII-4
project and the Mokelumne Aqueducts. The intertie will also function as an emergencyconnection between EBMUD and the <strong>District</strong>, enabling the districts to share waterresources in an emergency. EBMUD recently requested CCWD’s assistance to wheelwater from the Delta to EBMUD’s Mokelumne Aqueduct if EBMUD’s storage is belowtheir drought target levels and until EBMUD’s Freeport project comes on line. Up to15,000 acre feet per year of EBMUD’s Central Valley Project water would be pumpedfrom the Delta at Old River through CCWD’s Los Vaqueros Pipeline to EBMUD’sMokelumne Aqueduct.<strong>Water</strong> QualityCCWD’s mission is to “strategically provide a reliable supply of high-quality water at thelowest cost possible, in an environmentally responsible manner.” CCWD obtains itswater supply exclusively from the Sacramento-San Joaquin Delta (Delta) and servestreated and raw (untreated) water to approximately 550,000 people in central and eastern<strong>Contra</strong> <strong>Costa</strong> County. All of CCWD’s intakes are subject to variations in water qualitycaused by salinity intrusion, Delta hydrodynamics, and discharges into the Delta and itstributary streams from both point and non-point sources. Since 1992, CCWD has spentover $1 billion on capital improvements, including $450 million on the Los VaquerosProject, as well as over $200 million on projects directly related to improving waterquality and the security of CCWD’s water delivery system (such as improvements at bothBollman and Randall-Bold <strong>Water</strong> Treatment Plants, construction of the Multi-PurposePipeline, improvements at <strong>Contra</strong> Loma Reservoir, and other CCWD projects).Notwithstanding these efforts, Delta water quality at CCWD’s intakes (as measured bychlorides) has declined significantly over the last twenty years, affecting the reliability ofCCWD’s supplies and its ability to consistently provide high-quality water to itscustomers. The increase in chlorides directly impacts the performance of the LosVaqueros project by requiring additional blending releases from the reservoir to meet the<strong>District</strong>’s delivered chloride goal of 65 milligrams per liter.CCWD is implementing a comprehensive water quality strategy to protect and improvesource and treated water quality for its customers. CCWD’s multi-pronged approachincludes seeking improved water quality sources, reducing impacts of Delta agriculturaldrainage on source water quality, participating in collaborative research on advancedwater treatment of Delta water, and supporting regulatory and legislative initiatives forimproving drinking water quality and source water protection.Untreated <strong>Water</strong> SystemThe <strong>Contra</strong> <strong>Costa</strong> Canal is the <strong>District</strong>'s major water supply facility, with a four-mileearth lined channel starting at Rock Slough leading into the 44-mile concrete-linedfacility. The canal passes through many of the cities and communities in the northeasternand central county areas before ending at the Martinez Reservoir. <strong>Water</strong> is supplied tothe canal from Old River via the Los Vaqueros Project pipelines and from Mallard andRock Slough. A series of four pump stations (Pumping Plants One through Four) lift thewater from Rock Slough to a height of 126 feet above sea level, after which gravitypropels the water to its terminus in Martinez. Four reservoirs - <strong>Contra</strong> Loma Reservoir,II-5
Martinez Reservoir, Mallard Reservoir, and Los Vaqueros Reservoir - provideapproximately 110,000 acre-feet of storage capacity.The Los Vaqueros Project was completed in 1998 and includes a 100,000 acre-footreservoir, intake and pump station at Old River, and transmission facilities. <strong>Water</strong>diverted from Old River can be stored in the Los Vaqueros Reservoir or conveyed bypipeline to the canal system. In addition to emergency storage, the Los VaquerosReservoir provides high quality water for blending when Delta quality is degraded.<strong>Contra</strong> Loma Reservoir is used to provide emergency storage, to regulate flows in theCanal, to meet peak flows, and to provide back up during canal maintenance. MallardReservoir and Martinez Reservoir serve as terminal storage for flow regulation andemergency use.An automated computer system called SCADA monitors and controls both the untreatedand treated water systems, turning pump stations on and off, opening and closing valves,and regulating reservoir levels. The system uses microwave radio signals tocommunicate with instrumentation located throughout the untreated and treated <strong>Water</strong>systems.Treated <strong>Water</strong> SystemThe <strong>District</strong> operates two water treatment facilities, the 75 million gallons per day(MGD) Bollman <strong>Water</strong> Treatment Plant and the 40 MGD Randall-Bold <strong>Water</strong> TreatmentPlant. The Bollman plant serves the <strong>District</strong>'s treated water customers in Central County,and under special agreement, provides treated water to Bay Point. The Randall-BoldPlant in Oakley, which came on line in July 1992, currently provides treated water to theDiablo <strong>Water</strong> <strong>District</strong> and the Cities of Brentwood and Antioch. The Randall-Bold plantalso serves new growth in Central County. The Multi-Purpose Pipeline, constructed in2003, is primarily intended to transport treated water from Randall-Bold to newcustomers in Central County, but can also transport treated water from Central County toRandall-Bold. In the event of a major emergency, the Multi-Purpose Pipeline can alsopump untreated water for fire suppression. A 12 MGD water treatment facility iscurrently under construction at the Randall-Bold site to serve the City of Brentwood.Treated water distribution facilities include more than 800 miles of pipeline and 41 activestorage reservoirs. Total treated water storage capacity is approximately 72 milliongallons. Thirty pump stations are used to deliver the water and maintain water pressurewithin the distribution system. There are approximately 60,636 active serviceconnections to the treated water system, servicing approximately 137,672 equivalent 5/8-inch connections.New facilities are regularly added to the treated water system to meet new demands,increase reliability, improve operating efficiencies, and ensure service standards are met.These new facilities are identified and prioritized in a Treated <strong>Water</strong> Master Plan(TWMP), which forms the planning basis for many of the treated water projects in theCIP.II-6
In addition, the <strong>District</strong> has entered into an agreement with the City of Brentwood toserve the long-term treated water needs of the City through treatment of non-LosVaqueros water, for use in the part of Brentwood that is outside the <strong>District</strong>’s servicearea. A separate treatment facility on the Randall-Bold site is being constructed and willbe operated by the <strong>District</strong> for the City of Brentwood. All costs related to this facilitywill be paid by the City.II-7
Section IIICIP CONTEXT AND STRUCTURE
Section III: CIP Context and StructureThe CIP is part of the <strong>District</strong>'s long-range capital investment and financial planningprocess. This section describes the CIP in relationship to other <strong>District</strong> planning efforts,the most important of which is the ten-year financial plan and rate model. This sectionalso discusses CIP structure, how the CIP is developed, and key assumptions.Financial Planning ContextThe <strong>District</strong> undertakes three principle financial planning efforts starting with the annualCIP Update and ten-year Financial Plan, a two-year capital and operating budget, and anannual review of rates, fees, and charges. These processes are separate but inter-related.The <strong>District</strong>'s need to construct new facilities and reinvest in existing infrastructurewithin a ten-year period is forecasted in the CIP. The CIP includes a ten-year FinancialPlan that estimates ten years of capital and operating expenditures and the revenuerequirements to meet the expenditures. This provides the basis for projecting ten-yearrate impacts. The CIP is presented to the Board in February of each year. The budget ispresented to the Board in May and June, every other year. Budget status is reviewed atapproximately six-month intervals until the next two-year budget. Rates, fees, andcharges are brought to the Board in November and December of each year, andadjustments are typically considered for Board action in January. The next CIP updatewill form the basis of the next two-year budget, and the cycle repeats. The <strong>District</strong>’sfinancial planning process is shown in the following figure.10-<strong>Year</strong> CIP &Financial PlanFebruary (annually)Rate Analysis(10-<strong>Year</strong> Projections)January (annually)Two-<strong>Year</strong> Operating& <strong>Capital</strong> BudgetJune (bi-annually)Figure III-1 <strong>District</strong> Financial Planning ProcessIII-1
All three financial planning efforts are integral to the overall financial integrity of the<strong>District</strong>. This integrated process ensures near-term financial decisions are made with anunderstanding of the long-term implications. Planning capital improvements over a tenyearperiod through the CIP provides flexibility to optimize capital investments whileconsistently adhering to the Board’s rate policies. The approval and funding of projectsthrough the two-year budget minimizes uncertainty in financial decision-making andmaximizes control over financial resources.CIP StructureTwo structural elements provide the framework for analysis and review of the CIP: theprogram configuration and the project priority system. Each element is described below.<strong>Program</strong> ConfigurationThe basic unit of the CIP is the project. Projects are grouped by program and subprogram.There are ten program areas, each representing a different function of the<strong>District</strong>. Organizing projects by functional group allows the CIP to be viewed as a seriesof programs for improvements in specific areas of <strong>District</strong> responsibility. Sub-programsare groups of related projects within a program. The allocation of project costs betweenuntreated and treated water funds also follows program divisions. <strong>Program</strong>s, subprograms,and cost allocations in the 2009 CIP are listed on Table III-1 on the followingpage.The untreated/treated allocations listed in Table III-1 are based primarily on theassessment of who benefits from a particular project. This assessment is usually doneduring master plan development or by financial audit. Allocation of costs betweenuntreated and treated customers is used in the Financial Plan to project the rates andcharges needed to fund the CIP.Project Priority SystemEach CIP project is assigned a priority level according to prioritization criteria. Thepriority system provides a method to rank or rate the relative importance of a projectbased on factors such as protection of health and safety, legal requirements, and rate ofreturn on the <strong>District</strong>'s investment. The priority levels provide a basis for determiningwhich projects should be done in any given year, and how projects should be scheduledover the ten-year span of the CIP. Only those projects with a priority level 1 or 2 rankingare included in the ten-year Financial Plan and Rate Model.A description of the three priority levels and the prioritization criteria used to rankprojects in the CIP is provided on Page III-4.III-2
Table III-1 PROGRAMS and SUB-PROGRAMSAllocation of <strong>District</strong> Costs Between Untreated and Treated <strong>Water</strong> Funds 1Untreated/Treated(%)Administrative, Support and Maintenance Facility <strong>Improvement</strong> <strong>Program</strong> (38/62)Sub-programs: Facilities ExpansionFacilities UpgradesDelta Projects (100/0)Equipment and Other <strong>Capital</strong> Purchases <strong>Program</strong> 2 (38/62)Sub-programs: Equity Funded EquipmentVehicle Replacement FundExpansion of Services <strong>Program</strong> 3Sub-program: Wholesale Treated <strong>Water</strong>(N/A)Future <strong>Water</strong> Supplies <strong>Program</strong> (100/0)Sub-programs: <strong>Water</strong> SuppliesPlanningLos Vaqueros <strong>Water</strong>shed and Recreation <strong>Program</strong> (100/0)Sub-programs: Recreation<strong>Water</strong>shedTreated <strong>Water</strong> Distribution and Storage Facilities <strong>Program</strong> (0/100)Sub-programs: Corrosion ControlNon-<strong>District</strong> Funded ProjectsPipe UpgradesPipes - NewPump UpgradesPumps - NewSite UpgradesStorage - New FacilitiesStorage UpgradesTWSA PlanningUntreated <strong>Water</strong> Supply and Transport <strong>Program</strong> (100/0)Sub-programs: Untreated <strong>Water</strong> Facilities – SRIPNon-<strong>District</strong> Funded ProjectsUntreated <strong>Water</strong> Facilities - NewUntreated <strong>Water</strong> Facilities - PlanningUntreated <strong>Water</strong> Facilities - Upgrades<strong>Water</strong> Demand Reduction <strong>Program</strong> (100/0)Sub-program: Best Management Practices Implementation<strong>Water</strong> Treatment Facility <strong>Improvement</strong>s <strong>Program</strong> (0/100)Sub-programs: ExpansionPlanningUpgrades1. A portion of untreated water costs is allocated to treated water customers based on consumption. Grant funds for projects affect <strong>District</strong>costs in the proportion shown.2. The SCADA project is allocated 45% untreated / 55% treated per distribution of system components.3. Allocations in this program are project specific.III-3
Priority Level 1These are the highest priority of all capital projects. Projects are ranked priority level 1 ifthey meet one or more of the following criteria:• Project is required for health and safety. This includes projects needed toprotect and preserve the health and safety of customers, employees, and thepublic.• Project is required by law, regulation, or contract. This includes projectsrequired to meet requirements imposed by federal, State, or local governments.• Project is under construction.• Project is funded by applicants or outside funding source.As an example, the Untreated <strong>Water</strong> Reservoir Rehabilitation project is ranked level 1because it is required by the California Department of Safety of Dams and USBR toensure dam safety.Priority Level 2Priority level 2 projects are those that provide measurable progress toward achieving the<strong>District</strong>’s goals, but the <strong>District</strong> has a moderate level of control as to when these projectsshould be accomplished. Projects are ranked priority level 2 if they meet all of thefollowing criteria:• Project has a defined scope and provides measurable progress towardachieving the <strong>District</strong>’s goals.• The <strong>District</strong> has a moderate level of control over the schedule.• Funding is available such that rate increases are at or below inflation.• When return on investment is a determining factor, projects have a paybackperiod of less than five years.New reservoirs as recommended in the Treated <strong>Water</strong> Master Plan are examples ofprojects in priority level 2. Treated water reservoirs help achieve the strategic goals ofimproving water system reliability and increasing competitiveness.Priority Level 3Projects not meeting the criteria for priority level 1 or 2 are ranked as priority level 3.These are projects that are anticipated to be needed, but may not yet have defined scopes,schedules, or funding sources. In some cases where a project is defined but only aportion of the funding is available, the project will be phased with the funded portion inpriority level 1 or 2 and the unfunded portion in priority level 3. Where return oninvestment is a determining factor, projects with a long-term payback of greater than fiveyears are priority level 3 projects.III-4
The three priority levels are consistent with those used in previous ten-year CIPs. Projectpriority rankings were re-evaluated during the project review process and changes weremade where necessary to reflect changed circumstances.Project SummariesA project summary has been prepared for each project in the CIP. These are presented inprogram order in Section VII. The project summary form is similar to that used inprevious CIPs. Each summary includes a project description, justification, benefits,estimates of cash flow and O&M impacts, and funding source information. Schedules intime line form are provided for all projects (except annual projects). The schedules showthe relative duration of planning, design, and construction activities. A category called"Other" is used for projects that do not fit this traditional pattern such as some capitalequipment purchases. The schedules are plus or minus three months. A comparison tothe 2008 CIP is provided for all continuing projects.AssumptionsDevelopment of the CIP and Financial PlanLong-range financial planning is dependent on the ability to forecast future expendituresand revenues. Assumptions are made where necessary to proceed with the planningprocess. The assumptions used in the 2009 CIP are listed on Figure III-2. The assumptionshave been organized so that related assumptions, such as those referring to waterconsumption, are grouped together. The assumptions for this update have not changedsignificantly from the 2008 CIP. Assumptions specific to the rate model are describedfurther in Section VI: Financial Plan.There are many ways to project growth and many sources of information. Growthprojections will vary depending on the methodology chosen and the base data used, whichin turn depend on the purpose of the projections. Growth projections for financial planningare used in projecting revenues and are therefore usually conservative or at the lower endof an acceptable range. In contrast, growth projections for capacity planning are used forsizing and scheduling facilities, and are more appropriately at the high end of a range.Growth projections are refined and modified as necessary to meet the needs for the projectsusing information from the Future <strong>Water</strong> Supply Study (FWSS) and the Seismic andReliability <strong>Improvement</strong>s Project (SRIP). The FWSS projected annual demands for anaverage year regardless of source of supply. The goal of the projections was to determinehow much water would be needed on an annual basis. The SRIP, on the other hand, startedwith FWSS demands, and then analyzed them to project peak demands on the untreatedwater conveyance system. Its purpose was to design facilities that will meet the maximumrequired conditions. These and other differences in assumptions are documented in eachstudy. The projections in the two studies use the same base, but are modified asappropriate for their respective purposes.III-5
GeneralFigure III-2 Key Assumptions1. The ten-year CIP is a dynamic capital planning document that will be reviewedand revised annually.2. CIP untreated and treated water costs for priority level 1 and level 2 projects willbe held to a level that results in rate impacts at or below inflation. Costcontainment is to be accomplished without impacting service levels.3. Appropriations for capital improvements will be authorized by the Board as partof the budget process.4. Facility reserve charges (FRCs) are a funding source for capital projects. Aportion of the FRC will fund CIP projects related to growth or future watersupplies. Allocations between existing and future customers will be consistentwith the findings of the February 1998 FRC Report. The FRC methodology isused in the Financial Plan.5. <strong>Capital</strong> projects with non-<strong>District</strong> funding sources (such as applicant funds andgrants) are included in CIP cost estimate totals and the outside funding is includedin revenue projections.6. The Multi-Purpose Pipeline (MPP) Project-Untreated <strong>Water</strong> Pipeline is assumedto be debt-funded.7. The <strong>District</strong> will utilize commercial paper to provide short-term financingconsistent with <strong>District</strong> policy. Commercial paper, other than that eligible forrefinancing with low interest State Revolving Fund loans, will be converted to 30-year fixed bonds in the future, or paid off from reserves.8. <strong>District</strong> policy and bond covenants require maintaining a debt coverage ratio of atleast 1.25:1.Revenue Forecasting9. Municipal untreated water consumption is estimated to increase by approximately1% each year for the full analysis period. Consumption for the Diablo <strong>Water</strong><strong>District</strong> and the City of Brentwood is assumed to increase by approximately 2%each year based on approved growth in East County. East County growth rateshave been reduced from last year’s CIP to reflect recent trends.10. Industrial untreated water consumption is estimated to remain constant athistorical levels.III-6
11. Treated water consumption is assumed to increase by 0.7% each year for the fullanalysis period.Inflation12. Inflation is projected at 4% per year for operating and maintenance expenditures(excluding purchased water) based on the historical average.13. Inflation is projected at 4% per year for all capital costs in the Financial Plan.14. CVP water costs are estimated to increase by approximately twice the rate of inflationper year, beginning in FY2010.Capacity Planning15. Demand projections from the Future <strong>Water</strong> Supply Study update (2002) are used asthe basis for sizing and scheduling construction of capital facilities.16. Future <strong>Water</strong> Supply Study demands may be adjusted to account for drought recoverytrends, peak period demands, sources of supply, and other project-specific conditionsas appropriate. All such adjustments will be noted in planning documents.Cost Estimating17. Project costs (capital and O&M) are expressed in current (FY2009) dollars unlessotherwise noted. Costs in the Financial Plan are escalated by the appropriate inflationrates, as described above.18. Cost estimates in the first year of the CIP do not include funds that could be rebudgetedto match cash flow from the current fiscal year’s approved budget. Forpurposes of the CIP, it is assumed that budgeted funds are fully expended unlessotherwise stated.19. Components of capital cost estimates include land acquisition; construction;engineering services (planning, design, and construction management); direct costs(including legal fees and administrative support); indirect costs (such as officemaintenance and utilities, accounting and other support services); and constructioncontingencies. Cost estimates include an allowance of 35% for engineering servicesand administrative support and up to 30% for construction contingencies dependingon the characteristics of the project.20. Estimates of O&M costs include labor, materials, equipment, and other expenses(such as power) required for all <strong>District</strong> operations, including operating andmaintaining property and facilities.III-7
21. Cost estimates for capital projects are accurate within plus and minus ranges thatvary depending on project stage as follows:a. Preliminary planning estimates (+50% to –30%)b. Completion-of-planning estimates (+30% to –15%)c. Design-level estimates (+15% to –5%)22. Accuracy ranges provide guidelines for interpreting cost estimates--they do notrepresent project contingencies. Projects under construction do not have anaccuracy range because it is assumed the project will be completed for thecontract amount, which includes allowances for change orders and unforeseencircumstances consistent with <strong>District</strong> policy.23. All cost estimates have been rounded to three significant figures, but in no casemore refined than to the nearest thousand.Identifying <strong>Capital</strong> ProjectsMost of the projects in the CIP are identified in master planning documents, such as theTreated <strong>Water</strong> Master Plan. Most of these planning documents are periodically updatedto ensure that project planning is based on current and reliable information. Table III-2lists major master plans and studies and the next scheduled update, if applicable. SomeCIP projects are based on maintenance reports, field inspection records, and customercomplaints; others are required by legislation, regulation, agreement, or Board policy.The CIP update team also meets with staff responsible for specific <strong>District</strong> functions,such as water treatment, to facilitate identification of capital project needs.Table III-2 – Master Plans and Planning DocumentsDocumentCompleted Next UpdateCanal Drainage Study 1995 (a)Delta Region Drinking <strong>Water</strong> Quality Management Plan 2005 (a)Facilities Master Plan 1999 (a)Facility Reserve Charge Analysis 1998/2002 (b)Future <strong>Water</strong> Supply Study 1996/2002 2008Seismic and Reliability <strong>Improvement</strong>s Project 1997 (a)Treated <strong>Water</strong> Master Plan Update 2007 2012Treated <strong>Water</strong> Renewal/Replacement Study 2005 2011Untreated <strong>Water</strong> Renewal/Replacement Study 2006 2011<strong>Water</strong> Treatment Plant Master Plan 2003 2013<strong>Water</strong>shed Management <strong>Program</strong> 1997 (a)(a) An update is not necessary or is not currently scheduled.(b) Annual inflation adjustments are incorporated in construction-related elements of the FRC.III-8
Estimating Costs<strong>Capital</strong> costs are estimated for each project according to industry data and <strong>District</strong>experience, and are expressed in current dollars. Each cost estimate has a plus and minusaccuracy range that varies depending on project planning stage as described inAssumption 21. The accuracy of each cost estimate is noted as a dollar range on theproject summary sheet. Unless stated otherwise, estimates include land acquisition,engineering services (planning, design, and construction management), construction,direct costs (including legal fees and administrative support), indirect costs (such asoffice maintenance and utilities, accounting, and other support services), andcontingencies.Cost estimates are expressed in current dollars, unless otherwise noted. According to theEngineering News Record (ENR), the Construction Cost Index for the Bay Areaincreased 7.2% from September 2006 to September 2007. Costs for projects in theprevious CIP have also been adjusted as appropriate to reflect recent price increases forconcrete, steel, and electrical work.Estimates of annual costs associated with operating and maintaining new capital facilitiesare based on unit costs developed in cooperation with the Operations & MaintenanceDepartment. Estimates for costs related to maintaining land owned by the <strong>District</strong> arebased on preliminary dollar per acre figures provided by the <strong>Water</strong>shed and LandsDivision.<strong>Capital</strong>, operating, and debt cost estimates are factored into the Financial Plan. TheFinancial Plan accounts for inflation over the ten-year CIP period for all costs exceptprojected debt service, by escalating costs for each project year by year. Debt service forlong-term debt is based on fixed payment schedules for each debt issue. Debt service forshort-term commercial paper is assumed at 3.5%. Starting in 2010, CVP water costs areincreased at approximately twice the rate of inflation due to the volatility ofReclamation’s rate setting methodology.Sources of FundingThe CIP Financial Plan includes a ten-year analysis of revenues and reserves necessary tofund CIP projects and the operating costs of the <strong>District</strong> including debt service. In orderto perform the analysis, the relative benefits to the untreated and treated water systemsand to existing and future customers have to be determined for each project.Project benefits to the treated and untreated water systems have been defined by programas indicated on Table III-1 found on page III-3. Projects related to water supply orcomponents of the untreated water system, such as the canal, are funded from untreatedwater revenues and/or reserves. Untreated water revenues include the untreated waterportion of the treated water rate; treated water customers currently account forapproximately 35% of untreated water revenues. Projects related to facilities in theTreated <strong>Water</strong> Service Area are funded from treated water revenues and/or reserves. TheIII-9
enefits of facilities and equipment required for administrative purposes are allocatedaccording to the proportion of <strong>District</strong> operating costs funded from untreated and treatedwater revenues, 38% and 62%, respectively.The threshold question in allocating benefits between existing and future customers iswhether a project is required irrespective of future development and growth, or onlybecause of future development and growth. Once this has been established, it isnecessary to determine whether a project directly or indirectly benefits the other categoryof customers. For example, an eight million gallon reservoir may be needed to meetcurrent storage deficits, but in order to accommodate future growth; a twelve milliongallon facility is built. Costs would be apportioned two-thirds to existing customers andone-third to future customers. The FRC is used to fund the portion of projects requiredfor growth; rate revenues, including reserves, are used to fund the portion benefitingexisting customers. Allocations are determined in the plans and studies identifyingcapital projects, not in the CIP.It is assumed for purposes of this CIP that allocations between existing and futurecustomers will be consistent with those in the final February 1998 FRC analysis(Montgomery Watson, Facility Reserve Charge Analysis, February 1998). Fundinginformation is provided for each project in the project summary section.III-10
Section IVPROGRAM SUMMARY
Section IV: <strong>Program</strong> SummaryThis section provides a summary of each of the ten program areas of the 2009 CIP. Each summarycontains a discussion of significant sub-programs and projects, the estimated funding required toaccomplish the projects, and a comparison to the program costs estimated in the 2008 CIP. A tableshowing proposed annual funding levels for each project is included for each program. A separateProject Summary for each of the projects is included in Section VII: Project Summaries.Table IV-1 provides a summary of total CIP expenditures by program over the ten-year period, alongwith a comparison to the 2008 CIP.Table IV-1 2009 CIP by <strong>Program</strong>(In millions of dollars, current dollars)<strong>Program</strong> 2009 CIP 2008 CIPAdministrative, Support, and Maintenance Facility <strong>Improvement</strong>s 8.0 4.6Delta Projects 96.3 96.7Equipment & Other <strong>Capital</strong> Purchases 14.8 15.2Expansion of Services 49.5 82.1Future <strong>Water</strong> Supplies 10.0 3.7Los Vaqueros <strong>Water</strong>shed and Recreation 5.1 4.8TW Distribution and Storage 74.6 66.7Untreated <strong>Water</strong> Supply & Transport 145.1 126.7<strong>Water</strong> Demand Reduction 8.0 7.0<strong>Water</strong> Treatment Facilities 113.9 96.0TOTAL 525.2 503.4Though projects are organized by program, funding is determined by priority level. For referencewhile reviewing program expenditures, Tables IV-2 and IV-3 show funding by priority and by fiscalyear for the 2009 CIP and 2008 CIP, respectively.IV-1
Table IV-2 2009 CIP by Fiscal <strong>Year</strong> and Priority(In millions of dollars, current dollars)FY09 FY10 FY11 FY12 FY13 FY14 FY15 FY16 FY17 FY18 TOTALPriority Level 1* 8.5 8.4 11.1 3.2 6.8 14.6 24.4 13.0 3.0 3.0 95.9Priority Level 2* 21.9 42.6 18.3 22.0 19.3 11.1 17.1 11.2 9.3 11.7 184.6Priority Level 3 0.8 9.4 11.4 53.0 36.1 22.8 1.6 13.6 13.5 0.0 162.3Total 8.5 8.4 11.1 3.2 6.8 14.6 24.4 13.0 3.0 3.0 442.8Debt-fundedCCWDDebt-fundedBrentwood42.3 15.7 0.0 0.0 0.0 0.3 1.3 9.3 9.2 0.0 78.14.3 0.0 0.0 0.0 0.0 0.0 0.0 0.0 0.0 0.0 4.3Grand Total 77.9 76.2 40.9 78.2 62.2 48.8 44.3 47.2 35.0 14.7 525.2* Excluding debt-funded projectsTable IV-3 2008 CIP by Fiscal <strong>Year</strong> and Priority(In millions of dollars, current dollars)FY08 FY09 FY10 FY11 FY12 FY13 FY14 FY15 FY16 FY17 TOTALPriority Level 1* 13.1 10.4 2.7 2.9 2.8 6.2 13.5 22.3 12.0 2.7 88.5Priority Level 2* 25.0 33.6 58.7 35.5 14.4 15.3 9.7 10.3 10.6 11.7 224.8Priority Level 3 3.2 5.4 5.0 6.1 43.9 31.6 14.2 1.3 11.7 13.7 136.1Total 41.3 49.4 66.3 44.4 61.1 53.1 37.3 33.9 34.3 28.1 449.3Debt-fundedCCWD 0.0 0.0 0.0 0.0 0.0 0.0 0.3 1.3 9.3 7.8 18.7Debt-fundedBrentwood 23.5 11.9 0.0 0.0 0.0 0.0 0.0 0.0 0.0 0.0 35.4Grand Total 64.8 61.3 66.3 44.4 61.1 53.1 37.6 35.2 43.6 35.9 503.4* Excluding debt-funded projectsIV-2
Administrative, Support, and Maintenance Facility <strong>Improvement</strong> <strong>Program</strong>In addition to water transmission, treatment, and storage facilities, the <strong>District</strong> operates a variety ofbuildings and facilities that support operation of the system and services to customers. The projectsin this program provide capital improvements to these facilities, including maintenance shops andoffices, the <strong>District</strong> Center, the Antioch Service Center buildings, and others. As <strong>District</strong> servicesexpand, so must the infrastructure of facilities that support those services. The <strong>District</strong> must alsocontinue to reinvest in its existing buildings and facilities to protect and maintain its capitalinvestment.The <strong>District</strong> Facilities Master Plan (FY1999) has been the key document guiding development of newfacilities. The Master Plan assessed space requirements based on current and future personnel,equipment, and operational needs. With the completion of the O&M Building Upgrade in FY2004,the Bisso Administration Building in FY2003, and new maintenance facilities in Concord andAntioch in FY2002, the high priority projects identified in the plan have been constructed. There areno additional new administrative facilities included in this CIP.The Annual Building and Facility <strong>Improvement</strong>s project (priority level 1, $4.3 million) provides forrenewal and replacement of existing <strong>District</strong> buildings and grounds. Typical improvements fundedunder this project include re-roofing, replacement or upgrading of heating, cooling and electricalsystems, and structural upgrades. A project to rewire the <strong>District</strong> Center’s communications systemsis planned for FY2011.Estimated expenditures in this program for the 2009 CIP are $8 million. Estimated funding for thisprogram, by fiscal year, is shown in Table IV-4. For comparison, 2008 CIP funding levels are alsoshown.Table IV-4 Administrative, Support and Maintenance Facility <strong>Improvement</strong> <strong>Program</strong>By Fiscal <strong>Year</strong>(In millions of dollars, current dollars)CIP FY08 FY09 FY10 FY11 FY12 FY13 FY14 FY15 FY16 FY17 FY18 10-YR. TOTAL2009 NA 1.0 3.6 0.6 0.4 0.4 0.4 0.4 0.4 0.4 0.4 8.02008 1.0 0.4 0.4 0.6 0.4 0.4 0.4 0.4 0.3 0.3 NA 4.6The projects proposed within this program are the following:• Annual Building and Facility <strong>Improvement</strong>s (priority level 1, $4.3 million)• Energy Demand Reduction (priority level 2, $150,000)• Solar Power Project (priority level 3, $3.5 million)Table IV-5 shows a comprehensive listing of projects within this program. The projects are groupedby sub-program and by priority within the sub-program. For comparison purposes, project costs asestimated in the 2008 CIP are also shown.IV-3
Comparison to 2008 CIPThere is a net increase of approximately $3.4 million for this program compared to the 2008 CIPestimate. The primary driver for the increase is the addition of a new $3.5 million placeholder SolarPower Project. This is a priority 3 project and is not funded in the financial plan. Grants and otherfunding are being sought for this project in order to meet the <strong>District</strong>’s investment criteria. There is aalso a new Energy Demand Reduction project (priority level 2, $150,000) that will evaluate the<strong>District</strong>’s current energy use and identify alternatives to reduce the <strong>District</strong>’s energy use andgreenhouse gas emissions.A. 2009 CIPTable IV-5 Projects within the Administrative, Support, andMaintenance Facility <strong>Improvement</strong> <strong>Program</strong>(In thousands of dollars, current dollars)Sub-Prog Project Priority FY09 FY10 FY11 FY12 FY13 FY14 FY15 FY16 FY17 FY18 TOTALFacilitiesUpgradesFacilitiesUpgradesFacilitiesUpgradesB. 2008 CIPAnnual Bldg. &Facility Imp.Energy DemandReductionSolar Project1 533 398 613 398 398 398 398 398 398 398 4,3302 150 1503 313 3,187 3,500PROGRAM TOTAL 996 3,585 613 398 398 398 398 398 398 398 7,980(In thousands of dollars, current dollars)Sub-Prog Project Priority FY08 FY09 FY10 FY11 FY12 FY13 FY14 FY15 FY16 FY17 TOTALFacilitiesUpgradesFacilitiesUpgradesAnnual Bldg. &Facility Imp.Bisso BuildingEmergency Generator1 398 371 371 571 371 371 371 371 371 371 3,9372 648 648PROGRAM TOTAL 1,046 371 371 571 371 371 371 371 371 371 4,585IV-4
Delta ProjectsThis program includes Delta projects that improve the <strong>District</strong>’s source water quality and supplyreliability. Sources of funding include outside agencies, CCWD revenues, and other local agencies.In the past five years, the <strong>District</strong> has completed the Rock Slough and Old River <strong>Water</strong> QualityProjects for CALFED, and has completed design of the Alternative Intake Project. The Rock Slough<strong>Water</strong> Quality project included removal of an existing agricultural drain on Veale Tract thatdischarged into Rock Slough. The Old River project included construction of a new pump stationand discharge outfall with a diffuser to minimize impacts from agricultural discharges into Old River.Estimated expenditures within this program over the next ten years are $96.3 million and include twoprojects. The Los Vaqueros Reservoir Expansion Project is a CALFED project being managed by the<strong>District</strong> and would help meet CCWD’s goals of increasing reliability (extending the amount ofemergency storage available to CCWD customers). The Alternative Intake Project is a pivotalinitiative in meeting the <strong>District</strong>’s goal of improving water quality. <strong>Water</strong> quality objectives will bemet 95% of the time with this project on line and both average and maximum delivered chlorideswould be lower.Estimated funding for this program, by fiscal year, is shown in Table IV-6. For comparison, programcosts from the 2008 CIP are also shown.Table IV-6 Delta Projects <strong>Program</strong>By Fiscal <strong>Year</strong>(In millions of dollars, current dollars)CIP FY08 FY09 FY10 FY11 FY12 FY13 FY14 FY15 FY16 FY17 FY18 10-YR.TOTAL2009 NA 51.8 41.3 3.1 96.32008 7.1 22.6 47.2 19.8 96.7The two projects proposed within this program are:• Alternative Intake Project (priority level 2, $88.5 million, escalated dollars)• Los Vaqueros Reservoir Expansion Project (priority level 2, $7.7 million)Table IV-7 shows a comprehensive listing of projects within this program. For comparison purposes,project costs as estimated in the 2008 CIP are also shown.IV-5
Comparison to 2008 CIPEstimated program costs have decreased by $0.4 million compared to the 2008 CIP. This is the netresult of progress towards completion and an increase in estimated project costs. Total costs for theAlternative Intake Project have increased by approximately $11 million to incorporate refinementsmade during design including increasing the pipeline diameter and adding variable frequency drivesto improve operational efficiencies. The construction schedule has also been accelerated byapproximately one year to bring the project online in FY2011.Los Vaqueros Expansion Project costs have increased by $1.3 million to reflect the remaining workrequired to complete the Environmental Impact Report/Environmental Impact Statement, which arescheduled to be released in Spring 2008.A. 2009 CIPTable IV-7 Projects within the Delta Projects <strong>Program</strong>(In thousands of dollars, current dollars)Sub-Prog Project Priority FY09 FY10 FY11 FY12 FY13 FY14 FY15 FY16 FY17 FY18 TOTALDelta Los Vaqueros7,7452 4,225 3,520Projects Expansion ProjectDeltaProjectsAlternative IntakeProjectPROGRAM TOTAL2 47,619 37,765 3,12351,844 41,285 3,12388,50796,252B. 2008 CIP(In thousands of dollars, current dollars)Sub-Prog Project Priority FY08 FY09 FY10 FY11 FY12 FY13 FY14 FY15 FY16 FY17 TOTALDeltaProjectsDeltaProjectsLos VaquerosExpansion ProjectAlternative IntakeProject2 2,845 3,555 6,4002 4,224 19,081 47,152 19,799 90,256PROGRAM TOTAL 7,069 22,636 47,152 19,799 96,656IV-6
Equipment and Other <strong>Capital</strong> Purchases <strong>Program</strong>Prudent planning requires that the <strong>District</strong> consider its long-term capital equipment needs as part ofits overall financial planning. This program provides a category within which to recognize thesecapital expenditures. Specific capital equipment designated for replacement is generally included inthe two-year budget. <strong>Capital</strong> equipment expenditures for larger items with a long life are includedwithin the context of the ten-year CIP.This program includes two sub-programs, Equity Funded Equipment ($7.1 million) and VehicleReplacement Fund ($7.6 million). Replacement of and upgrades to the <strong>District</strong>’s computer systems,telecommunications equipment, and SCADA are included in the first sub-program; replacement ofthe <strong>District</strong>’s fleet vehicles and heavy equipment are included in the second. Vehicles and heavyequipment are replaced when it is determined that they have reached the end of their serviceable lifeor when it is most cost-effective to replace based on anticipated future operating and repair costs.Replacements are funded from the Vehicle Replacement Fund, which is a sinking fund established bythe Board for this purpose. New vehicles require a business justification before they are added to thefleet.Estimated expenditures in this program over the ten-year CIP period are approximately $14.8 million.Estimated funding for this program, by fiscal year, is shown in Table IV-8. For comparison, 2008CIP funding levels are also shown.Table IV-8 Equipment and Other <strong>Capital</strong> Purchases <strong>Program</strong> by Fiscal <strong>Year</strong>(In millions of dollars, current dollars)CIP FY08 FY09 FY10 FY11 FY12 FY13 FY14 FY15 FY16 FY17 FY18 10-YR. TOTAL2009 NA 2.0 1.9 1.8 1.3 1.0 2.0 1.0 1.7 1.2 0.9 14.82008 1.8 2.6 1.4 2.3 1.6 1.1 1.1 1.0 1.1 1.2 NA 15.2Significant projects proposed in this program include the following:• Replacement/Upgrade of Computer Systems (priority level 2, $2.5 million)• Fleet Vehicles & Heavy Equipment (priority level 2, $4.3 million)• GIS Implementation (priority level 2, $0.7 million; level 3, $0.3 million)Table IV-9 shows a comprehensive listing of projects included in this program. The projects aregrouped by sub-program, and by priority level within the sub-program. For comparison purposes,project costs as estimated in the 2008 CIP are also shown.IV-7
Comparison to 2008 CIPTotal program costs have decreased by approximately $400,000 from the 2008 CIP. This is the netresult of adjustments for inflation, updated cost estimates, and progress on projects. Fleet Vehicles &Heavy Equipment have been combined into one sub-program in this CIP.Table IV-9 Projects within the Equipment and Other <strong>Capital</strong> Purchases <strong>Program</strong>A. 2009 CIP (In thousands of dollars, current dollars)Sub-Prog Project Priority FY09 FY10 FY11 FY12 FY13 FY14 FY15 FY16 FY17 FY18 TOTALEquity GIS2/3 452 213 128 193 986FundedEquityFundedEquityFundedEquityFundedEquityFundedEquityFundedEquityFundedVehicle Repl.FundLindsey BasinCommunications Reloc.Repl/Upgrade of RadioEquipmentRepl/Upgrade of CompSystemsRepl/Upgrade ofNetwork Systems andHardwareRepl/Upgrade ofSCADARepl/Upgrade ofTelecomm. Equip.Fleet Vehicles & HeavyEquipment2 374 3742 50 50 1002 86 123 86 86 123 971 123 691 86 123 2,4982 49 86 215 230 11 49 86 215 230 11 1,1822 200 640 100 100 134 134 1,3082 30 45 447 78 30 45 6752 750 750 822 661 640 871 812 815 818 700 7,639PROGRAM TOTAL 1,991 1,907 1,798 1,270 986 2,025 1,021 1,721 1,164 879 14,762B. 2008 CIP (In thousands of dollars, current dollars)Sub-Prog Project Priority FY08 FY09 FY10 FY11 FY12 FY13 FY14 FY15 FY16 FY17 TOTALEquity Funded GIS 2/3 495 265 200 120 180 1,260Equity Funded Lindsey BasinCommunications 2 120 320 440RelocationEquity Funded Repl/Upgrade ofRadio Equipment2 50 50 100Equity Funded Repl/Upgrade ofComp Systems2 183 965 80 565 80 115 80 115 80 115 2,378Equity FundedEquity FundedEquity FundedVehicle Repl.FundVehicle Repl.FundRepl/Upgrade ofNetwork Systemsand HardwareRepl/Upgrade ofSCADARepl/Upgrade ofTelecomm. Equip.Fleet VehiclesHeavy Equipment2 46 80 201 215 10 46 80 201 215 1,0942 90 130 300 500 100 100 1,2202 28 28 42 417 73 28 6162 303 467 491 456 425 367 491 428 431 434 4,2932 625 396 385 366 236 273 380 384 384 384 3,813PROGRAM TOTAL 1,804 2,627 1,408 2,305 1,576 1,118 1,097 1,007 1,096 1,176 15,214IV-8
Expansion of Services <strong>Program</strong>The purpose of this program is to improve and expand services, increase the competitiveness of the<strong>District</strong>, diversify revenue, and increase efficiencies (through, for example, sharing treatment plantfacilities). There are currently two projects in this program, both related to the City of Brentwood.The CCWD/Brentwood WTP project includes construction of new treatment facilities to serve thelong-term needs of Brentwood. Pursuant to the September 2004 Agreement between the <strong>District</strong> andthe City of Brentwood, this facility is being funded by the City of Brentwood and will be owned andoperated by the <strong>District</strong>. In addition, there is a planned expansion of this facility in the latter portionof the CIP. Estimated funding for this program is shown in Table IV-10.Table IV-10 Expansion of Services <strong>Program</strong> by Fiscal <strong>Year</strong>(In millions of dollars, current dollars)CIP FY08 FY09 FY10 FY11 FY12 FY13 FY14 FY15 FY16 FY17 FY18 10-YR. TOTAL2009 NA 5.4 0.2 3.8 11.1 18.9 10.0 49.52008 27.4 13.6 0.2 3.6 10.4 17.6 9.4 NA 82.1The significant projects within this program are:• CCWD/Brentwood WTP (priority level 1, $5.4 million)• CCWD/Brentwood WTP Expansion (priority level 1, $44 million)Table IV-11 shows a comprehensive listing of the projects included in this program. For comparisonpurposes, project costs estimated in the 2008 CIP are also shown.Comparison to 2008 CIP<strong>Program</strong> costs are $32.6 million lower than in the 2008 CIP. The primary driver for the decrease isthe completion of projects and progress on the CCWD/Brentwood WTP. The EBMUD Intertie,Pittsburg Emergency Intertie, and RBWTP Sedimentation basin projects were completed in FY2008.The construction schedule for the CCWD/Brentwood WTP has been accelerated approximately sixmonths with substantial completion in FY2008.Table IV-11 Projects within the Expansion of Services <strong>Program</strong>A. 2009 CIP(In thousands of dollars, current dollars)Sub-Prog Project Priority FY09 FY10 FY11 FY12 FY13 FY14 FY15 FY16 FY17 FY18 TOTALWholesale TW CCWD/Brentwood1 5,424 5,424WTPWholesale TW CCWD/Brentwood1 176 3,821 11,141 18,876 10,024 44,038WTP ExpansionPROGRAM TOTAL 5,424 176 3,821 11,141 18,876 10,024 49,462IV-9
B. 2008 CIP(In thousands of dollars, current dollars)Sub-Prog Project Priority FY08 FY09 FY10 FY11 FY12 FY13 FY14 FY15 FY16 FY17 TOTALEBMUD Intertie 1 1,052 1052Wholesale TW CCWD/BrentwoodWTP1 25,864 13,638 39,502Wholesale TW CCWD/BrentwoodWTP Expansion1 165 3,565 10,384 17,612 9,355 41,081Wholesale TW PittsburgEmergency Intertie1 282 282Wholesale TW RBWTP SedBasins1 160 160PROGRAM TOTAL 27,358 13,638 165 3,565 10,384 17,612 9,355 82,077IV-10
Future <strong>Water</strong> Supplies <strong>Program</strong>This program includes projects related to meeting future water supply requirements. These projectshelp meet CCWD’s goals of increasing water supply reliability (meeting all demands in normal yearsand at least 85% of supply in dry years for existing and future customers). The program currently hastwo projects, the Future <strong>Water</strong> Supply Study (FWSS) Updates and a placeholder for water supplyprojects identified in the FWSS. The FWSS was adopted by the Board in August 1996 and updatedin 2002. Updates are scheduled at approximately five-year intervals.The FWSS resulted in a long-range plan to ensure a reliable supply of high quality water for serviceto <strong>District</strong> customers. The Future <strong>Water</strong> Supplies Placeholder provides funding for projects,including purchases of water rights or other long-term supplies, required to implement this plan. TheFWSS examines both water supply and demand reduction alternatives for meeting future watersupply requirements. Funding to implement demand reduction recommendations is included in the<strong>Water</strong> Demand Reduction <strong>Program</strong>. The 2002 FWSS update did not result in a shift in the prioritiesamong new supplies, demand reduction, and recycling, all of which combine to meet future demand.However, the alternatives are currently being reviewed as part of the FY2008 study update.The Future <strong>Water</strong> Supplies Placeholder includes annual funding for new supplies for growth ($9.6million). <strong>Water</strong> purchases for future growth will be made only as funds are available. This project isfully funded by FRC revenues consistent with the projection used in the Financial Plan.Estimated funding for this program, $10 million, is shown by fiscal year in Table IV-12. Forcomparison, the 2008 CIP cost estimates are also shown.Table IV-12 Future <strong>Water</strong> Supplies <strong>Program</strong> by Fiscal <strong>Year</strong>(In millions of dollars, current dollars)CIP FY08 FY09 FY10 FY11 FY12 FY13 FY14 FY15 FY16 FY17 FY18 10-YR. TOTAL2009 NA 0.2 0.2 0.2 0.2 0.3 0.2 8.2 0.2 0.2 0.4 10.02008 0.4 0.2 0.2 0.2 0.2 0.3 0.2 1.9 0.2 0.2 NA 3.7The two projects within this program are:• Future <strong>Water</strong> Supplies Placeholder (priority level 2, $9.6 million)• Future <strong>Water</strong> Supply Study Updates (priority level 2, $0.4 million)Table IV-13 on page IV-12 shows a comprehensive listing of projects within this program. Forcomparison, 2008 CIP funding levels are also shown.Comparison to 2008 CIP<strong>Program</strong> costs have increased by approximately $6.3 million versus the 2008 CIP, with the entireincrease in the Future <strong>Water</strong> Supplies Placeholder. The amount for a large purchase in FY2015 wasincreased to reflect the quantity of water supply the <strong>District</strong> will be seeking to accommodate futuregrowth. This purchase will be fully funded by FRC revenues.IV-11
Table IV-13 Projects within the Future <strong>Water</strong> Supplies <strong>Program</strong>A. 2009 CIP(In thousands of dollars, current dollars)Sub-Prog Project Priority FY09 FY10 FY11 FY12 FY13 FY14 FY15 FY16 FY17 FY18 TOTALPlanning Future <strong>Water</strong> SupplyStudy Updates2 150 275 425<strong>Water</strong> Future <strong>Water</strong>Supplies Supplies Placeholder1/2 153 153 153 153 153 153 8,241 153 153 153 9,618PROGRAM TOTAL 153 153 153 153 303 153 8,241 153 153 428 10,043B. 2008 CIP(In thousands of dollars, current dollars)Sub-Prog Project Priority FY08 FY09 FY10 FY11 FY12 FY13 FY14 FY15 FY16 FY17 TOTALPlanning Future <strong>Water</strong> Supply2 274 115 389Study Updates<strong>Water</strong>SuppliesFuture <strong>Water</strong> SuppliesPlaceholder1/2 153 153 153 153 153 153 153 1,906 153 153 3,283PROGRAM TOTAL 427 153 153 153 153 268 153 1,906 153 153 3,672IV-12
Los Vaqueros <strong>Water</strong>shed and Recreation <strong>Program</strong>Projects within the Los Vaqueros <strong>Water</strong>shed and Recreation <strong>Program</strong> cover capital costs associatedwith owning and managing the Los Vaqueros watershed and related facilities. There are threeprojects in this program. The Los Vaqueros Recreation Facilities and Equipment Project provides forthe renewal and replacement of Los Vaqueros recreation facilities and equipment, including docks,rental boats, picnic tables and benches, and other miscellaneous recreational improvements. The<strong>Water</strong>shed projects are predominantly focused on meeting permit requirements but do help maintainwater quality in the reservoir and may increase revenues through leases of <strong>District</strong> lands for grazing,wind power, or other enterprises. The Recreation projects contribute to competitiveness bymaintaining customer satisfaction with the recreation program. The Land Acquisition project is alsoincluded in this program.Estimated expenditures for the program are shown in Table IV-14. The program total is $5.1 million.For comparison, 2008 CIP funding levels are also shown.Table IV-14 Los Vaqueros <strong>Water</strong>shed and Recreation <strong>Program</strong> by Fiscal <strong>Year</strong>(In millions of dollars, current dollars)CIP FY08 FY09 FY10 FY11 FY12 FY13 FY14 FY15 FY16 FY17 FY18 10-YR. TOTAL2009 NA 0.5 0.5 0.5 0.5 0.5 0.5 0.5 0.5 0.5 0.5 5.12008 0.5 0.5 0.5 0.5 0.5 0.5 0.5 0.5 0.4 0.4 NA 4.8The three projects proposed in this program are the following:• Los Vaqueros Recreation Facilities & Equipment (priority level 2, $1.3 million)• Land Acquisition (priority level 2, $1.4 million)• Los Vaqueros <strong>Water</strong>shed <strong>Improvement</strong>s (priority level 2, $2.3 million)Table IV-15 shows a comprehensive listing of the projects in this program. For comparisonpurposes, project costs as estimated in the 2008 CIP are also shown.Comparison to 2008 CIPProject costs were adjusted for inflation. There were no significant changes within this program.IV-13
Table IV-15 Projects within the Los Vaqueros <strong>Water</strong>shed and Recreation <strong>Program</strong>A. 2009 CIP(In thousands of dollars, current dollars)Sub-Prog Project Priority FY09 FY10 FY11 FY12 FY13 FY14 FY15 FY16 FY17 FY18 TOTALRecreation LV Rec Facilities andEquipment2 131 131 131 131 131 131 131 131 131 131 1,310<strong>Water</strong>shed Land Acquisition 2 144 144 144 144 144 144 144 144 144 144 1,440<strong>Water</strong>shed LV W/S <strong>Improvement</strong>s 1/2 234 234 234 234 234 234 234 234 234 234 2,340B. 2008 CIPPROGRAM TOTAL 509 509 509 509 509 509 509 509 509 509 5,090(In thousands of dollars, current dollars)Sub-Prog Project Priority FY08 FY09 FY10 FY11 FY12 FY13 FY14 FY15 FY16 FY17 TOTALRecreation LV Rec Facilities andEquipment2 131 122 122 122 122 122 122 122 122 122 1,229<strong>Water</strong>shed Land Acquisition 2 145 135 135 135 135 135 135 135 135 135 1,360<strong>Water</strong>shed LV W/S <strong>Improvement</strong>s 1/2 234 218 218 218 218 218 218 218 218 218 2,196PROGRAM TOTAL 510 475 475 475 475 475 475 475 475 475 4,785IV-14
Treated <strong>Water</strong> Distribution and Storage Facilities <strong>Program</strong>The objective of this program is to maintain and improve the level of service, quality, and safety ofthe <strong>District</strong>'s existing treated water system. Facilities organized under this program include treatedwater pipelines, reservoirs, and pump stations. Projects within this program provide for expansion oftreated water facilities to meet future needs as well as replacement of water mains and othercomponents of the treated water infrastructure. Investments identified within this program directlyadvance the <strong>District</strong>’s goals of increasing system reliability and improving delivered water qualityand indirectly help increase competitiveness by improving efficiencies and customer satisfaction. Akey component of this program is the Treated <strong>Water</strong> Service Area Master Plan (TWMP), which waslast updated in FY2008. The TWMP provides the planning basis for many significant projectsproposed in the CIP, including new pipelines, pump stations, and reservoirs. The Treated <strong>Water</strong>Renewal and Replacement Study (updated in FY2005) provides a schedule for renewal, replacement,and upgrades to existing pump stations, pipelines, and reservoirs.In the past five years, the <strong>District</strong> has invested $35 million in capital improvements within thisprogram, including approximately $1.5 million annually in main replacements, two new treated waterreservoirs, and rehabilitation of five existing reservoirs and seven treated water pump stations. Newstorage facilities increase system reliability for existing customers and provide storage capacitynecessary to accommodate future growth. Pump station rehabilitations ensure continued reliableservice and improve operational efficiencies by replacing older pumps and motors with more efficientmodels.Future expenditures of approximately $74.6 million are projected for this program over the next tenyears. Significant investments are proposed for upgrades to existing facilities (approximately $51million) and installation of new facilities ($1.4 million). The growth-related portion of new facilitiesis funded through the treated water FRC. The program also includes $18.5 million in developerfundedprojects. These investments directly advance the <strong>District</strong>’s goals of increasing systemreliability and improving delivered water quality and indirectly help increase competitiveness byimproving efficiencies and customer satisfaction.Proposed funding for this program, by fiscal year, is shown in Table IV-16. For comparison, 2008CIP funding levels are also shown.Table IV-16 Treated <strong>Water</strong> Distribution and Storage Facilities <strong>Program</strong> by Fiscal <strong>Year</strong>(In millions of dollars, current dollars)CIP FY08 FY09 FY10 FY11 FY12 FY13 FY14 FY15 FY16 FY17 FY18 10-YR. TOTAL2009 NA 13.0 10.9 7.7 6.6 5.5 6.2 5.2 6.2 5.5 7.7 74.62008 11.7 8.0 5.8 5.0 5.8 5.1 5.8 5.0 6.3 8.0 NA 66.7Significant projects proposed within this program include the following:• Pipeline Renewal/Replacement (Main Replacements) (priority level 2, $22 million)• Distribution Facilities - Developer Projects (priority level 1, $18.5 million)• Treated <strong>Water</strong> Facilities <strong>Improvement</strong> <strong>Program</strong> (priority level, 2 $16 million)IV-15
• Treated <strong>Water</strong> Reservoir Rehabilitation <strong>Program</strong> (priority level 2, $7 million)• Country Club Pump Station Rehabilitation (priority level 2, $2.2 million)Table IV-17 shows a comprehensive listing of projects proposed for this program. The projects aregrouped by sub-program, and by priority level within the sub-program. For comparison purposes,project costs from the 2008 CIP are also shown.Comparison to 2008 CIPTotal program costs have increased by $7.9 million from the 2008 CIP. The primary drivers for theincrease are a $5 million increase in Distribution Facilities – Developer Projects and a $3 millionincrease in the Pipeline Renewal/Replacement project. Costs within these programs have beenupdated to reflect changing market conditions.A. 2009 CIPTable IV-17 Projects within the Treated <strong>Water</strong> Distribution andStorage Facilities <strong>Program</strong>(In thousands of dollars, current dollars)Sub-Prog Project Priority FY09 FY10 FY11 FY12 FY13 FY14 FY15 FY16 FY17 FY18 TOTALCorrosion Corrosion Control 2 80 80 80 80 80 80 80 80 80 80 800Non-DistFundedPipeUpgradesDistribution Facilities -Developer ProjectsPipeline Renewal /ReplacementPipes - New MPP PressureSustaining ValvePipes - New Port Chicago Pipeline -Phase IISiteUpgradesSiteUpgradesStorage –NewStorage –UpgradesStorage -UpgradesTWSAPlanningTWSAPlanningCountry ClubExpansionTW Facilities<strong>Improvement</strong> <strong>Program</strong>Subzone 34 ReservoirTW Reliability<strong>Improvement</strong>sTW ReservoirRehabilitation <strong>Program</strong>TW Renewal/Replacement StudyTWSA Master PlanUpdates1 5,645 1,428 1,428 1,428 1,428 1,428 1,428 1,428 1,428 1,428 18,4972 2,667 2,367 2,367 2,367 2,033 2,033 2,033 2,033 2,033 2,033 21,9662 125 1252 125 1,034 1,1592/3 2,688 2,712 5,4002 1,709 2,091 1,500 1,550 1,500 1,550 1,500 1,550 1,500 1,550 16,0002 195 1952/3 857 1,988 2,8452 256 1,388 206 1,138 206 1,138 206 1,138 206 1,138 7,0202 130 120 2502 215 135 350PROGRAM TOTAL 13,045 10,923 7,699 6,563 5,462 6,229 5,247 6,229 5,492 7,718 74,607IV-16
B. 2008 CIP(In thousands of dollars, current dollars)Sub-Prog Project Priority FY08 FY09 FY10 FY11 FY12 FY13 FY14 FY15 FY16 FY17 TOTALCorrosion Corrosion Control 2 162 150 150 150 150 150 150 150 150 150 1,512Non-DistFundedPipeUpgradesDistribution Facilities -Developer ProjectsPipeline Renewal /ReplacementPipes - New MPP Delivery to Zone2Pipes - New Port Chicago Pipeline -Phase IISiteUpgradesSiteUpgradesSiteUpgradesStorage –NewStorage –NewStorage –UpgradesStorage -UpgradesTWSAPlanningTWSAPlanningCountry ClubExpansionPort <strong>Costa</strong> <strong>Water</strong>Service ReplacementTW Facilities<strong>Improvement</strong> <strong>Program</strong>Midhill II ReservoirSubzone 34 ReservoirTW Reliability<strong>Improvement</strong>sTW ReservoirRehabilitation <strong>Program</strong>TW Renewal/Replacement StudyTWSA Master PlanUpdates1 1,455 1,292 1,292 1,292 1,292 1,292 1,292 1,292 1,292 1,292 13,0832 2,094 1,875 1,875 1,875 1,875 1,875 1,875 1,875 1,875 1,875 18,9692 353 3532 81 500 2,738 3,3192 165 875 1,0402 471 4712 2,316 1,393 1,443 1,393 1,443 1,393 1,443 1,393 1,443 1,393 15,0532 2,681 2,6812 200 2002/3 375 2,266 2,6412 1,530 191 1,073 191 1,073 191 1,073 191 1,073 191 6,7772 130 120 2502 123 215 338PROGRAM TOTAL 11,725 8,042 5,833 5,031 5,833 5,116 5,833 4,982 6,333 7,959 66,687IV-17
Untreated <strong>Water</strong> Supply and Transport <strong>Program</strong>This program includes projects to improve source water quality and to enhance, renew, and expandthe <strong>District</strong>'s untreated water facilities. Facilities included in this program are diversion facilities, theMulti-Purpose Pipeline (MPP), the Los Vaqueros pipelines, the <strong>Contra</strong> <strong>Costa</strong> Canal, andimprovements within the canal right-of-way such as fencing, bridges, drainage facilities, serviceroads, and other features. The program has been divided into five sub-programs including Untreated<strong>Water</strong> Facilities-Seismic Reliability <strong>Improvement</strong> Project (UWF-SRIP), Untreated <strong>Water</strong> Facilities-New (UWF-New), Untreated <strong>Water</strong> Facilities-Planning (UWF-Planning), Untreated <strong>Water</strong> Facilities-Upgrades (UWF-Upgrades), and Non-<strong>District</strong> Funded. The program directly advances the <strong>District</strong>’sgoal of increasing system reliability and increases competitiveness by ensuring capacity is availableto meet the needs of new customers.The <strong>District</strong> has invested approximately $110 million under this program in the past five years tomaintain and enhance the reliability and capacity of the untreated water conveyance facilities.Implementation of the capacity and reliability projects recommended in the SRIP study has been thefocus of this program for several years, which included construction of the MPP and rehabilitation ofthe Mallard Slough Pump Station. These projects assist in meeting near-term and long-term demandsand significantly improved the <strong>District</strong>’s ability to continue water deliveries after a major earthquake.Other improvements completed include structural, electrical, and mechanical upgrades to the RockSlough pumping plants and relining of high priority sections of the canal. The pump stationrehabilitations improve the <strong>District</strong>’s ability to reliably provide water service and improve operationalefficiencies by replacing older, less efficient equipment. Canal lining repairs improved operationalefficiencies by reducing water losses.With completion of Phase 1 of the MPP, an increased emphasis is being placed on protecting sourcewater quality. The Canal Replacement Project, which will protect source water quality as well asprovide flood protection and enhance public safety, is included in this program. Additional sourcewater quality improvement projects are in the Delta Projects <strong>Program</strong>. The Canal ReplacementProject (priority level 1, $13.5 million; level 2, $13 million; priority level 3, $55.3 million) willimprove source water quality at the Rock Slough Intake by hydraulically isolating the salinegroundwater from the canal. The project also improves flood protection and enhances public safetyand security by replacing the unlined canal with a buried pipeline. Much of this project will befunded by others, including US Corps of Engineers, Reclamation, developers, State bond funds, andother State and federal funding programs.The other area of significant investment is the Untreated <strong>Water</strong> Facilities-Upgrades sub-program. Itcontains seven projects in addition to the Canal Replacement Project to renew, replace, and upgradeexisting untreated water facilities for a total of approximately $36 million. The largest of the sixprojects is the Untreated <strong>Water</strong> Facilities <strong>Improvement</strong> <strong>Program</strong> (priority level 2, $19.6 million),which funds projects identified in the Untreated <strong>Water</strong> Facilities <strong>Improvement</strong> Plan such as pumpingplant improvements and replacement of canal lining, and improvements to the Los Vaqueros projectpumps and pipelines.IV-18
Projects totaling approximately $145.1 million for the ten-year CIP period are proposed for thisprogram. Estimated funding for this program, by fiscal year, is shown in Table IV-18. Forcomparison, 2008 CIP funding estimates are also shown.Table IV-18 Untreated <strong>Water</strong> Supply and Transport <strong>Program</strong> by Fiscal <strong>Year</strong>(In millions of dollars, current dollars)CIP FY08 FY09 FY10 FY11 FY12 FY13 FY14 FY15 FY16 FY17 FY18 10-YR. TOTAL2009 NA 3.2 11.5 14.6 22.2 21.6 12.8 7.3 25.0 24.7 2.1 145.12008 9.2 8.5 3.9 9.0 13.7 17.8 11.4 6.5 23.1 23.6 NA 126.7Significant projects proposed within this program include the following:• Canal Replacement Project (priority level 1, 13.5 million; level 2, $13 million; prioritylevel 3, $55.3 million)• Untreated <strong>Water</strong> Facilities <strong>Improvement</strong> <strong>Program</strong> (priority level 2, $19.6 million)• Untreated <strong>Water</strong> Pipeline (priority level 2, $20 million)Table IV-19 shows a comprehensive listing of projects within this program. The projects are groupedby sub-program and by priority level within the sub-program. For comparison purposes, project costsas estimated in the 2008 CIP are also shown.Comparison to 2008 CIP<strong>Program</strong> costs in the 2009 CIP are $18.4 million higher than in the 2008 CIP. Costs for the CanalReplacement Project have been increased by $12.4 million based on an updated cost estimate. Thisproject has also been delayed for up to two years because of the unsettled operational constraints thatmay affect the <strong>District</strong>’s Delta operations in 2008 (e.g., Judge Wanger’s decision, the <strong>District</strong>’s CVPwater allocation, less than average water year to-date). Other changes to this program include anincrease in the Los Vaqueros Energy Recovery Project of approximately $1.3 million to reflectupdated cost information. This project has been moved from a priority level 3 to priority level 2 andgrants are being sought to fund up to 50 percent of the project costs. Other projects have beenadjusted as necessary for inflation.A new $2 million project has also been added to rehabilitate the <strong>District</strong>’s untreated water revenuemeter data loggers. The existing data collection equipment has reached the end of its useful life andis being upgraded to maintain accurate revenue metering for the <strong>District</strong>. The <strong>District</strong> has twenty fiveuntreated water metering sites to be upgraded with reliable electrical power systems and datacollection/telemetry equipment. Twelve of the twenty five metering sites represent Customers whoseconsumption charges are greater than $1 million per year.IV-19
Table IV-19 Projects within the Untreated <strong>Water</strong> Supply and Transport <strong>Program</strong>A. 2009 CIP(In thousands of dollars, current dollars)Sub-Prog Project Priority FY09 FY10 FY11 FY12 FY13 FY14 FY15 FY16 FY17 FY18 TOTALNon-<strong>District</strong>FundedUWF –PlanningUWF –PlanningApplicant FundedProjectsLos Vaqueros EnergyRecoveryUntreated <strong>Water</strong>Facility Imp PlanUpdatesUWF - SRIP Untreated <strong>Water</strong>PipelineUWF -UpgradesUWF -UpgradesUWF -UpgradesUWF -UpgradesUWF -UpgradesUWF -UpgradesUWF -UpgradesUWF -UpgradesCanal ReplacementProjectLVP Relocation @BalfourMallard SloughChannelRehabilitationRock Slough FishScreenRock Slough<strong>Improvement</strong>sUntreated <strong>Water</strong>Facilities<strong>Improvement</strong> <strong>Program</strong>Untreated <strong>Water</strong>Reservoir RehabUntreated waterRevenue MeterUpgrades1 185 185 185 185 185 185 185 185 185 185 1,8502/3 50 645 1,825 2,030 4,5502 375 210 5852 333 1,325 9,260 9,164 20,0821/2/3 60 5,455 8,616 12,424 16,595 9,921 1,556 13,637 13,507 81,7711 466 2,534 3,0002/3 150 130 253 2,767 3,3001 10 10 10 10 10 502 120 165 335 2,987 2,975 6,5822 2,220 2,665 1,930 1,830 1,880 1,880 1,730 1,730 1,880 1,880 19,6251/3 202 439 1,093 1,7342 230 1,780 2,010PROGRAM TOTAL 3,227 11,474 14,622 22,233 21,645 12,785 7,330 25,022 24,736 2,065 145,139IV-20
B. 2008 CIP(In thousands of dollars, current dollars)Sub-Prog Project Priority FY08 FY09 FY10 FY11 FY12 FY13 FY14 FY15 FY16 FY17 TOTALNon-<strong>District</strong>FundedUWF –PlanningUWF –PlanningApplicant FundedProjectsLos Vaqueros EnergyRecoveryUntreated <strong>Water</strong>Facility Imp PlanUpdatesUWF - SRIP Untreated <strong>Water</strong>PipelineUWF -UpgradesUWF -UpgradesUWF -UpgradesUWF -UpgradesUWF -UpgradesUWF -UpgradesUWF -UpgradesUWF -UpgradesCanal ReplacementProjectLVP Relocation @BalfourMallard SloughChannelRehabilitationRock Slough FishScreenRock Slough<strong>Improvement</strong>sStormwaterRemediationUntreated <strong>Water</strong>Facilities<strong>Improvement</strong> <strong>Program</strong>Untreated <strong>Water</strong>Reservoir Rehab1 159 170 170 170 170 170 170 170 170 170 1,6892/3 3 50 757 2,401 3,2112 375 210 5852 333 1,318 9,259 7,819 18,7291/2/3 5,207 5,115 50 1,450 6,360 15,829 8,598 1,270 11,746 13,736 69,3611 430 2,070 2,5003 130 345 1,260 1,7351 52 28 802 169 165 335 2,987 2,975 6,6312 698 220 9182 1,961 1,850 1,952 2,019 1,760 1,845 1,859 1,695 1,709 1,859 18,5091/3 915 804 1,020 2,739PROGRAM TOTAL 9,164 8,532 3,872 9,018 13,666 17,844 11,390 6,523 23,094 23,584 126,687IV-21
<strong>Water</strong> Demand Reduction <strong>Program</strong>This program includes the <strong>District</strong>’s <strong>Water</strong> Conservation <strong>Program</strong>, which is split into four distinctelements including: 1) Residential <strong>Water</strong> Audits/Plumbing Retrofit, 2) Landscape <strong>Water</strong>Conservation Audits, 3) Commercial/Industrial and Institutional (CII) <strong>Water</strong> Conservation Audits,and 4) <strong>Water</strong> Conservation Incentives. The program meets the goals of the <strong>District</strong>’s Future <strong>Water</strong>Supply Study (FWSS) and conforms to the requirements of the U.S. Bureau of Reclamation(Reclamation) water supply contract. The Reclamation contract requires the <strong>District</strong> to implementthe Best Management Practices (BMPs) for water conservation as prescribed in the Memorandum ofUnderstanding for Urban <strong>Water</strong> Conservation in California. The long-term water conservationprogram savings goal in the FWSS is to reduce demand by five percent of what demand is projectedto be in 2040, a goal of approximately 10,000 acre-feet annually. The <strong>Water</strong> Conservation <strong>Program</strong>is estimated to save 3,000 acre-feet of water in FY2008 and is on track to meet the long-term FWSSgoal.Of the four <strong>Water</strong> Conservation <strong>Program</strong> elements described in the CIP, only the <strong>Water</strong> ConservationIncentives project is capital. The other three are funded as part of the operating budget. Only thecapital project is included in program and CIP cost estimate totals. The ten-year estimated cost forthe <strong>Water</strong> Conservation Incentives project is $8 million. The <strong>District</strong> applies for and is awardedgrants on a regular basis to help fund this program.Estimated funding for the capital portion of the program, by fiscal year, is shown in Table IV-20. Forcomparison, 2008 CIP funding levels are also shown.Table IV-20 <strong>Water</strong> Demand Reduction <strong>Program</strong> by Fiscal <strong>Year</strong>(In millions of dollars, current dollars)CIP FY08 FY09 FY10 FY11 FY12 FY13 FY14 FY15 FY16 FY17 FY18 10-YR. TOTAL2009 NA 0.8 0.8 0.8 0.8 0.8 0.8 0.8 0.8 0.8 0.8 8.02008 1.1 0.7 0.7 0.7 0.7 0.7 0.6 0.6 0.6 0.6 NA 7.0The only capital project proposed in this program is the following:• <strong>Water</strong> Conservation Incentives (priority level 1, $8 million)Also shown but not included in CIP or program totals are the following operating projects andestimated costs:• Residential <strong>Water</strong> Audits/Plumbing Retrofit ($3.5 million)• Landscape Conservation ($2 million)• Commercial/Industrial Conservation ($1.6 million)Table IV-21 shows a comprehensive listing of projects within this program. For comparisonpurposes, project costs as estimated in the 2008 CIP are also shown.IV-22
Comparison to 2008 CIPProject costs have increased by approximately $1 million compared to the 2008 CIP. This is theresult of inflation and increased program activity and device distribution. The <strong>District</strong> has beensuccessful in obtaining grants for conservation activities. Of the $8 million costs indicated in theCIP, approximately $2 million is anticipated to come from grants and other outside sources.The three operating budget projects are included to give an overview of the cost of the <strong>Water</strong>Demand Reduction <strong>Program</strong> but they are not included in the total CIP cost.Table IV-21 Projects within the <strong>Water</strong> Demand Reduction <strong>Program</strong>A. 2009 CIP(In thousands of dollars, current dollars)Sub-Prog Project Priority FY09 FY10 FY11 FY12 FY13 FY14 FY15 FY16 FY17 FY18 TOTALBMPs <strong>Water</strong> Conservation1 801 801 801 801 801 801 801 801 801 801 8,010IncentivesBMPsBMPsBMPsPROGRAM TOTAL 801 801 801 801 801 801 801 801 801 801 8,010Commercial/Indust.ConservationLandscapeConservationRes. Audits/PlumbingRetrofitOPERATINGBUDGET TOTAL*NA 155 155 155 155 155 155 155 155 155 155 1,550NA 202 202 202 202 202 202 202 202 202 202 2,020NA 350 350 350 350 350 350 350 350 350 350 3,500707 707 707 707 707 707 707 707 707 707 7,070B. 2008 CIP(In thousands of dollars, current dollars)Sub-Prog Project Priority FY08 FY09 FY10 FY11 FY12 FY13 FY14 FY15 FY16 FY17 TOTALBMPs <strong>Water</strong> ConservationIncentives1 1,058 665 665 665 665 665 665 665 665 665 7,043BMPsBMPsBMPsPROGRAM TOTAL 1,058 665 665 665 665 665 665 665 665 665 7,043Commercial/Indust.ConservationLandscapeConservationRes. Audits/PlumbingRetrofitOPERATINGBUDGET TOTALNA 149 151 151 151 151 151 151 151 151 151 1,508NA 194 196 196 196 196 196 196 196 196 196 1,958NA 337 340 340 340 340 340 340 340 340 340 3,397680 687 687 687 687 687 687 687 687 687 6,863IV-23
<strong>Water</strong> Treatment Facility <strong>Improvement</strong>s <strong>Program</strong>The <strong>District</strong>'s water treatment facilities are an essential element in providing high-quality water to itstreated water customers. This program involves projects for replacing, improving, and enhancingthese facilities to maintain and enhance water quality and system reliability. The projects areorganized into three sub-programs: Treatment Plant Upgrades, Treatment Plant Expansion, andPlanning. The <strong>Water</strong> Treatment Plant (WTP) Master Plan, completed in FY2004, provides theplanning basis for both renewal and replacement projects and new facilities related to reliability andregulatory requirements at both treatment plants.The <strong>District</strong> has invested over $20 million dollars in the last five years to improve and maintain watertreatment facilities, including completion of a third sedimentation basin at the Bollman <strong>Water</strong>Treatment Plant. Other upgrades to the plant include enhanced electrical power systems, seismicimprovements, and safer facilities for the storage and use of chemicals.The <strong>District</strong> is also constructing treatment facilities for the City of Brentwood to serve the City’scustomers outside of the Los Vaqueros service area under the Expansion of Services program. Thatproject will be completed in FY2009 and an expansion of the plant to up to 30 MGD is scheduled tobegin as early as FY2012.<strong>Program</strong> funding for the next ten years is estimated at $113.9 million and includes $10.7 million, $4.3million, and $1.9 million in priority level 2 WTP improvements at the Bollman, Randall-Bold, andCity of Brentwood treatment facilities, respectively. These improvements include renewal andreplacement of WTP facilities, media replacement, and treatment plant restoration activities.Additionally, the program includes an $80 million priority level 3 membrane filtration project thatcould be necessary to meet increasingly stringent treatment regulations with increasingly degradedsource water. This is a priority level 3 project because the scope and timing is uncertain at this time.Estimated funding for this program, by fiscal year, is shown in Table IV-22. For comparison, 2008CIP funding levels are also shown.Table IV-22 <strong>Water</strong> Treatment Facility <strong>Improvement</strong>s <strong>Program</strong> by Fiscal <strong>Year</strong>(In millions of dollars, current dollars)CIP FY08 FY09 FY10 FY11 FY12 FY13 FY14 FY15 FY16 FY17 FY18 10-YR. TOTAL2009 NA 1.3 6.1 10.8 45.9 28.1 14.6 1.7 2.1 1.5 1.7 113.92008 4.7 4.1 6.4 6.4 38.2 23.7 7.3 1.7 2.0 1.5 NA 96.0Significant projects proposed in this program include the following:• Bollman WTP <strong>Improvement</strong>s (priority level 2, $10.7 million; level 3, $5.2 million)• Randall-Bold WTP <strong>Improvement</strong>s (priority level 2, $4.3 million; level 3, $4.7 million)• City of Brentwood WTP <strong>Improvement</strong>s (priority level 2, $1.9 million; level 3, $0.6million)• Membrane Filtration Placeholder (priority level 3, $80 million)IV-24
Table IV-23 shows a comprehensive listing of projects within this program. The projects are groupedby sub-programs and by priority level within sub-program. For comparison purposes, project costs asestimated in the 2008 CIP are also shown.Comparison to 2008 CIPTotal funding for this program has increased by approximately $17.9 million from the 2008 CIP. Theprimary driver for the increase in this program is an increase in the cost estimate for the MembraneFiltration Placeholder Project. The estimated cost of this project was increased by $18 million basedon recent feasibility studies completed by other agencies. This is a priority level 3 project and doesnot impact rates. Other adjustments were made to project costs to reflect inflation and progress todate. A new priority 3 project (Randall-Bold Capacity Upgrades) was added to potentially increasethe capacity of the existing Randall-Bold WTP to up to 50 MGD.Table IV-23 Projects within the <strong>Water</strong> Treatment Facility <strong>Improvement</strong>s <strong>Program</strong>A. 2009 CIP (In thousands of dollars, current dollars)Sub-Prog Project Priority FY09 FY10 FY11 FY12 FY13 FY14 FY15 FY16 FY17 FY18 TOTALExpansion Drinking <strong>Water</strong> Lab 3 400 1,600 2,000Planning WTPMP Updates andPlaceholder2 210 245 882 882 882 882 3,983Upgrades Bollman WTP<strong>Improvement</strong>s2/3 821 5,582 5,288 755 202 755 755 755 202 755 15,870Upgrades City of BrentwoodWTP <strong>Improvement</strong>s2/3 110 374 96 889 363 363 363 2,558Upgrades Membrane Filtration 3 4,295 39,529 24,839 11,337 80,000Upgrades Randall-Bold WTP<strong>Improvement</strong>s2/3 322 166 629 2,719 2,482 2,289 96 96 96 96 8,991Upgrades Randall-BoldCapacity Upgrades3 93 407 500PROGRAM TOTAL 1,253 6,122 10,801 45,899 28,096 14,626 1,733 2,096 1,543 1,733 113,902B. 2008 CIP (In thousands of dollars, current dollars)Sub-Prog Project Priority FY08 FY09 FY10 FY11 FY12 FY13 FY14 FY15 FY16 FY17 TOTALExpansion Drinking <strong>Water</strong> Lab 3 371 1,490 1,861Planning WTPMP Updates andPlaceholder2 210 245 880 880 922 3,137Upgrades Bollman WTP<strong>Improvement</strong>s2/3 4,559 3,364 4,483 2,673 748 209 748 748 748 209 18,489Upgrades City of BrentwoodWTP <strong>Improvement</strong>s2/3 110 335 94 805 324 324 324 2,316Upgrades Membrane Filtration 3 3,100 34,110 20,610 4,180 62,000Upgrades Randall-Bold WTP<strong>Improvement</strong>s2/3 125 255 90 533 2,510 2,317 2,092 90 90 90 8,192PROGRAM TOTAL 4,684 4,100 6,398 6,400 38,173 23,670 7,315 1,768 2,092 1,595 95,995IV-25
Section VOPERATING COST IMPACTS OF THECAPITAL IMPROVEMENT PROGRAM
Section V: Operating Cost Impacts of the <strong>Capital</strong> <strong>Improvement</strong> <strong>Program</strong>Implementation of the CIP affects <strong>District</strong> operating costs. Adding new facilities canresult in increases in operating costs as additional labor or materials are needed to operateand maintain the facilities. Other capital facilities, such as the CCWD/Brentwood <strong>Water</strong>Treatment Plant, will generate payments from the City of Brentwood, which willcompletely offset the <strong>District</strong>’s costs to operate and maintain the plant. Some capitalprojects yield improved efficiency and productivity resulting in reduced operating costs.To be an effective long-range financial planning tool, the CIP must consider the capitalcosts of constructing facilities, income generated by facilities, and the resulting impactson operating costs.This section provides background on <strong>District</strong> operating costs, an overview of theoperating impacts of the CIP, and a discussion of specific impacts on labor and energy.The operating impacts are factored into the Financial Plan along with capital costs, debtservice,and overall operating costs. The operating impacts of individual projects aredescribed in Section VII: Project Summaries.Current Operating CostsBackgroundProjected operating costs for the first year of the 2009 CIP are $66.9 million. The actualoperating budget for FY2009 will be determined through the budget process. Significantoperating costs include labor, power, purchased water, and chemicals. In the FinancialPlan, operating costs are assumed to increase by 4% annually, with the exception of CVPwater costs that increase at approximately twice the rate of inflation. Operating costimpacts resulting from capital projects are incorporated into the operating costprojections in the year the facility comes on line. In addition, the Financial Plananticipates an increase in operating costs resulting from fees assessed by State andFederal agencies to implement Delta improvements that result from the Delta Visionprocess. It is anticipated that the <strong>District</strong> may be required to contribute to the funding ofprojects and programs aimed at fixing the Delta. As a proactive measure to ensure thefinancial impacts of this additional expense are minimized, this CIP includesapproximately $2 million in annual revenues beginning in FY2010 to cover these costs.Operating Cost Impacts AssumptionsOperating cost impacts are determined for each project based on current costs to operatesimilar facilities, industry standards, or market trends. Operating costs include labor,materials, supplies, equipment, and administrative costs. Total operating cost impacts asshown are net of savings that might also result from the project. The two operating costcomponents most affected by capital projects are labor and energy, both of which arediscussed later in this section. Impacts on labor operating costs are net only of laborsavings and not savings in other operating costs to ensure the full impact on labor isidentified. For example, savings in energy or chemicals due to a more efficient facilitywould not reduce the need for staff to maintain the facility. Energy impacts presented areV-1
net increases or savings in energy usage for each project. Operating costs are assumed tostart in the year scheduled for the project’s completion, and are pro-rated by half-year.The impact of capital projects on operating labor costs differs by type of facility.Operating labor costs reflect current proportions of labor to total operating costs by typeof facility or activity. To estimate full time equivalent employees, the operating laborcost is divided by an assumed cost of employment. For purposes of the CIP, the assumedcost of employment is set at $100,000 per year per new employee, reflecting salaries andbenefits, plus equipment, supplies, training, administrative support, and other <strong>District</strong>costs of support. Other costs of employment may be used if specific staffing plans havebeen completed. Actual salaries would vary depending on classification, hours worked,etc. Because of the uncertainty surrounding this assumption, the number of full timeequivalents related to implementation of this CIP is presented as a range of plus or minus25 percent.Summary of Operating Cost ImpactsThe following tables show the increase in total operating costs (Table V-1), labor costs(Table V-2) and energy costs (Tables V-3) resulting from CIP projects by fiscal year.Projects and sub-programs with significant impacts have been individually listed. Adiscussion of the significance of the increase to rates or staffing needs follows each tableas appropriate. Significant operating impacts from priority level 3 projects are shownseparately because they are not included in the CIP Financial Plan.Annual Total Operating Cost Increases - The net increase in total operating costs relatedto capital projects is shown in the following tables.Table V-1 Net Increase in Total O&M by Fiscal <strong>Year</strong>(In thousands of dollars, current dollars)PROJECT PROG FY09 FY10 FY11 FY12 FY13 FY14 FY15 FY16 FY17 FY18 TOTALCCWD/Brentwood<strong>Water</strong> Treatment PlantExp 1,740 1,772 1,806 1,842 1,879 1,918 1,959 2,002 2,047 2,094 19,059Applicant Funded TW 70 80 90 100 110 120 130 140 150 160 1,150New Reservoir subprogramAlternative IntakeProjectTW 8 17 17 17 17 17 17 17 17 17 161UW 150 300 300 300 300 300 300 300 2,250Applicant Funded UW 15 17 19 21 23 25 27 29 31 33 240EBMUD Intertie UW 50 100 100 100 100 100 100 100 100 850LV Energy Recovery UW (185) (370) (370) (370) (370) (370) (2,035)Rock Slough FishScreenBollman WTP<strong>Improvement</strong>sR-B WTP<strong>Improvement</strong>sUW 75 150 150 150 150 150 825WTP 50 50 50 50 50 50 50 50 50 50 500WTP 90 90 90 90 90 90 90 90 90 90 900TOTAL PRIORITY 1&2 1,973 2,076 2,322 2,520 2,459 2,400 2,453 2,508 2,565 2,624 23,900Membrane Filtration WTP 3,300 6,600 6,600 6,600 23,100Solar Power Project ADM (55) (110) (110) (110) (110) (110) (110) (110) (825)TOTAL PRIORITY 3 (55) (110) (110) (110) 3,190 6,490 6,490 6,490 22,275V-2
A measure of the potential impact on rates is the increase in annual operating costs as aresult of bringing new capital facilities online. By FY2018, the annual increase reachesapproximately $2.6 million. Operating costs for the CCWD/Brentwood <strong>Water</strong> TreatmentPlant will be funded by the City, which accounts for approximately 80% of the increase.As shown in Table V-1, annual operating costs for individual projects tend to beconsistent from year to year while costs for sub-programs increase over time. Thisincrease is a result of new facilities being added on a continuous basis throughout the CIPperiod.The projects with the most significant operating impacts are Rock Slough Fish Screen,Alternative Intake, and the CCWD/Brentwood <strong>Water</strong> Treatment Plant, all of which aremore fully described below. The cumulative total operating impact of applicant-fundedprojects (untreated and treated water) is also significant, adding $193,000 per year by thelast year of the CIP. Applicants pay only for capital costs; however, because applicantprojects result in growth to the system, these additional operating costs are generallycovered by the rates paid by the added customers.Alternative Intake Project (FY2011): $300,000/year (current dollars)Operating costs associated with this project are predominantly related to new pumpingand conveyance facilities and include incremental power ($50,000), labor ($100,000),levee maintenance ($100,000), and other miscellaneous activities such as fish monitoringand site maintenance.Rock Slough Fish Screen (FY2013): $150,000/year (current dollars)Operating costs associated with the fish screen include power, fish monitoring activities,and dredging. Of the total operating costs, approximately $100,000 are for labor and$50,000 is for energy costs related to screen cleaning, fish monitoring, and othermaintenance activities.CCWD/Brentwood <strong>Water</strong> Treatment Plant (FY2009): $1,740,000/year (current dollars)Operating costs associated with the new treatment plant include plant staff, chemicals,and power. Of the total operating costs, approximately $1,100,000 is attributed to laborand $640,000 to chemical and energy costs. Operating costs increase in later years due toexpected increases in plant production. Additional operating expenses for futureexpansion of the CCWD/Brentwood <strong>Water</strong> Treatment Plant have not been included in theCIP due to the uncertainty in the timing of the project.The potential future impact on operating costs related to the priority level 3 projects, ifimplemented, is significant. By FY2018, the annual increase reaches approximately $6.5million.Annual Operating Labor Cost ImpactsThe portion of the projected increase in operating costs related to labor is presented inTable V-2.V-3
Table V-2 Net Increase in Operating Labor by Fiscal <strong>Year</strong>(in thousands of dollars, current dollars)PROJECT PROG FY09 FY10 FY11 FY12 FY13 FY14 FY15 FY16 FY17 FY18 TOTALCCWD/Brentwood<strong>Water</strong> Treatment Plant*Exp 1,100 1,100 1,100 1,100 1,100 1,100 1,100 1,100 1,100 1,100 11,000Applicant Funded TW 35 40 45 50 55 60 65 70 75 80 575New Reservoir subprogramAlternative IntakeProjectTW 8 17 17 17 17 17 17 17 17 17 161UW 50 100 100 100 100 100 100 100 100 850Applicant Funded UW 8 9 10 11 12 13 14 15 16 17 125EBMUD Intertie UW 3 5 5 5 5 5 5 5 5 43LV Energy Recovery UW 25 50 50 50 50 50 275Rock Slough FishScreenUW 50 100 100 100 100 100 550Bollman WTP WTP 8 8 8 8 8 8 8 8 8 8 80R-B WTP WTP 8 8 8 8 8 8 8 8 8 8 80TOTAL PRIORITY 1&2 1,167 1,235 1,293 1,299 1,380 1,461 1,467 1,473 1,479 1,485 13,739Additional Staff 6 1 1 1 9Membrane Filtration WTP 80 160 160 160 560Solar Power ProjectADMTOTAL PRIORITY 3 80 160 160 160 560Additional Staff 1 1* CCWD/Brentwood <strong>Water</strong> Treatment Plant assumed to be staffed with four operators and two maintenance mechanics. Fixed laborcosts are estimated to be $1,100,000 based on the Final Preliminary Design Report. .Labor costs do not include <strong>District</strong> overhead.By the tenth year of the CIP, operating and maintaining <strong>District</strong> facilities will require anincrease in annual labor expenditures of approximately $1.5 million, the majority ofwhich is funded by the City of Brentwood. The analysis of impact on labor assumescurrent operating parameters such as frequency and standard of maintenance aremaintained.If all the priority level 1 and 2 projects were built as described, based on the assumptionsnoted above, the <strong>District</strong> would need approximately nine additional full-time employees(+/- 25%) over the ten-year CIP period. Six of the additional employees would be addedfor the CCWD/Brentwood <strong>Water</strong> Treatment Plant. The distribution of these staff needsis shown on the bottom line of Table V-2.If all priority level 3 projects identified within the ten-year CIP schedule wereimplemented, the increase in annual operating labor expenditures by FY2018 would beapproximately $160,000. This equates to one additional employee by year ten of this CIP.Energy ImpactsThe portion of the projected increase in operating costs related to energy is presented inTables V-3. By the tenth year in the CIP, operating <strong>District</strong> facilities will require anincrease in net annual energy costs of approximately $285,000. Projects with significantenergy impacts include the CCWD/Brentwood <strong>Water</strong> Treatment Plant and the LosVaqueros Energy Recovery Project. Energy costs for the CCWD/Brentwood <strong>Water</strong>V-4
Treatment Plant will be fully paid for by the City of Brentwood. The Los VaquerosEnergy Recovery Project will reduce the <strong>District</strong>’s energy costs by $420,000 per year.There are two priority level 3 projects that would have impacts to the <strong>District</strong>’s energycosts, if implemented. The Solar Power project would lower energy costs byapproximately $110,000 per year by installing solar panels at several <strong>District</strong> facilities.The Membrane Filtration placeholder would increase the <strong>District</strong>’s energy costs byapproximately $6 million if new regulations or further degradation of Delta water qualityrequire the installation of membranes at the <strong>District</strong>’s water treatment plants.Table V-3 Net Increase in Energy Costs by Fiscal <strong>Year</strong>(in thousands of dollars, current dollars)PROJECT PROG FY09 FY10 FY11 FY12 FY13 FY14 FY15 FY16 FY17 FY18 TOTALCCWD/Brentwood<strong>Water</strong> Treatment PlantApplicant FundedNew Reservoir subprogramExp 340 357 375 394 414 435 457 480 504 529 4,285TWTWAlternative Intake Project UW 25 50 50 50 50 50 50 50 375Applicant FundedUWEBMUD Intertie UW 47 95 95 95 95 95 95 95 95 807LV Energy Recovery UW (210) (420) (420) (420) (420) (420) (2,310)Rock Slough Fish Screen UW 13 25 25 25 25 25 138Bollman WTP WTP 4 4 4 4 4 4 4 4 4 4 40R-B WTP WTP 2 2 2 2 2 2 2 2 2 2 20TOTAL PRIORITY 1&2 346 410 501 545 368 191 213 236 260 285 3,355Membrane Filtration WTP 3,220 6,440 6,440 6,440 22,540Solar Power Project ADM (55) (110) (110) (110) (110) (110) (110) (110) (825)TOTAL PRIORITY 3 (55) (110) (110) (110) 3,110 6,330 6,330 6,330 21,715TOTAL PRIORITY 3 (59) (123) (128) (132) 3,857 8,102 8,356 8,608 28,481V-5
Section VIFINANCIAL PLAN
Section VI: Financial PlanThe ten year CIP is also the vehicle for the <strong>District</strong>'s <strong>Ten</strong>-<strong>Year</strong> Financial Plan. The FinancialPlan estimates expenditures and revenue requirements to fund ten years of capital andoperating costs, while remaining in compliance with Board policies on rate increases, reservebalances and bond coverage ratios. The 2009-2018 Financial Plan concludes that CIP prioritylevel 1 and 2 projects can be funded and all operating costs and debt service obligations metwith annual revenue increases that meet the Board’s rate policy of keeping rate increases at orbelow assumed inflation.Key Planning AssumptionsThe CIP and <strong>Ten</strong>-<strong>Year</strong> Financial Plan serves as the <strong>District</strong>’s primary planning document forfunding capital projects, operating costs and debt service and, together with the adoptedbudget, provides the basis for the ten year rate projections.The following key planning assumptions were used in the preparation of the <strong>Ten</strong>-<strong>Year</strong>Financial Plan for the 2009-2018 CIPCost and Revenuesooooooo$5.4 million of FY07 positive financial results allocated to the Alternative IntakeProject (AIP).$18.0 million for increase in the cost of water from 2010 to 2018 as a result of theDelta Vision process and the Delta Habitat Conservation Plan (HCP) process. Thesecosts are revenue funded.The operating budgets are based on assumed 4% inflationary adjustments to theadopted FY08 budget.Debt service assumptions include the reduced cost in 2009 because of the Series Orefunding bonds and the elimination of long-term debt in all ten years associated withthe financing of the CCWD/Brentwood water treatment plant.Short-term debt funding of $60 million in commercial paper will be used for the AIPto manage cash flows during the construction which increases debt service in this CIP.The commercial paper will be retired by 2014 with the use of reserves.Revenue generated by the treated water service agreements with the Cities of Antiochand Brentwood, as well as the Golden State <strong>Water</strong> Company (Bay Point) are includedin the CIP, consistent with previous CIPs.Revenue anticipated from the long-term agreement with the City of Brentwood hasbeen incorporated in this analysis, accounting for a capacity rights purchase of sharedPage VI-1
facilities at the Randall-Bold <strong>Water</strong> Treatment Plant and full funding of constructionand operations of the new treatment plant by the City.Consistent with the recently completed 2008 rate review, the projected revenue increasesinclude an assumption that less than $30 million in outside funding for the AIP will bereceived due to uncertainty surrounding the extent and timing of State and Federal funding.The <strong>District</strong> is moving ahead with the AIP project, while continuing to aggressively pursueoutside funding. All other assumptions are consistent with the prior CIP and the 2008 ratereview, including assumed growth in new connections at slightly less than one-half of theAssociation of Bay Area Governments (ABAG) projections. Increases to Facility ReserveCharges (FRC) to recover 95% of the calculated amount of the FRC has been included,consistent with the 2008 rate review. Growth rates are consistent with the projections usedfor planning purposes.Account Growth and ConsumptionThe growth rates assumed in this CIP are based on reevaluation of long-term consumptiongrowth trends, with adjustments to growth assumptions made where appropriate. Growth inthe untreated water municipal customer service areas is projected to increase by an average of0.8% per year through 2011 and slightly higher for the remainder of the ten-year CIP period,for a cumulative total of 10.1%. This is lower than the growth rate assumed in the 2008 CIP.The slightly lower growth rates through 2011 reflect the implementation of Diablo <strong>Water</strong><strong>District</strong>’s (DWD) well project. DWD growth was estimated at 2% for 2012 through 2015 andthen drops back to 1%, consistent with the other municipal customers. Industrial andirrigation consumption is expected to remain at historical levels. Table VI-1a presents theassumed growth rates for the 2009 CIP, and Table VI-1b shows the 2008 CIP assumed growthrates.Consumption in the Treated <strong>Water</strong> Service Area is projected to increase by an average of0.7% per year through the ten-year CIP period. Specifically, the growth assumption per yearby major customer class is shown in Tables VI-1a and VI-1b. These assumptions areconsistent with the 2008 CIP.Table VI-1a Growth Assumption Per <strong>Year</strong> by Major Customer Class2009 CIPFY09 FY10 FY11 FY12 FY13 FY14 FY15 FY16 FY17 FY18Untreated <strong>Water</strong>- Municipal 0.8% 0.8% 0.8% 1.1% 1.1% 1.1% 1.1% 1.1% 1.1% 1.1%- Industrial 0.0% 0.0% 0.0% 0.0% 0.0% 0.0% 0.0% 0.0% 0.0% 0.0%- Irrigation 0.0% 0.0% 0.0% 0.0% 0.0% 0.0% 0.0% 0.0% 0.0% 0.0%Treated <strong>Water</strong>- Residential 0.7% 0.7% 0.7% 0.7% 0.7% 0.7% 0.7% 0.7% 0.7% 0.7%- Commercial 0.7% 0.7% 0.7% 0.7% 0.7% 0.7% 0.7% 0.7% 0.7% 0.7%- Industrial 0.7% 0.7% 0.7% 0.7% 0.7% 0.7% 0.7% 0.7% 0.7% 0.7%Page VI-2
Table VI-1b Growth Assumption Per <strong>Year</strong> by Major Customer Class2008 CIPFY08 FY09 FY10 FY11 FY12 FY13 FY14 FY15 FY16 FY17Untreated <strong>Water</strong>- Municipal 1.3% 1.3% 1.3% 1.3% 1.3% 1.3% 1.6% 1.6% 1.6% 1.7%- Industrial 0.0% 0.0% 0.0% 0.0% 0.0% 0.0% 0.0% 0.0% 0.0% 0.0%- Irrigation 0.0% 0.0% 0.0% 0.0% 0.0% 0.0% 0.0% 0.0% 0.0% 0.0%Treated <strong>Water</strong>- Residential 0.7% 0.7% 0.7% 0.7% 0.7% 0.7% 0.7% 0.7% 0.7% 0.7%- Commercial 0.7% 0.7% 0.7% 0.7% 0.7% 0.7% 0.7% 0.7% 0.7% 0.7%- Industrial 0.7% 0.7% 0.7% 0.7% 0.7% 0.7% 0.7% 0.7% 0.7% 0.7%Although consumption growth assumptions are similar to the prior CIP, the base yearconsumption estimate has been decreased relative to the 2008 CIP projection. This is basedon reevaluation of actual consumption levels in the untreated water service area, includingFY07 results. Total annual consumption levels assumed in the current and the 2008 CIP areshown in Table VI-2. The decrease in the base year estimate and the assumed growth ratestranslate to water consumption that is slightly lower than the prior CIP over the ten-yearplanning period.Table VI-2 – Assumed Annual Consumption (000’s Acre-feet) 1)CIP FY08 FY09 FY10 FY11 FY12 FY13 FY14 FY15 FY16 FY17 FY182009 NA2)108.5 109.1 109.7 110.4 111.1 111.8 112.5 113.1 113.8 114.52008 108.8 109.6 110.4 111.2 112.1 113.0 113.9 114.9 115.6 116.3 NADifference -1.1 -1.3 -1.5 -1.7 -1.9 -2.1 -2.4 -2.5 -2.51) Does not include City of Brentwood consumption, estimated at 6,241 acre feet in 20082) Current estimate for 2008 is 107,900 acre feetInflationInflation is projected at 4% per year for operating and maintenance expenditures and capitalimprovement projects consistent with the long-term historical average. CVP water costs areestimated to increase by approximately 10.5% annually beginning in 2010 given historicalincreases and continued cost volatility, approximately 1.5 times higher than in the previousCIP.Page VI-3
Debt/Bond FinancingTo minimize rate impacts and optimize cash flows during construction of projects, the <strong>District</strong>uses short term commercial paper when appropriate. This CIP’s rate analysis assumes abalance of approximately $20.1 million in commercial paper at the end of the ten yearplanning period primarily to fund the Untreated <strong>Water</strong> Pipeline that will augment canalcapacity for the delivery of untreated water. Because this project is related to growth, theassociated debt service will be paid from MPP-SRIP restricted reserve funds. Thecommercial paper used to fund this project will be converted to long-term debt uponcompletion of the project. For purposes of this Financial Plan, it is assumed that the newtreatment plant to serve the City of Brentwood will be funded with short-term debt. Theconstruction of the plant will be financed with commercial paper, which will be paid in full bybonds issued by the City of Brentwood upon completion of construction. It is assumed thatthe commercial paper will be issued at a 3.5% interest rate. All debt service for this facilitywill be paid for by the City of Brentwood. In addition, this CIP assumes the use of $60million in commercial paper to meet cash flow requirements related to the acceleratedconstruction schedule of the AIP. This commercial paper will be issued through thecompletion of the project in 2011, and paid off over the following three years with <strong>District</strong>reserves. If outside funding were to become available, it could be used to pay off the debtearlier than planned.Debt RatingsThe <strong>District</strong>’s long-term debt rating is Aa3 from Moody’s and AA from Standard and Poor's.Both ratings were reaffirmed during FY07. The <strong>District</strong>’s commercial paper ratings werereaffirmed during FY07 at the highest quality levels of P-1 from Moody's and A-1 fromStandard & Poor's. This CIP assumes that the current ratings will be maintained.Debt Service CoverageThe current Los Vaqueros and Randall-Bold bond covenants as well as Board policy requirethe <strong>District</strong> to maintain a debt service coverage ratio of 1.25 on water revenue bonds andother parity debt. For purposes of this Financial Plan, a minimum coverage ratio of 1.25 isassumed for the ten-year period, although actual projected coverage varies from 2.0 to 1.43.The average coverage ratio during the ten-year planning period is 1.6. The rate projectionsincluded in this Financial Plan are driven by planned revenue funded capital expenditures notby the debt service coverage requirement, although the coverage requirement is metthroughout the ten-year CIP period.Reserve FundsThe <strong>District</strong>'s reserve funds include a combination of unrestricted, legally restricted andBoard restricted. Those reserves that are restricted by contractual or legal requirements areconsidered to be legally restricted; those that are Board restricted require previous action bythe Board to limit their usage to specific purposes.The <strong>District</strong> has a Board policy setting the minimum reserve balance at the total of sixmonths’ debt service and operating expense. The six months’ operating expense requirementPage VI-4
will be met by a combination of unrestricted reserves and the Board restricted RateStabilization Fund. The six months of debt service requirement will be met by the legallyrestricted Bond Reserve Funds. A breakdown of the <strong>District</strong>’s reserves as of December 31,2007, including those reserves used to smooth rate increases, is provided on Table VI-3.Earnings from interest are assigned to the reserve balances that earn the interest, bothrestricted and unrestricted, and are used for the purposes of those reserves.Table VI-3 Reserve Fund Balances - December 31, 2007($000) Untreated Treated Other TOTALLegally Restricted FundsLos Vaqueros Bond Reserves 38,110 38,110Randall-Bold Bond Reserves 3,789 3,789State Revolving Loan Reserves 718 718Commercial Paper 4,065 4,065Canal Replacement 1,642 1,642USBR Reserve 1,113 - - 1,113Subtotal 1,113 - 48,324 49,437Board Restricted Reserves<strong>Capital</strong> <strong>Improvement</strong> Fund 1) 26,027 26,157 52,184Rate Stabilization Fund 1) 38,655 18,240 56,895Sacramento/EBMUD Mitigation Reserve 2,495 2,495Vehicle Replacement Fund 2,135 2,135Self Insurance Reserve 1,321 1,321Workers' Compensation Deductible Reserve 1,291 1,291Clean <strong>Water</strong> Act Funds 1) 468 468MPP/FWSS Reserve 2) 34,796 34,796Drought Relief Fund 3,500 3,500Retiree Health Benefits Reserve Fund 7,235 7,235Las Vaqueros Commitment Reserve 3,526 - - 3,526Subtotal 105,499 46,185 14,161 165,846Unrestricted FundsUnrestricted Reserves 1) 13,247 28,731 - 41,977Subtotal 13,247 28,731 - 41,977TOTAL 119,859 74,916 62,485 257,2601) Funds used to smooth rate increases over the next ten years.2) Portion of these reserves used to pay qualifying debt service attributable to the MPPPage VI-5
Projected RevenuesThe <strong>District</strong> generates revenue from several sources, including water sales, Facility ReserveCharges, interest earnings, property taxes, grants and miscellaneous other sources. Theprimary sources of revenue are described below.<strong>Water</strong> Sales<strong>Water</strong> sales generate approximately 75% of the <strong>District</strong>'s total revenue. Treated water sales,including wholesale treated water and the untreated water component of the treated waterrate, will provide approximately 63% of the total water sales revenue anticipated during theten-year period of the <strong>Capital</strong> <strong>Improvement</strong> <strong>Program</strong>, with the remaining 37% generated bythe sale of untreated water to untreated water only customers.Projected Revenue IncreasesTable VI-4 compares the projected untreated water revenue increases necessary to funduntreated water only customers’ share of all priority level 1 and 2 projects in the 2009 CIP, aswell as projected operating costs and debt service. Virtually all of the revenue increases willresult from increased untreated water rates and assumed growth. As with the prior CIP, noannual increase exceeds the assumed rate of annual inflation in the ten-year planning period.The revenue increase projections shown in Table VI-4 for this CIP are higher than the 2008CIP. These increases are primarily the result of anticipated higher water costs as a result ofthe Delta Vision and HCP processes. The increase in water costs total approximately $18million over the final nine years of the ten-year financial plan and also impact revenueprojections for treated water.Table VI-5 compares the projected treated water revenue increases necessary to fund allpriority level 1 and 2 projects in the 2009 CIP, as well as treated water operating costs, debtservice and treated water’s share of untreated water costs. The revenue increase projectionsare higher than the 2008 CIP. These increases are primarily the result of anticipated higherwater costs to implement the Delta Vision and HCP processes as previously noted. Theseprojected increases provide funding for new or increased treated water projects as well astreated water customers’ share of the source water quality improvement projects. An increaseof 3.5% is projected for the newly added year of 2018.Table VI-4 Projected Untreated <strong>Water</strong> Revenue Increases - Priority Level 1 and 2 ProjectsComparison of 2009 and 2008 CIPs2009 2010 2011 2012 2013 2014 2015 2016 2017 20182009 CIP 3.0% 3.25% 3.5% 3.5% 3.5% 3.5% 3.75% 3.75% 3.75% 3.75%2008 CIP 3.0% 3.0% 3.0% 3.0% 3.0% 3.0% 3.0% 3.0% 3.0% NAPage VI-6
Table VI-5 Projected Treated <strong>Water</strong> Revenue Increases - Priority Level 1 and 2 ProjectsComparison of 2009 and 2008 CIPs2009 2010 2011 2012 2013 2014 2015 2016 2017 20182009 CIP 3.0% 3.15% 3.3% 3.3% 3.3% 3.3% 3.5% 3.5% 3.5% 3.5%2008 CIP 3.0% 3.0% 3.0% 3.0% 3.0% 3.0% 3.0% 3.0% 3.0% N/AFacility Reserve ChargesThe Facility Reserve Charge (FRC) is a one-time charge for system capacity paid prior to acustomer connecting to the <strong>District</strong>'s water system. All new connections pay the untreatedwater FRC, and new connections in the Treated <strong>Water</strong> Service Area (TWSA) also pay thetreated water FRC. Both the untreated and treated water FRCs include a “reimbursement”component and a “future facilities” component. The reimbursement component is based onthe value and remaining capacity of existing facilities. This component reimburses existingcustomers for the portion of the costs of "oversizing" facilities to accommodate future growth.The future facilities component recognizes the cost of future water supply and facilities thatare necessary to serve new connections. As FRC revenue is received the reimbursementcomponent is used to fund costs in the year received and the future facilities component isapportioned to the appropriate reserve accounts for application to future and existing capitalprojects, consistent with the FRC methodology. FRCs have been increased to 95% of thecalculated value with a two-year phase in period to reduce the amount of the current subsidy.The estimated FRC reserve balances at the end of each fiscal year, summarized by majorcomponent, are identified in Table VI-6. The reimbursement component of the FRCsaccumulate in the unrestricted reserve accounts. It is assumed that the reimbursementcomponent of the untreated and treated water facility reserve charges will be expended in theyear received, so no balances are included on the chart below. The negative balancesidentified in Table VI-6 represent those years where expenditures exceed accumulatedrevenues. FRC revenues will continue to accrue over a longer period than the ten-year CIPplanning period. The beginning balance of zero in FY09 in the Untreated <strong>Water</strong> FutureSupply Component is the result of the accelerated construction of the AIP. The balancesgrow again in FY10 until a large water right purchase projected in FY16. The balances in theUntreated <strong>Water</strong> Future Capacity component reflect the difference between collected amountsand debt service for growth’s share of the Multi-Purpose Pipeline Project. Current projectionsshow sufficient fund balances to pay for growth’s share of Multi-Purpose Pipeline debtservice through 2018.Page VI-7
Table VI-6 Projected FRC Reserve Balances (cumulative)($ in millions) FY09 FY10 FY11 FY12 FY13 FY14 FY15 FY16 FY17 FY18Untreated <strong>Water</strong>- Future Supply Component 1) - 2.3 4.6 6.9 8.3 9.5 11.9 3.6 5.9 8.3- Future Capacity Component 2) 26.2 27.3 28.4 29.5 30.6 31.7 32.8 33.9 35.0 36.1Treated <strong>Water</strong>- Future Facilities Component (5.7) (4.1) (2.6) (1.0) 0.6 2.0 3.6 5.2 6.8 8.31) Funds used for Alternative Intake Studies and Long-term Future <strong>Water</strong> Purchases2) Funds used for qualified amount of Multi-Purpose Pipeline Project debtThe Future Facilities Component of the Treated <strong>Water</strong> FRC reflects how continuedcollections over time reduce the negative balance resulting from prior years’ expenditures forgrowth exceeding FRC collections. Current projects identified to serve “future” facilityneeds, or a percentage of current projects applicable to “future” needs, should be fully FRCfunded by FY13. Until that time, the FRC balances will be negative.In recent years, the conservative projections used by the <strong>District</strong> have been, on average, morereflective of actual growth than the ABAG projections. Table VI-7 shows the last five yearsof new connections as compared with the assumption used in this analysis. The assumptionsare consistent with the 2008 rate analysis.Table VI-7 New ConnectionsFive <strong>Year</strong> Historical Results5 <strong>Year</strong>AnnualProjectionAnnual New Connections 2003 2004 2005 2006 2007 Average 2009 CIPRaw <strong>Water</strong> 1,463 1,703 1,502 2,242 1,562 1,694 2,000Treated <strong>Water</strong> 279 226 270 239 394 282 290Revenue ProjectionsTable VI-8 below shows projected revenues for the period 2009 through 2018. Theseprojections are based on the required funding of all priority level 1 and 2 projects; funding fordiscretionary projects (priority level 3) is not included. Rate revenues are adjusted forprojected growth and estimated revenue increases. FRC revenues are computed bymultiplying the FRC rate by the projected growth in connections. FRCs were adjusted to95% of the calculated amount by the Board 2007. This increase is reflected in the 2009 CIP.It has been assumed that the FRC components subject to inflation will be increased by theEngineering News Record (ENR) index on an annual basis consistent with Board direction.Other revenues and property taxes are adjusted for inflation. The Other Revenues category inthe 2009 CIP includes a one time payment from the City of Brentwood for the purchase ofinfrastructure and lands at the new treatment plant site. Property tax revenues were adjustedupward to reflect an end to funds being diverted to the Educational Revenue AugmentationFund (ERAF) in 2005 and 2006. Interest income is computed on fund balances (includingdebt reserve funds whose interest is used to pay related debt service) at 5%, consistent withPage VI-8
the long-term historical average. Interest income declines in the later years as reservebalances are drawn down.This CIP breaks out the estimated revenue from the City of Brentwood related to the longtermtreated water service agreements. The revenues from the City of Brentwood include allestimated costs related to treated water delivered from the Randall-Bold treatment plant,treated water delivered from the new CCWD/Brentwood treatment plant currently inconstruction, and revenues received to make the debt service payments for the new plantthrough the construction phase of the project. The first year of the analysis assumesBrentwood will use on average all of the six million gallons per day (MGD) capacity itpurchased from the Randall-Bold treatment plant, and when appropriate will use additionalrented capacity from the plant. The remaining nine years assume a fully operational newtreatment plant in addition to the six MGD purchased at the Randall-Bold Treatment Plant.Revenues from Brentwood over the ten-year planning period total $71.7 million. Finally,Diablo <strong>Water</strong> <strong>District</strong> (DWD) revenue includes DWD's contractual share of debt service, andDWD’s share of projected inflated operating expenses for the Randall-Bold treatment plant.Table VI-8 shows the revenue projected in this CIP, and Table VI-9 shows the revenueprojected in the 2008 CIP. Changes in the revenue estimates in the 2009 CIP include higherestimates in cumulative rate revenues related to continued growth in 2018 and recovery ofadditional operating costs related to higher cost of water as a result of the Delta Vision andHCP processes. The Land Levy taxes will be collected through 2010, when the USBR willhave been fully paid for the <strong>Contra</strong> <strong>Costa</strong> Canal System. Total collections in the CIP reflecttwo years of Land Levy taxes, while the prior CIP had three years.Table VI-8 2009CIP-Projected Revenues(in millions of dollars)Source 2009 2010 2011 2012 2013 2014 2015 2016 2017 2018 TotalRate Revenues 101.4 103.9 107.9 112.3 117.3 123.1 129.1 136.6 145.0 154.6 1,231.2Rate Increases 2.3 3.1 3.2 3.3 3.4 3.5 3.6 3.8 3.7 4.1 34.0FRC 13.6 13.7 13.8 14.0 14.1 14.2 14.4 14.5 14.6 14.8 141.7City of Brentwood 3.1 5.2 7.0 7.3 7.5 7.8 8.0 8.3 8.6 8.9 71.7Other Revenues 1.0 2.9 1.0 1.0 1.0 1.0 1.0 1.0 1.0 1.0 11.9Interest Income 8.4 8.7 7.4 7.1 6.1 5.2 4.8 4.8 4.8 4.8 62.1Property Taxes 2.3 2.4 2.4 2.4 2.4 2.5 2.5 2.6 2.6 2.6 24.7Land Levy Taxes 0.7 0.7 - - - - - - - - 1.4DWD Revenue 2.4 2.4 2.4 2.4 2.5 2.5 2.6 2.6 2.6 2.6 25.0Total 135.2 143.0 145.1 149.8 154.3 159.8 166.0 174.2 182.9 193.4 1,603.7Page VI-9
Table VI-9 2008 CIP-Projected Revenues(in millions of dollars)Source 2008 2009 2010 2011 2012 2013 2014 2015 2016 2017 TotalRate Revenues 97.9 101.5 105.2 109.0 113.1 116.9 120.8 124.7 128.3 133.0 1,150.4Rate Increases 2.9 3.1 3.2 3.3 3.4 3.5 3.6 3.7 3.8 3.9 34.4FRC 12.7 12.8 12.9 13.1 13.2 13.3 13.5 13.6 13.7 13.9 132.7City of Brentwood 3.1 5.2 7.0 7.3 7.5 7.8 8.0 8.3 8.6 8.9 71.7Other Revenues 0.9 0.9 1.0 1.0 1.0 1.1 1.1 1.2 1.2 1.2 10.6Interest Income 7.2 7.4 7.0 5.1 4.6 4.7 4.7 4.7 4.6 4.5 54.5Property Taxes 1.7 1.8 1.8 1.9 1.9 1.9 1.9 2.0 2.0 2.0 18.9Land Levy Taxes 0.7 0.7 0.7 - - - - - - - 2.1DWD Revenue 2.3 2.4 2.4 2.4 2.4 2.5 2.5 2.6 2.6 2.6 24.7Total 129.4 135.8 141.2 143.1 147.1 151.7 156.1 160.8 164.8 170.0 1,500.0Projected ExpendituresThe Financial Plan considers estimated expenditures for <strong>District</strong>-wide operations andmaintenance activities as well as completion of the priority level 1 and 2 capital projectsincluded in the CIP. Estimates are presented both in current and inflated dollars at 4% for theten-year planning period.Operations and Maintenance ExpendituresEstimated 2009 operating and maintenance (O&M) costs are lower than the previous CIP dueprimarily to lower than anticipated cost of CVP water, based on a change in budgeting forCVP power costs. Beginning in 2010, it is anticipated that the cost of water will increase as aresult of the Delta Vision process. <strong>Water</strong> cost increases of approximately $18 million overthe final nine years have been assumed in the Financial Plan to use towards these increasedcosts. The O&M impacts of planned improvements are detailed in Section V: OperatingImpacts of the <strong>Capital</strong> <strong>Improvement</strong> <strong>Program</strong> in Table V-1 (current dollars) and Table V-2(inflated dollars). These are also included in the projections below. The new Brentwoodlong-term agreement includes the operating cost of the new treatment plant, fully paid by theCity, plus a component for <strong>District</strong> overhead. These operating cost estimates includemaintenance costs for the Alternative Intake project, assumed to be operational by FY10.Table VI-10 summarizes projected total <strong>District</strong> O&M expenses in current dollars comparedto the estimates in the 2008 CIP. Table VI-11 summarizes O&M expenses in inflated dollarsat 4% annually for the ten-year planning period.Page VI-10
Table VI-10 Total <strong>District</strong> Operating & Maintenance Expenses(in millions of dollars, current dollars)FY09 FY10 FY11 FY12 FY13 FY14 FY15 FY16 FY17 FY182009 CIP 66.9 68.9 70.5 72.0 72.5 72.9 73.4 73.8 74.0 74.82008 CIP 68.0 69.6 70.9 72.0 72.4 72.7 72.8 72.7 72.3 N/ATable VI-11 Total Projected <strong>District</strong> Operating & Maintenance Expenses(in millions of dollars, inflated dollars)FY09 FY10 FY11 FY12 FY13 FY14 FY15 FY16 FY17 FY182009 CIP 66.9 71.0 75.1 79.2 83.3 87.8 93.0 98.4 104.2 110.22008 CIP 68.0 71.8 75.4 79.1 83.2 87.6 92.2 96.9 101.8 N/A<strong>Capital</strong> ProjectsThe Financial Plan assumes that all priority level 1 & 2 projects are funded for a ten-year totalof approximately $362.9 million in current dollars and $429.7 million in inflated dollars.Priority level 3 projects are assumed to be unfunded. Only the capital costs of priority level 1and 2 projects have been included for the purpose of developing projected adjustments.<strong>Capital</strong> Funding SourcesThe <strong>District</strong>'s primary revenue source is the sale of untreated and treated water. Raterevenues, along with other <strong>District</strong> revenues and reserves, cover the costs of O&M expenses,debt service and equity funded (pay-as-you-go) capital expenditures. Commercial paper isavailable to meet short-term cash flow requirements if needed and is generally used duringthe construction phase of capital projects. This CIP projects a balance in commercial paper ofapproximately $21.0 million at the end of the ten-year planning period, primarily to fund theUntreated <strong>Water</strong> Pipeline during construction. Long-term debt will be issued when theproject is complete with the debt service paid from SRIP-MPP restricted reserves.Commercial paper is also used to fund construction of the CCWD/Brentwood <strong>Water</strong>Treatment Plant and through 2011 to fund the accelerated construction schedule of the AIP.The commercial paper for the water treatment plant will be retired with bonds issued by theCity of Brentwood. The commercial paper for the AIP will be retired from CCWD reservesover three years, 2012 to 2014.Another significant revenue source comes from funding by others as shown in Table VI-14a.Projects funded by other agencies or applicants total $166.7 million, higher than in the priorCIP by $21.7 million. The majority of the change in funded by other agencies is theanticipated funding for the Canal Replacement Project which is approximately $13.3 millionhigher with $10.0 million funded from the <strong>Water</strong> Resources Development Act (WRDA). TheCity of Brentwood funding for the new treatment plant is not reflected Table VI-14a under the“funded by others category” as these costs are funded by <strong>District</strong> short-term debt initially.The projected debt service for the <strong>District</strong> during the ten-year planning period includes twoPage VI-11
major changes from the prior CIP projections. A significant reduction in the treated waterdebt service is the result of the City of Brentwood’s decision to provide the long-termfinancing for the new treatment plant. A significant increase in the untreated water debtservice is the result of the decision to finance the construction of the AIP with commercialpaper and retire that debt by 2014 with reserves. Total revenue funded projects in this CIPdecreased by $52.9 million (inflated dollars) driven primarily by the decision to fund theconstruction of the AIP with commercial paper.The Board restricted Rate Stabilization Fund, <strong>Capital</strong> <strong>Improvement</strong> Fund and UnrestrictedReserves will also be used during this ten-year period to partially fund the proposed prioritylevel 1 and 2 capital expenditures as well as debt service for previously completed debtfundedcapital projects. The Rate Stabilization fund balance was established in accordancewith the Master Bond Resolution adopted by the Board in October 1987. The purpose of thefund is to assist in smoothing rates to pay Los Vaqueros Project debt service and to assure thatminimum debt service coverage ratios required by the <strong>District</strong>’s bond covenants are met.Funds deposited into this reserve were treated as operating costs in the year of deposit andwill be treated as revenue in years of use for the purpose of computing the <strong>District</strong>’s debtservice coverage ratio. Initial use of this reserve is projected to occur in 2011 with the entirereserve used by the end of the ten-year planning period, consistent with the <strong>District</strong>’s reservepolicy.Other reserve balances are used to smooth the <strong>District</strong>'s cash flow needs from year to year.This allows an orderly progression of single-digit rate increases at less than the rate ofassumed inflation. However, as minimum reserve balances and debt coverage levels areapproached, it will be necessary to plan for water rates that, when combined with otherrevenue sources, will fully cover annual costs. Reserve balance projections are provided onpage VI-18.This financial plan reflects a conservative view of required revenues, it assumes all of thecapital expenditures in the FY08 budget occur. This assumption sets the beginning reservebalances consistent with the recently completed rate review, and adds a year (FY18) ofadditional capital expenditures and other costs to this analysis.<strong>Capital</strong> Project Impacts on Revenue RequirementsPriority Level 1 and 2 Projects (Non-Debt Funded)The following two tables show how the priority level 1 and 2 Projects impact equity fundedcapital expenditures by program. Equity funded projects are funded by water rates, FRCrevenues, and reserves. Tables VI-12 and VI-13 include all projects designated as prioritylevel 1 and 2 that are not debt, developer or grant funded, such as funds received by outsideagencies. Tables VI-12a and VI-12b show program estimates in current dollars for the 2009CIP and 2008 CIP, respectively, while Tables VI-13a and VI-13b display the estimates forboth CIPs in inflated dollars. During the common years of the 2008 and 2009 CIPs (FY09through FY17), the equity funded portion is $44.2 million lower in the 2009 CIP in currentdollars. This is primarily the result of the decision to use commercial paper to fund $58.5Page VI-12
million dollar of the AIP cash flows scheduled for FY10 and FY11 in the 2008 CIP. Theprojects in both Untreated <strong>Water</strong> and Treated <strong>Water</strong> were reevaluated for the impact ofinflation on current dollar estimates.Table VI-12a Equity Funded <strong>Capital</strong> Expenditures by <strong>Program</strong> [1]- Priority Level 1 and 2 Projects2009 CIP (in millions of dollars, current dollars)<strong>Program</strong> FY09 FY10 FY11 FY12 FY13 FY14 FY15 FY16 FY17 FY18 TotalAdministrative Support Facilities 0.7 0.4 0.6 0.4 0.4 0.4 0.4 0.4 0.4 0.4 4.5Delta Projects 0.0 0.0 0.0 0.0 0.0 0.0 0.0 0.0 0.0 0.0 0.0Equipment & <strong>Capital</strong> Purchases 2.0 1.9 1.7 1.1 1.0 2.0 1.0 1.7 1.2 0.9 14.5Expansion of Services 0.0 0.0 0.0 0.0 0.0 0.0 0.0 0.0 0.0 0.0 0.0Future <strong>Water</strong> Supplies 0.2 0.2 0.2 0.2 0.3 0.2 8.2 0.2 0.2 0.4 10.3Los Vaqueros 0.5 0.5 0.5 0.5 0.5 0.5 0.5 0.5 0.5 0.5 5.0Treated <strong>Water</strong> Distribution & Storage 6.9 6.4 4.3 5.1 4.0 4.8 3.8 4.8 4.1 6.3 50.5Untreated <strong>Water</strong> Supply & Transport 1.5 4.4 6.6 4.1 3.1 2.5 4.4 2.1 2.0 2.1 32.8<strong>Water</strong> Demand Reduction 0.6 0.6 0.6 0.6 0.6 0.6 0.6 0.6 0.6 0.6 6.0<strong>Water</strong> Treatment Facilities 0.9 2.9 2.9 0.8 1.2 1.2 1.4 1.4 0.9 1.4 15.0Total 13.3 17.3 17.4 12.8 11.1 12.2 20.3 11.7 9.9 12.6 138.6(1] Does not include projects funded by applicants, debt or other agenciesTable VI-12b Equity Funded <strong>Capital</strong> Expenditures by <strong>Program</strong> [1]- Priority Level 1 and 2 Projects2008 CIP (in millions of dollars, current dollars)<strong>Program</strong> FY08 FY09 FY10 FY11 FY12 FY13 FY14 FY15 FY16 FY17 TotalAdministrative Support Facilities 1.0 0.4 0.4 0.6 0.4 0.4 0.4 0.4 0.4 0.4 4.8Delta Projects 3.5 19.1 38.3 0.0 0.0 0.0 0.0 0.0 0.0 0.0 60.9Equipment & <strong>Capital</strong> Purchases 1.8 2.6 1.4 2.3 1.5 0.9 1.1 1.0 1.1 1.2 14.9Expansion of Services 0.2 0.0 0.0 0.0 0.0 0.0 0.0 0.0 0.0 0.0 0.2Future <strong>Water</strong> Supplies 0.4 0.2 0.2 0.2 0.2 0.3 0.2 1.9 0.2 0.2 4.0Los Vaqueros 0.5 0.5 0.5 0.5 0.5 0.5 0.5 0.5 0.5 0.5 5.0Treated <strong>Water</strong> Distribution & Storage 9.9 4.9 4.5 3.7 4.5 3.8 4.5 3.7 5.0 6.7 51.2Untreated <strong>Water</strong> Supply & Transport 4.4 2.6 2.1 3.4 2.8 1.8 2.3 3.8 1.9 1.9 27.0<strong>Water</strong> Demand Reduction 0.7 0.5 0.5 0.5 0.5 0.5 0.5 0.5 0.5 0.5 5.2<strong>Water</strong> Treatment Facilities 4.6 0.8 2.4 2.7 0.9 1.3 1.3 1.4 1.4 0.9 17.7Total 27.0 31.6 50.3 13.9 11.3 9.5 10.8 13.2 11.0 12.3 190.9(1] Does not include projects funded by applicants, debt or other agenciesPage VI-13
Table VI-13a Equity Funded <strong>Capital</strong> Expenditures by <strong>Program</strong> [1]-Priority Level 1 and 2 Projects2009 CIP (in millions of dollars, inflated dollars)<strong>Program</strong> FY09 FY10 FY11 FY12 FY13 FY14 FY15 FY16 FY17 FY18 TotalAdministrative Support Facilities 0.7 0.4 0.7 0.5 0.5 0.5 0.5 0.6 0.6 0.6 5.6Delta Projects 0.0 0.0 0.0 0.0 0.0 0.0 0.0 0.0 0.0 0.0 0.0Equipment & <strong>Capital</strong> Purchases 2.1 2.1 1.9 1.3 1.2 2.6 1.4 2.4 1.7 1.3 18.0Expansion of Services 0.0 0.0 0.0 0.0 0.0 0.0 0.0 0.0 0.0 0.0 0.0Future <strong>Water</strong> Supplies 0.2 0.2 0.2 0.2 0.4 0.2 10.9 0.2 0.2 0.6 13.3Los Vaqueros 0.5 0.6 0.6 0.6 0.6 0.7 0.7 0.7 0.7 0.8 6.5Treated <strong>Water</strong> Distribution &Storage 1.6 4.8 7.1 4.6 3.6 3.2 5.9 2.9 2.9 3.1 39.7Untreated <strong>Water</strong> Supply & Transport 7.2 7.0 4.9 6.1 5.0 6.1 5.1 6.6 5.8 9.4 63.2<strong>Water</strong> Demand Reduction 0.6 0.7 0.7 0.7 0.7 0.8 0.8 0.8 0.9 0.9 7.6<strong>Water</strong> Treatment Facilities 1.0 3.2 3.3 1.0 1.5 1.6 1.9 2.0 1.3 2.2 19.0Total 13.9 19.0 19.4 15.0 13.5 15.7 27.2 16.2 14.1 18.9 172.9[1] Does not include projects funded by applicants, debt or other agenciesTable VI-13b Equity Funded <strong>Capital</strong> Expenditures by <strong>Program</strong> [1]- Priority Level 1 and 2 Projects2008 CIP (in millions of dollars, inflated dollars)<strong>Program</strong> FY08 FY09 FY10 FY11 FY12 FY13 FY14 FY15 FY16 FY17 TotalAdministrative Support Facilities 1.0 0.4 0.4 0.7 0.5 0.5 0.5 0.5 0.5 0.5 5.5Delta Projects 3.5 19.1 38.3 0.0 0.0 0.0 0.0 0.0 0.0 0.0 60.9Equipment & <strong>Capital</strong> Purchases 1.8 2.8 1.6 2.7 1.8 1.2 1.4 1.4 1.6 1.7 18.0Expansion of Services 0.2 0.0 0.0 0.0 0.0 0.0 0.0 0.0 0.0 0.0 0.2Future <strong>Water</strong> Supplies 0.4 0.2 0.2 0.2 0.2 0.3 0.2 2.6 0.2 0.2 4.7Los Vaqueros 0.5 0.5 0.5 0.6 0.6 0.6 0.6 0.7 0.7 0.7 6.0Treated <strong>Water</strong> Distribution &Storage 9.9 5.3 5.1 4.4 5.5 4.8 6.0 5.0 7.2 9.9 63.1Untreated <strong>Water</strong> Supply & Transport 4.4 2.8 2.3 3.8 3.2 2.3 3.0 5.2 2.7 2.8 32.5<strong>Water</strong> Demand Reduction 0.7 0.6 0.6 0.6 0.6 0.7 0.7 0.7 0.7 0.8 6.7<strong>Water</strong> Treatment Facilities 4.6 0.8 2.7 3.2 1.0 1.7 1.6 2.0 2.0 1.4 21.0Total 27.0 32.5 51.7 16.2 13.4 12.1 14.0 18.1 15.6 18.0 218.6[1] Does not include projects funded by applicants, debt or other agenciesPage VI-14
Revenue and Debt Funded, Priority Level 1 and 2 ProjectsComparison of the 2009 CIP (Table VI-14a) and 2008 CIP (Table VI-14b) identifying theprojected capital expenditures by their untreated and treated water funding sources shows theoverall impacts of the adjustments discussed in this document. Specifically, the changes areas follows:Untreated <strong>Water</strong> Revenue Funded Projects - The 2009 CIP reflects a decrease in untreatedwater revenue funded projects of $41.3 million (inflated) dollars in the first nine years, theyears in common with the prior CIP and increased an additional $5.5 million (inflated) dollarsfor the additional year in this analysis, 2018. The decrease of $35.8 million over the ten-yearperiod is almost entirely the result of the decision to fund $58.1 million of the accelerated AIPconstruction schedule with commercial paper. Increases in other projects offset the decreasefrom the portion of AIP that is debt funded: Untreated <strong>Water</strong> Rights Purchases - $8.3 million,Los Vaqueros Energy - $2.6 million, Untreated <strong>Water</strong> Meter Upgrades - $2.2 million, CanalReplacement Project - $1.9 millionTreated <strong>Water</strong> Revenue Funded Projects - The 2009 CIP shows an increase of $3.4 million(inflated) over the common years of the two CIPs and the addition of $12.3 million in thefinal year of this 2009 CIP. Various treated water programs have been reprioritized to makeup the change in the common years. The addition of $12.8 million in 2018 is the result ofcontinuing treated water programs.Page VI-15
Table VI-14a Projected <strong>Capital</strong> and Debt Service Expenditures- Priority Level 1 and 2 Projects(in millions of dollars, inflated dollars)2009 CIP 2009 2010 2011 2012 2013 2014 2015 2016 2017 2018 TotalUntreated <strong>Water</strong>(a)Revenue-Funded Projects 3.9 7.2 9.6 6.8 6.0 6.0 19.0 5.7 5.5 6.1 75.8Debt-Service (b) 0.8 1.8 2.1 21.4 20.7 20.0 0.0 0.1 0.4 0.7 68.0Debt-Service (c) 37.9 39.6 38.6 38.7 38.7 38.7 38.7 38.9 38.8 38.8 387.4Total Untreated 42.6 48.6 50.3 66.9 65.4 64.7 57.7 44.7 44.7 45.6 531.2Treated <strong>Water</strong> `Revenue-Funded Projects 10.0 11.8 9.8 8.2 7.5 9.7 8.2 10.5 8.6 12.8 97.1Debt-Service (d) 1.2 1.3 0.0 0.0 0.0 0.0 0.0 0.0 0.0 0.0 2.5Debt-Service (c) 5.1 5.1 5.1 5.1 5.1 5.1 5.1 5.1 5.1 5.1 51.0Total Treated 16.3 18.2 14.9 13.3 12.6 14.8 13.3 15.6 13.7 17.9 150.6Funded by OthersDelta Projects (e) 9.5 31.9 8.6 4.1 3.4 57.5Funded by Other Agencies 1.8 1.2 2.9 8.3 12.5 15.2 25.7 15.0 1.2 0.7 84.5Funded by Applicants 6.1 1.8 1.8 1.9 2.0 2.1 2.1 2.2 2.3 2.4 24.7Total Funded by Others 17.4 34.9 13.3 14.3 17.9 17.3 27.8 17.2 3.5 3.1 166.7Total <strong>District</strong> 76.3 101.7 78.5 94.5 95.9 96.8 98.8 77.5 61.9 66.6 848.5(a) Approximately 38% of Untreated <strong>Water</strong> Expenditures are paid by Treated <strong>Water</strong> Rates (as the Treated<strong>Water</strong> Service Area is also a Untreated <strong>Water</strong> Customer)(b) Debt service – Commercial Paper and future Long Term Debt - Seismic and Reliability <strong>Improvement</strong>Projects, Alternative Intake Project(c) Existing debt service (Los Vaqueros, Randall-Bold, Canal, Bollman, and Issued SRIP long term debt)(d) Debt service – Commercial Paper – CCWD/Brentwood WTP (Fully paid by the City of Brentwood)(e) Funded by CALFED agenciesPage VI-16
Table VI-14b Projected <strong>Capital</strong> and Debt Service Expenditures- Priority Level 1 and 2 Projects(in millions of dollars, inflated dollars)2008 CIP 2008 2009 2010 2011 2012 2013 2014 2015 2016 2017 TotalUntreated <strong>Water</strong>(a)Revenue-Funded Projects 10.5 24.3 42.6 6.5 5.4 4.5 5.1 9.9 5.0 5.3 119.1Debt-Service (b) 0.0 0.0 0.0 0.0 0.0 0.0 0.0 0.1 0.4 0.7 1.2Debt-Service (c) 39.7 39.7 39.6 38.7 38.7 38.7 38.7 38.7 38.9 38.9 390.3Total Untreated 50.2 64.0 82.2 45.2 44.1 43.2 43.8 48.7 44.3 44.9 510.6Treated <strong>Water</strong>Revenue-Funded Projects 16.5 8.2 9.1 9.7 8.0 7.6 8.9 8.2 10.6 12.7 99.5Debt-Service (b) 0.8 1.0 2.3 2.3 2.3 2.3 2.3 2.3 2.3 2.3 20.2Debt-Service (c) 5.1 5.1 5.1 5.1 5.1 5.1 5.1 5.1 5.1 5.1 51.0Total Treated 22.4 14.3 16.5 17.1 15.4 15.0 16.3 15.6 18.0 20.1 170.7Funded by OthersDelta Projects (d) 4.9 8.1 8.9 19.8 41.7Funded by Other Agencies 4.5 3.4 0.8 3.4 5.1 13.3 14.4 24.7 14.4 1.1 85.1Funded by Applicants 1.6 1.6 1.6 1.7 1.8 1.9 1.9 2.0 2.1 2.2 18.4Total Funded by Others 11.0 13.1 11.3 24.9 6.9 15.2 16.3 26.7 16.5 3.3 145.2Total <strong>District</strong> 83.6 91.4 110.0 87.2 66.4 73.4 76.4 91.0 78.8 68.32 826.5(a) Approximately 38%f Untreated <strong>Water</strong> Expenditures are paid by Treated <strong>Water</strong> Rates (as the Treated<strong>Water</strong> Service Area is also a Untreated <strong>Water</strong> Customer)(b) Debt service – Commercial Paper and future Long Term Debt - Seismic and Reliability <strong>Improvement</strong>Projects , CCWD/Brentwood WTP (Fully paid by the City of Brentwood)(c) Existing debt service (Los Vaqueros, Randall Bold, Canal)(d) Funded by CALFED agenciesReserve Balances – Reserves are utilized as necessary through the ten-year rate projectionperiod to enable small and consistent revenue increases for both untreated and treated watercustomers. Reserve balances used to smooth rates will be drawn down to the Boardestablished minimum level of six months of projected operating expense by the end of theten-year rate analysis.The reserves shown in Table VI-15 and Figures VI-1 and VI-2 primarily consist of untreatedand treated water reserves, the <strong>Capital</strong> <strong>Improvement</strong> Reserve Fund and the Rate StabilizationReserve Fund. The minimum balance requirements reflect six months of projected operatingexpense consistent with Board Policy. The <strong>District</strong> also maintains six months of debt serviceobligation in the bond reserve funds. However, because the bond reserve funds arerestricted, they are not included in the reserve balance s to offset revenue increases.Page VI-17
Table VI-15 Treated and Untreated <strong>Water</strong> Reserve* Balances by Fiscal <strong>Year</strong>($ in millions) FY09 FY10 FY11 FY12 FY13 FY14 FY15 FY16 FY17 FY18Untreated <strong>Water</strong> Reserves 89.0 73.4 67.6 54.0 40.9 27.1 25.5 23.5 21.5 18.7Minimum Balance 11.2 11.9 12.6 13.3 13.9 14.7 15.5 16.4 17.3 18.2Treated <strong>Water</strong> Reserves 55.5 42.4 44.7 40.4 35.6 29.6 32.3 33.4 37.8 35.8Minimum Balance 22.3 23.5 24.8 25.9 27.1 28.4 29.8 31.2 32.8 34.4* Includes Unrestricted and Board restricted <strong>Capital</strong> <strong>Improvement</strong> and Rate Stabilization Funds. Does not include legally restricted and otherBoard restricted reserves.Figure VI-1Projected Untreated <strong>Water</strong> Reserve Balances100.090.080.070.060.050.040.030.020.010.0-Untreated <strong>Water</strong>ReservesMinimum BalanceFY09FY10FY11FY12FY13FY14FY15FY16FY17FY18Figure VI-2Projected Treated <strong>Water</strong> Reserve Balances60.055.050.045.040.035.030.025.020.015.0Treated <strong>Water</strong>ReservesMinimum BalanceFY09FY10FY11FY12FY13FY14FY15FY16FY17FY18Page VI-18
Revenue Increase ProjectionsTable VI-16 provides the projected increases on the untreated water revenues necessary tomeet the projected expenditures in the 2009 CIP as compared with the 2008 CIP. Table VI-17 shows the treated water projections from the 2009 CIP and the 2008 CIP. Both theuntreated and treated water revenue increases consider the potential that not all of the outsidefunding for the Alternative Intake Project (AIP) will be received. Although sources of outsidefunding are available, they have not been committed to the AIP as of this CIP. As outsidefunding is secured, future CIPs will reflect the impacts on projected revenue increases. Theserevenue increases are higher than those projected in the 2008 CIP as a result of an anticipatedincrease to the cost of water driven by the Delta Vision and HCP processes.Table VI-16 Untreated <strong>Water</strong> Projected Rate Impacts – Priority Level 1 and 2 Projects2009 2010 2011 2012 2013 2014 2015 2016 2017 20182009 CIP 3.0% 3.25% 3.5% 3.5% 3.5% 3.5% 3.75% 3.75% 3.75% 3.75%2008 CIP 3.0% 3.0% 3.0% 3.0% 3.0% 3.0% 3.0% 3.0% 3.0% N/ATable VI-17 Treated <strong>Water</strong> Projected Rate Impacts – Priority Level 1 and 2 Projects2009 2010 2011 2012 2013 2014 2015 2016 2017 20182009 CIP 3.0% 3.15% 3.3% 3.3% 3.3% 3.3% 3.5% 3.5% 3.5% 3.5%2008 CIP 3.0% 3.0% 3.0% 3.0% 3.0% 3.0% 3.0% 3.0% 3.0% N/AIf rates were set to fund all projects identified in the three CIP priority categories, rather thanjust priority level 1 and 2, an additional $200.6 million in revenue would be required in the2009 CIP over the ten-year period. Included in the unfunded priority level 3 projects are$96.6 million for a membrane filtration water quality project and $72.2 million for a largeportion of the Canal Replacement Project.Page VI-19
Section VIIPROJECT SUMMARIES
Administrative, Support and Maintenance Facility<strong>Improvement</strong> <strong>Program</strong>
CONTRA COSTA WATER DISTRICTTEN-YEAR CAPITAL IMPROVEMENT PLANPROJECT SUMMARY<strong>Program</strong>:Sub-<strong>Program</strong>:Project:Administrative, Support and Maintenance Facility <strong>Improvement</strong>Facilities UpgradesAnnual Building and Facility <strong>Improvement</strong>sPriority: 1The purpose of this project is to protect the health and safety of employees and customers and tocomply with codes and regulations related to building health and safety through capitalimprovements to existing <strong>District</strong> buildings and grounds.Examples of types of improvements include: roof replacement; replacement or upgrading of heatingand cooling systems; electrical systems or equipment; plumbing and other mechanical components;and major structural, interior, and site improvements. <strong>Improvement</strong> projects are initiated based onfindings reported on maintenance and field inspection reports. A seismic assessment of <strong>District</strong>Center will be performed in FY2009 and the <strong>District</strong> Center communications rewiring project hasbeen identified for FY2011.This program was included in the FY2008 CIP at a ten-year cost of $3,937,000. The cost has beenadjusted for inflation, and to reflect the addition of the seismic assessment project.Total Project:N/ACost to Date through FY2008:N/ACIP Total: $4,330,000Cost Estimate Accuracy Range: $6,495,000 to $3,031,000 (+50%/-30%)Annual Cost Distribution (in 000's) and Schedule:FY09 FY10 FY11 FY12 FY13 FY14 FY15 FY16 FY17 FY18$533 $398 $613 $398 $398 $398 $398 $398 $398 $398O O O O O O O O O O O O O O O O O O O O O O O O O O O O O O O O O O O O O O O OP = Planning D = Design C = Construction O = OtherProject Funding: 38% of the cost of this project will be funded by untreated water rates and 62% bytreated water rates as described in Section III, Table III-1.Operational Impacts: These improvements will serve to reduce operation and maintenance costs orto keep these costs from rising through replacement or upgrades to facility systems and components.<strong>Improvement</strong>s will also serve to extend the useful life of facilities.Basis for Priority: This project has been ranked as priority level 1 based on the need to continuallyreinvest in the <strong>District</strong>'s support facilities and buildings in order to protect the health and safety ofemployees and customers and to comply with codes and regulations related to building health andsafety.Budgeting Department/Division: Operations and MaintenanceVII-1
CONTRA COSTA WATER DISTRICTTEN-YEAR CAPITAL IMPROVEMENT PLANPROJECT SUMMARY<strong>Program</strong>:Administrative, Support and Maintenance Facility <strong>Improvement</strong>Sub-<strong>Program</strong>:Project:Energy Demand Reduction <strong>Program</strong>Priority: 2The purpose of this project is to evaluate the <strong>District</strong>’s energy use and identify strategies to reduceenergy cost, ensure the <strong>District</strong> is well positioned to meet any new regulations, and to conform to the<strong>District</strong>’s mission of delivering service in an environmentally responsible manner.The <strong>District</strong> has experienced cost increases in electrical energy that are roughly double the rate ofinflation. One issue contributing to the pricing uncertainty is the signing into law last year of AB 32,California’s Global Warming Solutions Act of 2006. The regulations implementing AB 32 are indevelopment and are expected to result in increasing pressure on the <strong>District</strong> to reduce energyconsumption. A water-energy nexus exists because water treatment, transmission, and distribution ofdrinking water are energy intensive processes.This project includes preparation of an energy reduction master plan prioritizing projects that couldbe implemented to reduce energy consumption, specifically electricity and fossil fuel use. The masterplan will evaluate the <strong>District</strong>’s current energy use and will identify energy efficiency type projectsincluding solar, hydropower, pump replacements, and fuel savings. The master plan will include acost/benefit analysis for each alternative identified.This project is new to the CIP.Total Project: $150,000Cost to Date through FY2008: $0CIP Total: $150,000Cost Estimate Accuracy Range: $173, 000 to $135,000 (+15%/-10%)Annual Cost Distribution (in 000's) and Schedule:FY09 FY10 FY11 FY12 FY13 FY14 FY15 FY16 FY17 FY18$150P P P PP = Planning D = Design C = Construction O = OtherProject Funding: 38% of the cost of this project will be funded by untreated water rates and 62% bytreated water rates as described in Section III, Table III-1.Operational Impacts: Impacts to total annual O&M costs are anticipated to be negligible.Basis for Priority: This project has been ranked priority level 2 because the <strong>District</strong> has a moderatelevel of control over the schedule.Budgeting Department/Division: PlanningVII-2
CONTRA COSTA WATER DISTRICTTEN-YEAR CAPITAL IMPROVEMENT PLANPROJECT SUMMARY<strong>Program</strong>:Administrative, Support and Maintenance Facility <strong>Improvement</strong>Sub-<strong>Program</strong>:Project:Solar Power ProjectPriority: 3The purpose of this project is to reduce the <strong>District</strong>’s carbon footprint and offset increasing energycosts with renewable energy sources and to conform to the <strong>District</strong>’s mission of delivering service inan environmentally responsible manner. The <strong>District</strong> has experienced cost increases in electricalenergy that are roughly double the rate of inflation and these increases are projected to continue in thecoming years.The project would entail installation of solar power systems at various <strong>District</strong> Facilities.This project is new to the CIP.Total Project: $3,500,000Cost to Date through FY2008: $0CIP Total: $3,500,000Cost Estimate Accuracy Range: $173, 000 to $135,000 (+15%/-10%)Annual Cost Distribution (in 000's) and Schedule:FY09 FY10 FY11 FY12 FY13 FY14 FY15 FY16 FY17 FY18$313 $3,187D D D D C C C CP = Planning D = Design C = Construction O = OtherProject Funding: The <strong>District</strong> is pursuing partial project funding through the California SolarInitiative Performance Rebate program. Any <strong>District</strong>–funded cost would be allocated based onbenefits received.Operational Impacts: Annual operating cost savings are estimated to be approximately $110,000.Basis for Priority: This project has been ranked priority level 3 because it does not meet the<strong>District</strong>’s five-year payback criteriaBudgeting Department/Division: EngineeringVII-3
Delta Projects <strong>Program</strong>
CONTRA COSTA WATER DISTRICTTEN-YEAR CAPITAL IMPROVEMENT PLANPROJECT SUMMARY<strong>Program</strong>:Delta ProjectsSub-<strong>Program</strong>:Project:Alternative Intake ProjectPriority: 2The purpose of this project is to protect and improve water quality delivered to the <strong>District</strong>’scustomers. The project includes the planning, design, and construction of a new intake on VictoriaCanal where higher quality source water is available. Because of water quality degradation in theDelta and increasingly stringent drinking water regulations, the <strong>District</strong> needs this alternative intaketo continue meeting its water quality objectives. This project is key to ensuring CCWD’s Boardadoptedwater quality objectives continue to be met.Major features of the project include a 72-inch diameter pipeline, a tunnel beneath Old Riverconnecting to the existing Old River Pipeline on Byron Tract, and a new pump station with a capacityof 250 cubic feet per second. Design will be completed in FY2008, and construction is anticipated tobe completed in FY2011.This project was included in the FY2008 CIP at a total project cost of $100,000,000. The cost hasbeen adjusted for inflation and to reflect changes during design development including an increase inthe pipeline diameter and the addition of variable frequency drives.Total Project: $111,207,000 (Escalated)Cost to Date through FY2008: $22,700,000CIP Total: $88,507,000 (Escalated)Cost Estimate Accuracy Range: $137,759,000 to $97,931,000 (+30%/-15%)Annual Cost Distribution (in 000's) and Schedule:FY09 FY10 FY11 FY12 FY13 FY14 FY15 FY16 FY17 FY18$47,619 $37,765 $3,123C C C C C C C C CP = Planning D = Design C = Construction O = OtherProject Funding: The <strong>District</strong>’s share of project costs is anticipated to be $80 million (funded fromuntreated water FRCs and commercial paper to be serviced with untreated water rates). The <strong>District</strong>is seeking $30 to $50 million in funding from various State and federal agencies.Operational Impacts: The <strong>District</strong>’s operations and maintenance costs are estimated to increase by$300,000 per year starting in FY2011. Included in this estimate are labor, additional power cost andlevee maintenance for the new facility.Basis for Priority: This project has been ranked as priority level 2 because the <strong>District</strong> has amoderate level of control as to the project schedule.Budgeting Department/Division: EngineeringVII-4
CONTRA COSTA WATER DISTRICTTEN-YEAR CAPITAL IMPROVEMENT PLANPROJECT SUMMARY<strong>Program</strong>:Delta ProjectsSub-<strong>Program</strong>:Project:Los Vaqueros Reservoir Expansion ProjectPriority: 2The purpose of this project is to enhance the Delta environment and improve Bay Area water supplyreliability and water quality. The project is a result of the recommendations in the long termCALFED Bay-Delta <strong>Program</strong>. Expansion of Los Vaqueros is one of the surface water storageprojects recommended for project-specific study. If this project is shown to be feasible, all CCWDcustomers could potentially benefit.Completion of the initial planning studies in FY2003 allowed the Board of Directors to consider theCALFED Bay-Delta <strong>Program</strong> Proposal for an Enlarged Los Vaqueros Reservoir and call an advisoryvote in March 2004 as required in the CCWD Board Principles. The positive vote allowed the projectto move forward. A final decision on whether and how to enlarge Los Vaqueros will consider theresults of the planning studies, the CCWD Board Principles, and the additional assurances,commitments, and requirements adopted by the Board on June 25, 2003.FY2009 and FY2010 activity will include completion of the environmental and engineering studiesincluding an EIS/EIR, a Federal Feasibility Study, a State Feasibility Study, and a public outreachprogram.This project was included in the FY2008 CIP at a total cost of $24,310,000. The cost has beenadjusted to reflect current and projected future funding.Total Project: $28,437,000Cost to Date through FY2008: $20,692,000CIP Total: $7,745,000Cost Estimate Accuracy Range: $32,310,000 to $26,114,000 (+50% /-30%)Annual Cost Distribution (in 000's) and Schedule:FY09 FY10 FY11 FY12 FY13 FY14 FY15 FY16 FY17 FY18$4,225 $3,520P P P P P PP PP = Planning D = Design C = Construction O = OtherProject Funding: The planning phase of this project is funded entirely by the California Departmentof <strong>Water</strong> Resources and the United States Department of the Interior, Bureau of Reclamation,including CCWD staff labor and overhead.Operational Impacts: These planning activities will not result in O&M impacts. The extent of O&Mimpacts of an enlarged Los Vaqueros will be determined as part of the engineering studies.Basis for Priority: This project is ranked as priority level 2 because the <strong>District</strong> has flexibility inconducting and implementing recommendations from the studies, and funding is provided by outsidesources.Budgeting Department/Division: Delta ProjectsVII-5
Equipment and Other <strong>Capital</strong> Purchases <strong>Program</strong>
CONTRA COSTA WATER DISTRICTTEN-YEAR CAPITAL IMPROVEMENT PLANPROJECT SUMMARY<strong>Program</strong>:Sub-<strong>Program</strong>:Project:Equipment and Other <strong>Capital</strong> PurchasesEquity Funded Equipment<strong>District</strong>-Wide Geographic Information SystemPriority: 2/3The purpose of this project is to improve operating efficiencies by establishing a centralized datasource for the <strong>District</strong>’s drawings, maps, and other operational and planning data. Implementing aGeographic Information System (GIS) assures data consistency and integrity by avoiding errors andeliminating duplication of effort and improves the sharing of planning information with otheragencies and utilities. The system will also track potential hazard information.The initial phase of the project was a master plan that was completed in FY2006. Implementation ofthe GIS is being conducted in phases. The first phase includes acquiring all necessary softwarelicenses, developing the database, converting existing data into the new database format, anddeveloping several key GIS applications including a record drawing and mapping library viewer,shutdown optimization, and customer notification tools. Work will be completed by <strong>District</strong> staff andconsultants with specialized experience. Future phases are included as a priority level 3 placeholder,subject to funding availability.This project was included in the FY2008 CIP at a total cost of $1,496,000. Costs have been adjustedfor inflation.Total Project: $1,692,000Cost to Date through FY2008: $706,000CIP Total: $986,000Cost Estimate Accuracy Range: $1,988,000 to $1,544,000 (+30%/-15%)Annual Cost Distribution (in 000's) and Schedule: Priority 2FY09 FY10 FY11 FY12 FY13 FY14 FY15 FY16 FY17 FY18$452 $231O O O O O O O OAnnual Cost Distribution (in 000's) and Schedule: Priority 3FY09 FY10 FY11 FY12 FY13 FY14 FY15 FY16 FY17 FY18$128 $193O O O O O O O OP = Planning D = Design C = Construction O = OtherProject Funding: 38% of the cost of this project will be funded by untreated water rates and 62% bytreated water rates.Operational Impacts: This project is expected to result in net annual productivity benefits of$200,000 from streamlined mapping, record management and maintenance, and customer service.Basis for Priority: The implementation has been ranked as a priority level 2 because the <strong>District</strong> hasa significant level of control over its schedule.Budgeting Department/Division: EngineeringVII-6
CONTRA COSTA WATER DISTRICTTEN-YEAR CAPITAL IMPROVEMENT PLANPROJECT SUMMARY<strong>Program</strong>:Sub-<strong>Program</strong>:Project:Equipment and Other <strong>Capital</strong> PurchasesEquity Funded - UpgradeLindsey Basin Communication Lines RelocationPriority: 2The purpose of this project is to ensure that the <strong>District</strong>’s communications infrastructure at theRandall-Bold <strong>Water</strong> Treatment Plant, which is essential to supporting <strong>District</strong> operations, continuesto be accessible for repair or replacement.The <strong>District</strong>’s existing joint trench/communication line from the Antioch Service Center to theRandall-Bold <strong>Water</strong> Treatment Plant was covered with approximately twenty feet of fill duringconstruction of <strong>Contra</strong> <strong>Costa</strong> County’s Lindsey Basin flood control project. The work performed bythe County was within its fee title property and is permitted per the <strong>District</strong>’s easement agreement.However, the work created a significant impediment to maintenance or repair of the now deeplyburied communications line.This project consists of evaluating the need for the line to be relocated in an alignment and depth thatcan be easily maintained, or potentially developing a wireless communications system and abandonthe existing conduits.This project was included in the FY2008 CIP at a total cost of $440,000. Costs have been adjusted forinflation.Total Project: $463,000Cost to Date through FY2008: $89,000CIP Total: $374,000Cost Estimate Accuracy Range: $650,000 to $351,000 (+50%/-30%)Annual Cost Distribution (in 000's) and Schedule:FY09 FY10 FY11 FY12 FY13 FY14 FY15 FY16 FY17 FY18$374D D C CP = Planning D = Design C = Construction O = OtherProject Funding: 38% of the cost of this project will be funded by untreated water rates and 62% bytreated water rates as described in Section III, Table III-1.Operational Impacts: This project reduces operating and maintenance costs by making thecommunications line accessible for maintenance and repair.Basis for Priority: The project has been ranked as priority level 2 because the <strong>District</strong> has amoderate level of control as to when upgrades need to occur.Budgeting Department: EngineeringVII-7
CONTRA COSTA WATER DISTRICTTEN-YEAR CAPITAL IMPROVEMENT PLANPROJECT SUMMARY<strong>Program</strong>:Sub-<strong>Program</strong>:Project:Equipment and Other <strong>Capital</strong> PurchasesEquity Funded EquipmentReplacement/Upgrade of Computer SystemsPriority: 2The purpose of this annual program is to ensure that the <strong>District</strong>’s financial, customer billing, andHuman Resources information system needs continue to be met in an efficient manner.New hardware was acquired and installed in FY2001 and a new, Oracle-based financial informationsystem was brought on line in FY2002. An upgraded customer billing system and a new HumanResources Information System were implemented during FY2005. These systems are scheduled forreplacement in FY2014 and FY2016. The project also includes annual software and hardwareupgrades.This program was included in the FY2008 CIP at a ten-year cost of $2,378,000. The cost of theannual upgrades has been adjusted for inflation.Total Project:NACost to Date through FY2008:NACIP Total: $2,498,000Cost Estimate Accuracy Range: $4,020,000 to $2,022,000 (+50%/-30%)Annual Cost Distribution (in 000's) and Schedule:FY09 FY10 FY11 FY12 FY13 FY14 FY15 FY16 FY17 FY18$86 $123 $86 $86 $123 $971 $123 $691 $86 $123O O O O O O O O O O O O O O O O O O O O O O O O O O O O O O O O O O O O O O O OP = Planning D = Design C = Construction O = OtherProject Funding: 38% of the cost of this project will be funded by untreated water rates and 62% bytreated water rates as described in Section III, Table III-1.Operational Impacts: Operating efficiencies are anticipated to increase as the new enhancementsare implemented.Basis for Priority: The <strong>District</strong>’s computer systems are required for efficient operation of the<strong>District</strong>, and must be replaced periodically to ensure that the <strong>District</strong>’s financial and customer billinginformation systems needs continue to be met in an efficient manner. The project has been ranked aspriority level 2 because the <strong>District</strong> has a moderate level of control as to when upgrades need tooccur.Budgeting Department: FinanceVII-8
CONTRA COSTA WATER DISTRICTTEN-YEAR CAPITAL IMPROVEMENT PLANPROJECT SUMMARY<strong>Program</strong>:Sub-<strong>Program</strong>:Project:Equipment and Other <strong>Capital</strong> PurchasesEquity Funded EquipmentReplacement/Upgrade of Network Systems and HardwarePriority: 2The purpose of this annual program is to ensure that the <strong>District</strong>’s core network hardware, which isessential to supporting <strong>District</strong> operations, continues to be replaced or updated in an efficient manner.Core network hardware includes switch-hubs and routers that provide for transmission of email,access to electronic data files, and staff access to key business systems including the FinancialInformation System and Customer Billing Information System. Upgrades are scheduled on a fiveyearcycle to ensure network reliability.This program was included in the FY2008 CIP at a ten-year cost of $1,094,000. The cost has beenadjusted for inflation.Total Project:NACost to Date through FY2008:NACIP Total: $1,182,000Cost Estimate Accuracy Range: $1,773,000 to $827,000 (+50%/-30%)Annual Cost Distribution (in 000's) and Schedule:FY09 FY10 FY11 FY12 FY13 FY14 FY15 FY16 FY17 FY18$49 $86 $215 $230 $11 $49 $86 $215 $230 $11O O O O O O O O O O O O O O O O O O O O O O O O O O O O O O O O O O O O O O O OP = Planning D = Design C = Construction O = OtherProject Funding: 38% of the cost of this project will be funded by untreated water rates and 62% bytreated water rates as described in Section III, Table III-1.Operational Impacts: This project reduces operating and maintenance costs by replacing equipmentwhen it is most cost-effective to do so.Basis for Priority: The <strong>District</strong>’s network hardware systems are required for efficient operation ofthe <strong>District</strong>, and must be replaced periodically to ensure that the <strong>District</strong>’s financial and customerbilling information systems needs continue to be met in an efficient manner. The project has beenranked as priority level 2 because the <strong>District</strong> has a moderate level of control as to when upgradesneed to occur.Budgeting Department: FinanceVII-9
CONTRA COSTA WATER DISTRICTTEN-YEAR CAPITAL IMPROVEMENT PLANPROJECT SUMMARY<strong>Program</strong>:Sub-<strong>Program</strong>:Project:Equipment and Other <strong>Capital</strong> PurchasesEquity Funded EquipmentReplacement/Upgrade of Radio System EquipmentPriority: 2The purpose of this project is to ensure effective and reliable communications among <strong>District</strong>’spersonnel. The <strong>District</strong>’s existing low band radio system is over 40 years old. Newer componentshave been purchased and installed but the technology is not well supported by vendors. Furthermore,the existing system does not cover the <strong>District</strong>’s entire service area. Reliability of the existing radiosystem during normal operations and emergencies is questionable.Replacement of the radio system entails the purchase of new communication equipment for <strong>District</strong>vehicles, base stations, and portable units. A new system could allow the <strong>District</strong> to establishnetworks allowing interfacing with other local agencies, including police and fire departments. It isanticipated that the next system upgrade will occur in FY2019.This project was included in the FY2008 CIP at a total cost of $300,000.Total Project: $300,000Cost to Date through FY2005: $200,000CIP Total: $100,000Cost Estimate Accuracy Range: $315,000 to $295,000 (+15%/-5%)Annual Cost Distribution (in 000's) and Schedule:FY09 FY10 FY11 FY12 FY13 FY14 FY15 FY16 FY17 FY18$50 $50O O O O O O O OP = Planning D = Design C = Construction O = OtherProject Funding: 38% of the cost of this project will be funded by Untreated <strong>Water</strong> funds and 62%by Treated <strong>Water</strong> funds as described in Section III, Table III-1.Operational Impacts: No significant change in operating cost is anticipated.Basis for Priority: This project has been ranked as priority level 2 because the <strong>District</strong> has amoderate level of control as to when upgrades need to occur.Budgeting Department/Division: Operations and MaintenanceVII-10
CONTRA COSTA WATER DISTRICTTEN-YEAR CAPITAL IMPROVEMENT PLANPROJECT SUMMARY<strong>Program</strong>:Sub-<strong>Program</strong>:Project:Equipment and Other <strong>Capital</strong> PurchasesEquity Funded EquipmentReplacement/Upgrade of SCADA EquipmentPriority: 2The purpose of this project is to ensure future capability to remotely monitor and control the<strong>District</strong>’s operational system. Supervisory Control and Data Acquisition (SCADA) system hardwareand software manufacturers continually upgrade their products, making older systems obsolete andexpensive to maintain. In addition, system capacity is limited and must be expanded as the <strong>District</strong>grows.This project provides for the upgrade and replacement of the <strong>District</strong>'s SCADA system, includinghardware and software approximately every 10 years and will extend the life of the system whileallowing for anticipated expansion.Installation of a new digital radio system, new control center equipment, new remote site computerequipment at all <strong>District</strong> facilities, and control room modifications to allow the relocation of theSCADA controls to the Bollman <strong>Water</strong> Treatment Plant were completed in FY2002. The start of thenext upgrade is scheduled for FY2009 and will be based on a phased approach to upgrade the workstation, host computers, and the remote sites over time.This project was included in the FY2008 CIP with a total project cost of $1,220,000. The cost hasbeen adjusted for inflation.Total Project: $1,308,000Cost to Date through FY2008: $0CIP Total: $1,308,000Cost Estimate Accuracy Range: $1,962,000 to $916,000 (+50%/-30%)Annual Cost Distribution (in 000's) and Schedule:FY09 FY10 FY11 FY12 FY13 FY14 FY15 FY16 FY17 FY18$200 $640 $100 $100 $134 $134O O O O O O O O O O O O O O O O O O O O O O O OP = Planning D = Design C = Construction O = OtherProject Funding: 38% of the cost of this project will be funded by untreated water funds and 62%by treated water funds as described in Section III, Table III-1.Operational Impacts: This project has no operational impacts.Basis for Priority: This project has been ranked as priority level 2 because the <strong>District</strong> has amoderate level of control as to when upgrades need to occur.Budgeting Department: Operations and MaintenanceVII-11
CONTRA COSTA WATER DISTRICTTEN-YEAR CAPITAL IMPROVEMENT PLANPROJECT SUMMARY<strong>Program</strong>:Sub-<strong>Program</strong>:Project:Equipment and Other <strong>Capital</strong> PurchasesEquity Funded EquipmentReplacement/Upgrade of Telecommunications EquipmentPriority: 2The purpose of this project is to ensure that the <strong>District</strong>’s telecommunications needs are being met inan efficient and cost-effective manner by periodically re-assessing and upgrading the <strong>District</strong>’stelecommunications system, including telephones services, the Internet, and computer network. Theinitial master plan was completed in FY2004 and its recommendations are being implementedthrough FY2010. The next re-assessment is scheduled for FY2011.This project was included in the FY2008 CIP at a ten-year cost of $616,000. The cost has beenadjusted for inflation and to reflect the completion of FY2008 and the addition of FY2018.Total Project:N/ACost to Date through FY2008:N/ACIP Total: $675,000Cost Estimate Accuracy Range: $1,013,000 to $473,000 (+50%/-30%)Annual Cost Distribution (in 000's) and Schedule:FY09 FY10 FY11 FY12 FY13 FY14 FY15 FY16 FY17 FY18$30 $45 $447 $78 $30 $45O O O O O O O O O O O O O O O O O O O O O O O OP = Planning D = Design C = Construction O = OtherProject Funding: 38% of the cost of this project will be funded by untreated water rates and 62% bytreated water rates as described in Section III, Table III-1.Operational Impacts: This project is not anticipated to have any operational impacts.Basis for Priority: This project has been ranked as priority level 2 because the <strong>District</strong> has amoderate level of control as to when upgrades need to occur.Budgeting Department/Division: FinanceVII-12
CONTRA COSTA WATER DISTRICTTEN-YEAR CAPITAL IMPROVEMENT PLANPROJECT SUMMARY<strong>Program</strong>:Sub-<strong>Program</strong>:Project:Equipment and Other <strong>Capital</strong> PurchasesVehicle ReplacementReplacement of Fleet Vehicles & Heavy EquipmentPriority: 2The purpose of this project is to provide safe, reliable, and cost-efficient operations and transportationfor employees in the performance of their duties.When each vehicle or piece of equipment reaches a specified level of mileage or years of service, it isreviewed for replacement. Each is evaluated based on current condition, maintenance and repairhistory, and other factors. Vehicles or equipment are recommended for replacement when it isdetermined that they have reached the end of their serviceable life, or when it is more cost-effective toreplace them based on anticipated future operating and repair costs.This program was included in the FY2008 CIP as the Replacement of Fleet Vehicles and Replacementof Heavy Equipment projects at a combined ten-year cost of $8,106,000. The cost has been adjustedbased on a needs assessment.Total Project:N/ACost to Date through FY2008:N/ACIP Total: $7,639,000Cost Estimate Accuracy Range: $9,931,000 to $6,493,000 (+30%/-15%)Annual Cost Distribution (in 000's) and Schedule:FY09 FY10 FY11 FY12 FY13 FY14 FY15 FY16 FY17 FY18$750 $750 $822 $661 $640 $871 $812 $815 $818 $700O O O O O O O O O O O O O O O O O O O O O O O O O O O O O O O O O O O O O O O OP = Planning D = Design C = Construction O = OtherProject Funding: This project is funded by the Vehicle Replacement Fund.Operational Impacts: This project reduces operating and maintenance costs by replacing vehicleswhen it is most cost-effective to do so. For purposes of the CIP, operational impacts are assumed tobe negligible.Basis for Priority: This project has been ranked as priority level 2 because it maintains and enhancesexisting assets.Budgeting Division: FinanceVII-13
Expansion of Services <strong>Program</strong>
<strong>Program</strong>:Sub-<strong>Program</strong>:Project:Priority: 1CONTRA COSTA WATER DISTRICTTEN-YEAR CAPITAL IMPROVEMENT PLANPROJECT SUMMARYExpansion of ServicesWholesale Treated <strong>Water</strong>CCWD/Brentwood <strong>Water</strong> Treatment PlantThe purpose of this project is to implement the <strong>District</strong>’s agreement with the City of Brentwood toserve the long-term treated water needs of the City. Under the agreement, CCWD will construct,own, operate, and finance a water treatment plant adjacent to the Randall-Bold site for the exclusiveuse of the City. The Brentwood plant will treat the City’s surface water supply purchased from East<strong>Contra</strong> <strong>Costa</strong> Irrigation <strong>District</strong>.The Brentwood water treatment plant is being designed as recommended in a joint technical studycompleted in FY2004. Permitting and design began in FY2005, and construction began in FY2007and is scheduled to be completed in FY2009. The facility will have an initial treatment capacity of 12MGD and can be expanded to 30 MGD.This project was included in the FY2008 CIP at an escalated cost of $52,122,000. The cost has beenadjusted to reflect costs to date.Total Project:$51,823,000 (escalated)Cost to Date through FY2008: $46,399,000CIP Total:$5,424,000 (escalated)Annual Cost Distribution (in 000's) and Schedule:FY09 FY10 FY11 FY12 FY13 FY14 FY15 FY16 FY17 FY18$5,424C CP = Planning D = Design C = Construction O = OtherProject Funding: The project is funded entirely by the City of Brentwood. The City has depositedfunds for project design and administration prior to these costs being incurred. The <strong>District</strong> will debtfundthe construction cost. The City will pay debt service and financing costs.Operational Impacts: Estimated annual costs are approximately $1,740,000 starting in FY2009.These costs will be paid by the City of Brentwood. The treatment facility will be owned and operatedby the <strong>District</strong>. It is anticipated that significant savings in O&M costs will be realized by the <strong>District</strong>,DWD, and the City of Brentwood by having the <strong>District</strong> joint operate both the Randall-Bold andBrentwood <strong>Water</strong> Treatment Plants with a common staff.Basis for Priority: This project is ranked as priority level 1 because it is funded by others.Budgeting Department/Division: ConstructionVII-14
CONTRA COSTA WATER DISTRICTTEN-YEAR CAPITAL IMPROVEMENT PLANPROJECT SUMMARY<strong>Program</strong>:Sub-<strong>Program</strong>:Project:Expansion of ServicesWholesale Treated <strong>Water</strong>CCWD/Brentwood <strong>Water</strong> Treatment Plant ExpansionPriority: 1The purpose of this project is to expand the City of Brentwood’s <strong>Water</strong> Treatment Plant to meet theanticipated water demands of its growing population. The <strong>District</strong> is currently constructing atreatment plant for the City on the Randall-Bold campus. Construction is scheduled to be complete inFY2009.Expansion of the treatment plant is anticipated to begin in FY2012 and be completed in FY2016.This project includes costs to expand the City of Brentwood <strong>Water</strong> Treatment Plant from its initialcapacity to 30 MGD. The expansion schedule depends on the pace of development within the City ofBrentwood which may modify the schedule.This project was included in the FY2008 CIP at a total project cost of $41,081,000. The cost has beenadjusted for inflation.Total Project: $44,038,000Cost to Date through FY2008: $0CIP Total: $44,038,000Cost Estimate Accuracy Range: $66,057,000 to $30,827,000 (+50%/-30%)Annual Cost Distribution (in 000's) and Schedule:FY09 FY10 FY11 FY12 FY13 FY14 FY15 FY16 FY17 FY18$176 $3,821 $11,141 $18,876 $10,024P P D D D D C C C C C C C C C C C CP = Planning D = Design C = Construction O = OtherProject Funding: This project is entirely funded by the City of Brentwood.Operational Impacts: Operating impacts for the future expansion of the CCWD/Brentwood <strong>Water</strong>Treatment Plant have not been included in the CIP due to the uncertainty in the timing of the project.Operational costs will be paid by the City of Brentwood.Basis for Priority: This project has been ranked as priority level 1 because it is funded by others.Budgeting Department/Division: EngineeringVII-15
Future <strong>Water</strong> Supplies <strong>Program</strong>
CONTRA COSTA WATER DISTRICTTEN-YEAR CAPITAL IMPROVEMENT PLANPROJECT SUMMARY<strong>Program</strong>:Sub-<strong>Program</strong>:Project:Future <strong>Water</strong> SuppliesPlanningFuture <strong>Water</strong> Supply Study UpdatesPriority: 2The purpose of this project is to enable the <strong>District</strong> to implement economically and environmentallysound options to ensure high-quality, reliable water supplies for the next fifty years.The Future <strong>Water</strong> Supply Study (FWSS) is the <strong>District</strong>’s long-term water supply plan, and was firstcompleted in August 1996. Updates are needed to ensure the action plan accurately reflects currentdemand and supply conditions, technological advances, and regulatory changes. The FWSS isupdated approximately every five years, with the most recent update completed in FY2008This project was included in the FY2008 CIP at a total cost of $578,000. The cost has been adjustedfor inflation and to reflect completion of the FY2008 work and addition of the update in FY2018Total Project:N/ACost to Date through FY2008:N/ACIP Total: $425,000Cost Estimate Accuracy Range: $553,000 to $361,000 (+30%/-15%)Annual Cost Distribution (in 000's) and Schedule:FY09 FY10 FY11 FY12 FY13 FY14 FY15 FY16 FY17 FY18$150 $275P P P P P P P PP = Planning D = Design C = Construction O = OtherProject Funding: Updates of the FWSS have been allocated entirely to untreated water with 10% toexisting customers and 90% to future customers, based on the allocation of implementation costs forthe Future <strong>Water</strong> Supply <strong>Program</strong>. The share allocated to existing customers is sub-allocated tountreated water and treated water rates based on consumption.Operational Impacts: As a study, there are no direct operations and maintenance costs associatedwith this project. Operational impacts for each project recommended in the study would be evaluatedas projects are implemented.Basis for Priority: This project has been ranked as priority level 2 because the <strong>District</strong> has amoderate level of control over scope and timing. This study is necessary to determine water supplyneeds of existing and future customers during times of increasing supply uncertainty.Budgeting Department/Division: PlanningVII-16
<strong>Program</strong>:Sub-<strong>Program</strong>:Project:CONTRA COSTA WATER DISTRICTTEN-YEAR CAPITAL IMPROVEMENT PLANPROJECT SUMMARYFuture <strong>Water</strong> Supplies<strong>Water</strong> SuppliesFuture <strong>Water</strong> Supplies PlaceholderPriority: 2The purpose of this placeholder is to help the <strong>District</strong> meet water supply reliability criteria and futureservice obligations, as recommended in the Future <strong>Water</strong> Supply Study (FWSS) updated in FY2008.The project consists of investments from FY2009 through FY2018 consistent with the FWSSrecommendations of securing water for shortages (as a first priority) and for future growth. Purchasesfor growth are funded from the untreated water Facility Reserve Charge (FRC). Increasedconservation efforts from the FWSS are assumed in all years and are included in the <strong>Water</strong> DemandReduction <strong>Program</strong> in the CIP.New supplies for both growth and shortage are assumed. Purchases for drought reliability (and afraction for growth) commenced in FY1999 (ECCID purchase). This project includes the annual buyinfor ECCID water and a placeholder for additional supplies in FY2015. Supplies for shortages areassumed to achieve a firm level of availability of 15% of customer demand. The water purchase planfor the CIP follows the approved FWSS, but is adjusted to the actual demand growth. Under thisschedule, the amount of future water purchased would be limited to the amount collected through theFRC. <strong>Water</strong> purchases for future growth will not affect rates.This program was included in the FY2008 CIP at a ten-year cost of $3,283,000. The cost has beenadjusted for inflation and to reflect a larger investment in additional supplies in FY2015.Total Project:N/ACost to Date through FY2008:N/ACIP Total: $6,918,000Cost Estimate Accuracy Range: $14,427,000 to $6,733,000 (+50%/-30%)Annual Cost Distribution (in 000's) and Schedule:FY09 FY10 FY11 FY12 FY13 FY14 FY15 FY16 FY17 FY18$153 $153 $153 $153 $153 $153 $8,241 $153 $153 $153O O O O O O O O O O O O O O O O O O O O O O O O O O O O O O O O O O O O O O O OP = Planning D = Design C = Construction O = OtherProject Funding: <strong>Water</strong> supplies acquired under this project are necessary to serve the needs offuture customers and are fully funded from the untreated water FRC.Operational Impacts: None. Costs for pumping water for future growth are included in theFinancial Plan.Basis for Priority: This project has been ranked as priority level 2 because it is required to meetfuture service obligations and the <strong>District</strong> has some control over the timing.Budgeting Department/Division: PlanningVII-17
Los Vaqueros <strong>Program</strong>
CONTRA COSTA WATER DISTRICTTEN-YEAR CAPITAL IMPROVEMENT PLANPROJECT SUMMARY<strong>Program</strong>:Sub-<strong>Program</strong>:Project:Los VaquerosRecreationLos Vaqueros Recreation Facilities and EquipmentPriority: 2The purpose of this program is to provide rehabilitation of existing and future recreation facilities andinfrastructure necessary to meet the <strong>District</strong>’s commitments to operating the Los VaquerosRecreation <strong>Program</strong>. The first recreation facilities were completed and opened for public use in 1999.Subsequent public use will result in routine deterioration and incidental vandalism of the facilities.Prompt and timely replacement or restoration of the facilities will insure that they are safe for publicuse and maintain a positive image to the public, which helps to minimize future vandalism.Facilities included are: public buildings and bathrooms, marina structures, fishing docks, paved andunpaved internal site access roads and parking areas, internal site trails and staging areas, watersupply and waste water systems, emergency communications facilities, electrical power andtelephone utilities, and other related facilities and equipment for public access and use.This program was included in the FY2008 CIP at a ten-year cost of $1,229,000. The cost has beenadjusted for inflation.Total Project:N/ACost to Date through FY2008:N/ACIP Total $1,310,000Cost Estimate Accuracy Range: $1,965,000 to $917,000 (+50%/-30%)Annual Cost Distribution (in 000's) and Schedule:FY09 FY10 FY11 FY12 FY13 FY14 FY15 FY16 FY17 FY18$131 $131 $131 $131 $131 $131 $131 $131 $131 $131O O O O O O O O O O O O O O O O O O O O O O O O O O O O O O O O O O O O O O O OP = Planning D = Design C = Construction O = OtherProject Funding: This project is funded entirely by untreated water rates.Operational Impacts: The operational impacts of this project are anticipated to be negligible. Theseimprovements will extend the useful life of facilities and help deter vandalism.Basis for Priority: This project has been ranked as priority level 2 in order to maintain the recreationfunctions and a positive public image of the Los Vaqueros Recreation <strong>Program</strong>.Budgeting Department/Division: <strong>Water</strong>shed and LandsVII-18
CONTRA COSTA WATER DISTRICTTEN-YEAR CAPITAL IMPROVEMENT PLANPROJECT SUMMARY<strong>Program</strong>:Sub-<strong>Program</strong>:Project:Los Vaqueros<strong>Water</strong>shedLand Acquisition and Real Property ManagementPriority: 2The purpose of this program is to protect the <strong>District</strong>’s investment and real property rights in the LosVaqueros Project and other <strong>District</strong>-owned lands by acquiring property rights needed for watershedprotection or protection and enhancement of other <strong>District</strong>-owned properties and operating facilities.Acquisitions may include real property, easements, licenses, land leases, or development rights.This program was included in the FY2008 CIP at a ten-year cost of $1,360,000. The cost has beenadjusted for inflation.Total Project:N/ACost to Date through FY2008:N/ACIP Total: $1,440,000Cost Estimate Accuracy Range: $2,160,000 to $1,008,000 (+50%/-30%)Annual Cost Distribution (in 000's) and Schedule:FY09 FY10 FY11 FY12 FY13 FY14 FY15 FY16 FY17 FY18$144 $144 $144 $144 $144 $144 $144 $144 $144 $144O O O O O O O O O O O O O O O O O O O O O O O O O O O O O O O O O O O O O O O OP = Planning D = Design C = Construction O = OtherProject Funding: This project is funded entirely by untreated and/or treated water rates, dependingon the nature and purpose of the property.Operational Impacts: There may be minimal impacts related to maintaining or leasing out acquiredproperty.Basis for Priority: This project has been ranked as priority level 2 based on the need to protect waterquality and to facilitate <strong>District</strong> operations. There is a moderate level of control over when landacquisitions and other interests in land can occur.Budgeting Department/Division: <strong>Water</strong>shed and LandsVII-19
CONTRA COSTA WATER DISTRICTTEN-YEAR CAPITAL IMPROVEMENT PLANPROJECT SUMMARY<strong>Program</strong>:Sub-<strong>Program</strong>:Project:Los Vaqueros<strong>Water</strong>shedLos Vaqueros <strong>Water</strong>shed <strong>Improvement</strong>sPriority: 2The purpose of this program is to improve the <strong>District</strong>’s capability to protect, manage, and maintainthe 19,100-acre LV watershed area for its primary water quality and natural resource managementpurposes and to meet the <strong>District</strong>’s commitments for Los Vaqueros project-related environmentalmitigation.The watershed improvements include roads, fences, oak tree plantations, sediment control basins,project-related replacement ponds and wetlands, remote water resource facilities for project-relatedreplacement, wetland and pond maintenance, fire prevention and suppression, public safety,communications equipment and facility improvements, and demolition and removal of unsafestructures.This program was included in the FY2008 CIP at a ten-year total of $2,196,000. The cost has beenadjusted for.Total Project:N/ACost to Date through FY2008:N/ACIP Total: $2,340,000Cost Estimate Accuracy Range: $3,510,000 to $1,638,000 (+50%/-30%)Annual Cost Distribution (in 000's) and Schedule:FY09 FY10 FY11 FY12 FY13 FY14 FY15 FY16 FY17 FY18$234 $234 $234 $234 $234 $234 $234 $234 $234 $234O O O O O O O O O O O O O O O O O O O O O O O O O O O O O O O O O O O O O O O OP = Planning D = Design C = Construction O = OtherProject Funding: The project is funded by untreated water rates.Operational Impacts: The operational impacts of this project are anticipated to be minimal.Basis for Priority: The project has been ranked as priority level 2 because it is a Los VaquerosProject requirement to effectively maintain <strong>District</strong> watershed lands and comply with the terms andconditions of the LVP Biological Opinions.Budgeting Department/Division: <strong>Water</strong>shed and LandsVII-20
Treated <strong>Water</strong> Distribution and Storage Facilities <strong>Program</strong>
CONTRA COSTA WATER DISTRICTTEN-YEAR CAPITAL IMPROVEMENT PLANPROJECT SUMMARY<strong>Program</strong>:Sub-<strong>Program</strong>:Project:Treated <strong>Water</strong> Distribution and Storage FacilitiesCorrosion ControlCorrosion Control <strong>Program</strong>Priority: 2The purpose of this project is to protect and prolong the service life and system reliability of the<strong>District</strong>’s existing treated water facilities. By providing cathodic protection, the <strong>District</strong> extends theservice life of its metallic water treatment, storage, transmission, and distribution facilities. Sincecorrosion is an ongoing destructive process with water system components, postponement of theplanned projects may result in the lack of protection to the steel pipelines and structures and may leadto future corrosion-related problems and failures.This project implements measures identified in the 1991 Corrosion Control Management Report, the1996 Treated <strong>Water</strong> Renewal and Replacement Study, and the 1999 Facility Corrosion Control<strong>Program</strong> Assessment.Specific projects are defined annually based on monitoring, inspection, and evaluation of the<strong>District</strong>’s existing facilities. Future projects include the replacement of deep well anode beds andinstallation of new corrosion control systems on non-protected mains, pumps, and reservoirs.This program was included in the FY2008 CIP at a total ten-year cost of $1,512,000. The cost hasbeen adjusted to reflect historical expenditures.Total Project:N/ACost to Date through FY2008:N/ACIP Total: $800,000Cost Estimate Accuracy Range: $1,200,000 to $560,000, (+50%/-30%)Annual Cost Distribution (in 000's) and Schedule:FY09 FY10 FY11 FY12 FY13 FY14 FY15 FY16 FY17 FY18$80 $80 $80 $80 $80 $80 $80 $80 $80 $80O O O O O O O O O O O O O O O O O O O O O O O O O O O O O O O O O O O O O O O OP = Planning D = Design C = Construction O = OtherProject Funding: This project is funded entirely by treated water rates.Operational Impacts: This project will result in operational cost reductions due to lowermaintenance requirements and reduced corrosion-related failures. For the purposes of the CIP,operational impacts are assumed to be negligible.Basis for Priority: This project has been ranked as priority level 2 because it is necessary to maintainexisting capital facilities.Budgeting Department/Division: Operations and MaintenanceVII-21
CONTRA COSTA WATER DISTRICTTEN-YEAR CAPITAL IMPROVEMENT PLANPROJECT SUMMARY<strong>Program</strong>:Sub-<strong>Program</strong>:Project:Treated <strong>Water</strong> Distribution and Storage FacilitiesNon-<strong>District</strong> Funded ProjectsDistribution FacilitiesPriority: 1The purpose of this program is to install water service and distribution facilities, as requested andfunded by developers and other applicants. The facilities typically include service requests and mainextensions, but may include pipelines, pump stations, and storage reservoirs. These projects areusually handled jointly between the <strong>District</strong> and the applicant.Specific projects generally cannot be identified until an applicant presents development plans andrequests service. The cost estimates are based on past experience, but may be significantly lower orhigher in any given year depending upon applicant requests.FY2009 activities include the design and installation of facilities associated with the ClaytonRegency Mobile Home Park main extension, which is being implemented as a result of <strong>Contra</strong> <strong>Costa</strong>County declaring a health emergency.This program was included in the FY2008 CIP at a ten-year cost of $13,083,000. The cost has beenadjusted for inflation and to reflect the addition of the Clayton Regency project in FY09.Total Project:N/ACost to Date through FY2008:N/ACIP Total: $18,497,000Cost Estimate Accuracy Range: $27,746,000 to $12,948,000 (+50%/-30%)Annual Cost Distribution (in 000's) and Schedule:FY09 FY10 FY11 FY12 FY13 FY14 FY15 FY16 FY17 FY18$5,645 $1,428 $1,428 $1,428 $1,428 $1,428 $1,428 $1,428 $1,428 $1,428O O O O O O O O O O O O O O O O O O O O O O O O O O O O O O O O O O O O O O O OP = Planning D = Design C = Construction O = OtherProject Funding: This project is fully applicant funded.Operational Impacts: The operational impact of this project depends on the actual facilities built.Basis for Priority: This project has been ranked as priority level 1 as it is applicant funded. Thiscould include funding from applicants requesting water service, other governmental agencies, specialloan arrangements, governmental grants, or assessment districts. The relocation of pipelines and other<strong>District</strong> facilities must be performed to avoid conflicts with new construction.Budgeting Department/Division: EngineeringVII-22
CONTRA COSTA WATER DISTRICTTEN-YEAR CAPITAL IMPROVEMENT PLANPROJECT SUMMARY<strong>Program</strong>:Sub-<strong>Program</strong>:Project:Treated <strong>Water</strong> Distribution and Storage FacilitiesUpgradesMulti-Purpose Pipeline Pressure Sustaining ValvePriority: 2The purpose of this project is to ensure reliable service to the <strong>District</strong>’s existing and future customersby installing a pressure sustaining valve in the Multi-Purpose Pipeline (MPP). The MPP wasreconfigured shortly after start-up to serve Zone 2 to maintain adequate operating pressures in thepipeline and to operate more efficiently. As demands grow in the TWSA and more water needs tocome from Randall Bold, a means to redirect flow in the MPP from Zone 2 to Zone 1 is required.The recommended solution is to install a pressure sustaining valve in the MPP downstream of theAntioch turnout which would allow the return of the Port Chicago Pipeline and MPP to Zone 1service during periods of high demand. This will allow the <strong>District</strong> to meet future demands and tomaintain adequate pressures in the MPP under low flow conditions.This project is new to the CIP.Total Project: $900,000Cost to Date through FY2008: $0,000CIP Total: $125,000Cost Estimate Accuracy Range: $1,350,000 to $630,000 (+50%/-30%)Annual Cost Distribution (in 000's) and Schedule:FY09 FY10 FY11 FY12 FY13 FY14 FY15 FY16 FY17 FY18$125D D D DP = Planning D = Design C = Construction O = OtherProject Funding: This project is funded by treated water rates.Operational Impacts: Impacts to total annual O&M costs are anticipated to be negligible.Basis for Priority: This project has been ranked priority level 2 because it will enable the <strong>District</strong> tomaintain water pressure and flow standards as demands grow.Budgeting Department/Division: PlanningVII-23
CONTRA COSTA WATER DISTRICTTEN-YEAR CAPITAL IMPROVEMENT PLANPROJECT SUMMARY<strong>Program</strong>:Sub-<strong>Program</strong>:Project:Treated <strong>Water</strong> Distribution and Storage FacilitiesPipe UpgradesPipeline Renewal and ReplacementsPriority: 2The purposes of this program are to: 1) ensure reliable, cost efficient delivery of treated waterthrough replacement of pipelines that have experienced significant leak repair incidents or areundersized for fire flow and distribution capacity, 2) improve water quality circulation by creatinginterties between existing pipelines, and 3) relocate existing pipelines as legally required.The 1996 Treated <strong>Water</strong> Renewal and Replacement Study and the 2007 Treated <strong>Water</strong> Master PlanUpdate outlined a methodology for prioritizing pipeline replacements. In addition, pipelines arerelocated as requested by agencies or property owners, or when pipeline location conflicts with theconstruction work of other agencies.Projects planned for FY2009 and FY2010 include various main replacements in downtown Concord,rehabilitation of the Crockett Pipeline intertie to EBMUD, and transmission valve rehabilitations atstrategic locations. In addition, the <strong>District</strong> is improving circulation and reliability improvements inthe Concord area within the <strong>District</strong>’s treated water service area by installing approximately 2,200linear feet of new 12-inch water main, coinciding with the City of Concord’s planned street extensionfrom Commerce Avenue to <strong>Water</strong>world Parkway in FY2009.This program was included in the FY2008 CIP at a ten-year cost of $18,969,000. The cost has beenadjusted for inflation and to reflect the intertie and valve work.Total Project:N/ACost to Date through FY2008:N/ACIP Total: $21,966,000Cost Estimate Accuracy Range: $32,949,000 to $15,376,000 (+50%/-30%)Annual Cost Distribution (in 000's) and Schedule:FY09 FY10 FY11 FY12 FY13 FY14 FY15 FY16 FY17 FY18$2,667 $2,367 $2,367 $2,367 $2,033 $2,033 $2,033 $2,033 $2,033 $2,033C C D D C C D D C C D D C C D D C C D D C C D D C C D D C C D D C C D D C C D DP = Planning D = Design C = Construction O = OtherProject Funding: This project is entirely treated water rate funded.Operational Impacts: These projects provide increased reliability and improved circulation, andeliminate conflicts with other utilities. Failure to replace aging pipelines would increase operatingcosts. For the purpose of the CIP, operating cost impacts are assumed to be negligible.Basis for Priority: This project has been ranked as priority level 2 because pipeline upgrades arenecessary to ensure reliable treated water system performance and minimize a source of unscheduledmaintenance demands upon the Operations and Maintenance Department.Budgeting Department/Division: EngineeringVII-24
CONTRA COSTA WATER DISTRICTTEN-YEAR CAPITAL IMPROVEMENT PLANPROJECT SUMMARY<strong>Program</strong>:Sub-<strong>Program</strong>:Project:Treated <strong>Water</strong> Distribution and Storage FacilitiesPipes - NewPort Chicago Pipeline Phase IIPriority: 2The purpose of this project is to ensure reliable service to the <strong>District</strong>’s existing and future treatedwater customers by providing a new backbone transmission main recommended in the SeismicReliability <strong>Improvement</strong> Project (SRIP) Study and identified in the 2007 Treated <strong>Water</strong> Master Planupdate.This project consists of the design and construction of approximately 10,400 feet of 24 to 36 inchdiameter pipeline extending from the Port Chicago Phase I pipeline near Willow Pass Road to CowellRoad. Planning/design is scheduled to start in FY2017 and construction completion is scheduled byFY2020.This project was included in the FY2008 CIP at a total project cost of $6,116,000. The cost has beenupdated based on the 2007 Treated <strong>Water</strong> Master Plan Update and reflects the <strong>District</strong>’s recent costhistory on similarly sized pipelines.Total Project: $8,300,000Cost to Date through FY2008: $0CIP Total: $1,159,000Cost Estimate Accuracy Range: $12,450,000 to $5,810,000 (+50%/-30%)Annual Cost Distribution (in 000's) and Schedule:FY09 FY10 FY11 FY12 FY13 FY14 FY15 FY16 FY17 FY18$125 $1,034P P D DC C C CP = Planning D = Design C = Construction O = OtherProject Funding: This project is funded by treated water rates (49.6%) and treated water FRCs(50.4%) per the 2007 Treated <strong>Water</strong> Master Plan update.Operational Impacts: The operational impact of this project is estimated to be $5,000 per yearbeginning in FY2020, which is outside of the current CIP window, and includes valve exercising,corrosion protection, monitoring and maintenance, and occasional flushing.Basis for Priority: This project has been ranked as priority level 2 because it will enable the <strong>District</strong>to maintain water pressure and flow standards for the entire system as demands grow.Budgeting Department/Division: PlanningVII-25
CONTRA COSTA WATER DISTRICTTEN-YEAR CAPITAL IMPROVEMENT PLANPROJECT SUMMARY<strong>Program</strong>:Sub-<strong>Program</strong>:Project:Treated <strong>Water</strong> Distribution and Storage FacilitiesSite UpgradesCountry Club Pump Station ExpansionPriority: 2/3The purpose of this project is to ensure reliable service to the <strong>District</strong>’s treated water customers byexpanding pumping capacity at the Country Club Pump Station located in Pleasant Hill. The CountryClub Pump Station was originally constructed in 1967 and was designed to be expandable toaccommodate growth or to relocate pumping capacity from other sub-zones.This project consists of the design and construction of a 4.1 million gallon per day pump station atthe existing Country Club Pump Station site. The pump station will be sized to meet build-outdemands as identified in the 2007 update of the Treated <strong>Water</strong> Master Plan. Construction will occurin FY2008 and FY2009. The design of demolition and new inlet/outlet line alignment at the PasoNogal Pump Station site is planned for FY2009 with construction in FY2010, as a Priority Level 3project.This project was included in the FY2008 CIP at a total project placeholder cost of $1,040,000. Thecost of the expansion phase has increased to $2,948,000 based on progress of design. In addition thedemolition/realignment phase has been added for $3,247,000.Total Project: $6,195,000Cost to Date through FY2008: $795,000CIP Total: $5,400,000Cost Estimate Accuracy Range: $8,896,000 to $4,575,000 (+50%/-30%)Annual Cost Distribution (in 000's) and Schedule: Priority Level 2FY09 FY10 FY11 FY12 FY13 FY14 FY15 FY16 FY17 FY18$2,153C C C CP = Planning D = Design C = Construction O = OtherAnnual Cost Distribution (in 000's) and Schedule: Priority Level 3FY09 FY10 FY11 FY12 FY13 FY14 FY15 FY16 FY17 FY18$535 $2,712D D D D C C C CP = Planning D = Design C = Construction O = OtherProject Funding: The expansion portion of this project is funded by treated water rates. Funding ofthe demolition/realignment portion is to be determined.Operational Impacts: Operational impacts will be minimal.Basis for Priority: This project has been ranked as priority level 2 because its completion is neededto satisfy the <strong>District</strong>’s criteria to provide reliable service to its customers.Budgeting Department/Division: EngineeringVII-26
CONTRA COSTA WATER DISTRICTTEN-YEAR CAPITAL IMPROVEMENT PLANPROJECT SUMMARY<strong>Program</strong>:Sub-<strong>Program</strong>:Project:Treated <strong>Water</strong> Distribution and Storage FacilitiesSite UpgradesTreated <strong>Water</strong> Facilities <strong>Improvement</strong>s <strong>Program</strong>Priority: 2The purpose of this program is to ensure reliable operation of the <strong>District</strong>’s treated water facilities,some of which are nearing the end of their useful life.The project consists of the rehabilitation of pump stations, improvements to facility site drainage,water quality, fencing, landscaping, pavement, pump station roofing, and demolition of permanentlyinactive pump stations and reservoirs, as identified in the <strong>District</strong>’s Treated <strong>Water</strong> Renewal andReplacement Study. <strong>Improvement</strong>s will be performed in order of priority based on criteria thatinclude health and safety, facility’s ability to meet critical demands, impacts to operations, damage,estimated remaining useful life, and appearance.Planned major projects include completing construction of the Pine Hollow Chloramine BoosterStation project in FY2009. Future projects will focus on construction of additional chloraminebooster stations to improve distribution system water quality, and the rehabilitation of pumps. Inaddition, improvements to the Seminary Pump Station and to the Canterbury and Divide Tanksaccess roads will be designed in FY2009 for construction in FY2010.This program was included in the FY2008 CIP at a ten-year cost of $15,053,000. The cost has beenadjusted for inflation.Total Project:N/ACost to Date through FY2008:N/ACIP Total: $16,000,000Cost Estimate Accuracy Range: $24,000,000 to $11,200,000 (+50%/-30%)Annual Cost Distribution (in 000's) and Schedule:FY09 FY10 FY11 FY12 FY13 FY14 FY15 FY16 FY17 FY18$1,709 $2,091 $1,500 $1,550 $1,500 $1,550 $1,500 $1,550 $1,500 $1,550D D C C D D C C D D C C D D C C D D C C D D C C D D C C D D C C D D C C D D C CP = Planning D = Design C = Construction O = OtherProject Funding: This project is entirely funded by treated water rates. The cost of the pumprehabilitation program will be offset by a reduction in operating budget.Operational Impacts: The impact of this project on operations and maintenance costs is expected tobe minimal.Basis for Priority: This project has been ranked as priority level 2 because treated water siteupgrades are necessary to maintain and enhance existing assets.Budgeting Department/Division: EngineeringVII-27
CONTRA COSTA WATER DISTRICTTEN-YEAR CAPITAL IMPROVEMENT PLANPROJECT SUMMARY<strong>Program</strong>:Sub-<strong>Program</strong>:Project:Treated <strong>Water</strong> Distribution and Storage FacilitiesStorage – New FacilitiesSubzone 34 ReservoirPriority: 2The purpose of this project is to ensure reliable service to the <strong>District</strong>’s existing and future treatedwater customers by providing a new water storage facility to alleviate emergency storage andoperational deficiencies in Subzone 34, as identified and prioritized in the 2007 Treated <strong>Water</strong> MasterPlan update.This project consists of the design and construction of a 1.0 million gallon buried concrete reservoirat an undetermined site in Subzone 34 in the Northgate area of Walnut Creek. The reservoir is sizedto mitigate existing storage deficiencies in Subzones 34 and 35, and to accommodate future growth.Design of the reservoir is scheduled to begin in FY2018 and construction will begin outside of thecurrent CIP window.This project was included in the FY2008 CIP at a cost of $3,365,000. The cost has been updatedbased on the 2007 Treated <strong>Water</strong> Master Plan Update and reflects the <strong>District</strong>’s recent cost history onsimilarly sized reservoirs and the schedule has been shifted to begin in FY2018 based on an updatedassessment of storage needs in the sub-zone.Total Project: $4,660,000Cost to Date through FY2008: $0CIP Total: $195,000Cost Estimate Accuracy Range: $6,990,000 to $3,262,000 (+50%/-30%)Annual Cost Distribution (in 000's) and Schedule:FY09 FY10 FY11 FY12 FY13 FY14 FY15 FY16 FY17 FY18$195P = Planning D = Design C = Construction O = OtherProject Funding: This project is funded by treated water rates (86.7%) and treated water FRCs(13.3%) per the 2007 TWSA Master Plan update.Operational Impacts: The operational impact of this project is estimated to be $14,000 per year andwill begin in FY2020, which is outside of the current CIP window. The costs include routineinspection of instrumentation, exercising of valves, response to alarms, and periodic cleaning andinspection of the interior.Basis for Priority: This project has been ranked as priority level 2 because its completion is neededto satisfy the <strong>District</strong>’s emergency storage criteria. Adhering to these criteria will increase or maintainthe reliability of the TWSA system.Budgeting Department/Division: PlanningPPVII-28
CONTRA COSTA WATER DISTRICTTEN-YEAR CAPITAL IMPROVEMENT PLANPROJECT SUMMARY<strong>Program</strong>:Sub-<strong>Program</strong>:Project:Treated <strong>Water</strong> Distribution and Storage FacilitiesStorage - UpgradesTreated <strong>Water</strong> Reliability <strong>Improvement</strong>sPriority: 2/3The purpose of this project is to improve the emergency response capability of the Treated <strong>Water</strong>Service Area (TWSA) to ensure reliable service to the <strong>District</strong>’s existing and future treated watercustomers. The 2002 TWSA Master Plan update recommended a combination of pumping, pipeline,and storage improvements as a cost-effective means to achieve an equivalent level of reliability thatstorage alone would provide.Installation of standby generators and seismic valves at seven sites was completed in FY2006. Theinstallation of generators at San Miguel Pump Station was completed in FY2007 and will becompleted at Seminary Pump Station in FY2010. Pipeline seismic improvements at Concord FaultCrossings (priority level 2) were constructed in FY2007. The second phase of pipeline improvements(priority level 3) would be designed in FY2010 and implemented in FY2011, subject to receipt ofgrant funding.This project was included in the FY2008 CIP at a total project cost of $7,266,000. The cost has beenadjusted for inflation.Total Project: $7,377,000Cost to Date through FY2008: $4,532,000CIP Total: $2,845,000Cost Estimate Accuracy Range: $8,800,000 to $6,523,000 (+50%/-30%)Annual Cost Distribution (in 000's) and Schedule: Priority Level 2FY09 FY10 FY11 FY12 FY13 FY14 FY15 FY16 FY17 FY18$453C C C CAnnual Cost Distribution (in 000's) and Schedule: Priority Level 3FY09 FY10 FY11 FY12 FY13 FY14 FY15 FY16 FY17 FY18$404 $1,988D D D D C C C CP = Planning D = Design C = Construction O = OtherProject Funding: The priority level 2 component is funded by treated water rates. Priority level 3activities would be funded by grant funds.Operational Impacts: The operational impacts of this project are estimated at $20,000 per year formaintenance service of the standby generators.Basis for Priority: The initial phase of the project has been ranked as priority level 2 because itscompletion is needed to satisfy the <strong>District</strong>’s emergency storage criteria. The second phase has beenranked as priority level 3 because it is dependent upon outside funding sources.Budgeting Department/Division: EngineeringVII-29
CONTRA COSTA WATER DISTRICTTEN-YEAR CAPITAL IMPROVEMENT PLANPROJECT SUMMARY<strong>Program</strong>:Sub-<strong>Program</strong>:Project:Treated <strong>Water</strong> Distribution and Storage FacilitiesStorage UpgradesTreated <strong>Water</strong> Reservoir Rehabilitation <strong>Program</strong>Priority: 2The purpose of this program is to ensure reliable operation of the <strong>District</strong>’s treated water storagereservoirs (steel tanks and concrete reservoirs). Previous inspections of interiors and exteriors haveidentified significant corrosion and structural degradation in some reservoirs, and these reservoirshave been prioritized for repair. Additionally, water quality impacts experienced in the distributionsystem have identified operational constraints inherent in the older tank and reservoir designs.Through FY2008, six steel tanks and four concrete tanks have been replaced or rehabilitated.<strong>Improvement</strong>s may include rehabilitation, replacement, abandonment, or relocation of some waterstorage capacity, and would include addition of state of the art corrosion protection, seismicreinforcement, water quality improvements, and operational enhancements.With the completion of the new Midhill II Reservoir, the <strong>District</strong> can now remove Midhill IReservoir from service to remediate its mercury based seals. Design will be completed in FY2009 forFY2010 construction. Other upcoming projects include coating repairs at Bailey, Taylor, GregoryGardens, and Pleasant Hill Reservoirs; rehabilitation of Newhall Reservoir; concrete repairs atCrystal Ranch Reservoir; and drainage improvements for Murchio and Nob Hill.This program was included in the FY2008 CIP at a ten-year cost of $6,777,000. The cost has beenadjusted for inflation.Total Project:NACost to Date through FY2008:NACIP Total: $7,020,000Cost Estimate Accuracy Range: $10,530,000 to $4,914,000 (+50%/-30%)Annual Cost Distribution (in 000's) and ScheduleFY09 FY10 FY11 FY12 FY13 FY14 FY15 FY16 FY17 FY18$256 $1,388 $206 $1,138 $206 $1,138 $206 $1,138 $206 $1,138D D D D C C C C D D D D C C C C D D D D C C C C D D D D C C C C D D D D C C C CP = Planning D = Design C = Construction O = OtherProject Funding: This project is funded entirely by treated water rates.Operational Impacts: This program will help to reduce the amount of maintenance required to keepthe current reservoirs operational. For purposes of the CIP, the operational impact is assumed to benegligible.Basis for Priority: This project is ranked as priority level 2 because upgrades are required tomaintain operation of the existing treated water reservoirs.Budgeting Department/Division: EngineeringVII-30
<strong>Program</strong>:Sub-<strong>Program</strong>:Project:Priority: 2CONTRA COSTA WATER DISTRICTTEN-YEAR CAPITAL IMPROVEMENT PLANPROJECT SUMMARYTreated <strong>Water</strong> Distribution and Storage FacilitiesTWSA PlanningTreated <strong>Water</strong> Service Area Master Plan UpdateThe purpose of this project is to ensure timely, cost-effective, and environmentally soundimprovement to the <strong>District</strong>’s treated water service area facilities. The current Treated <strong>Water</strong> ServiceArea (TWSA) Master Plan was completed in 2007. Periodic updates are needed to ensure that theplan accurately reflects changes in the communities to which treated water service is provided.This project was included in the FY2008 CIP at a ten-year cost of $338,000. The cost has beenadjusted for inflation.Total Project:N/ACost to Date through FY2008:N/ACIP Total: $250,000Cost Estimate Accuracy Range: $325,000 to $213,000 (+30%/-15%)Annual Cost Distribution (in 000's) and Schedule:FY09 FY10 FY11 FY12 FY13 FY14 FY15 FY16 FY17 FY18130 $120P P P P P P P PP = Planning D = Design C = Construction O = OtherProject Funding: This project is funded by treated water rates (46.5%) and treated water FRCs(53.5%) per the 1998 Facility Reserve Charge Analysis.Operational Impacts: There are no operations and maintenance costs associated with the plan.Operational impacts for each capital improvement recommended in the plan will be evaluated as theimprovements are implemented.Basis for Priority: This project is ranked as priority level 2 because it ensures that the <strong>District</strong> willmeet water service and reliability commitments. The plan ensures an integrated approach for meetingthe supply and distribution needs of the TWSA.Budgeting Department/Division: PlanningVII-31
CONTRA COSTA WATER DISTRICTTEN-YEAR CAPITAL IMPROVEMENT PLANPROJECT SUMMARY<strong>Program</strong>:Sub-<strong>Program</strong>:Project:Treated <strong>Water</strong> Distribution and Storage FacilitiesTWSA PlanningTreated <strong>Water</strong> Renewal/Replacement Study UpdatePriority: 2The purpose of this project is to ensure timely, cost effective, and environmentally soundimprovement to the <strong>District</strong>’s treated water service area through periodic updates of the Treated<strong>Water</strong> Renewal/Replacement Study.The Study presents the technical planning basis for many of the projects included in the CIP’sTreated <strong>Water</strong> Distribution and Storage Facilities <strong>Program</strong>. An update was completed in FY2005.This project will update the study in FY2011 and FY2017 to reflect changes in the condition of thetreated water facilities including pumping stations, concrete reservoirs, and steel tanks.This project was included in the FY2008 CIP at a ten-year cost of $250,000.Total Project: $250,000Cost to Date through FY2008: $0CIP Total: $250,000Cost Estimate Accuracy Range: $325,000 to $213,000 (+30%/-15%)Annual Cost Distribution (in 000's) and Schedule:FY09 FY10 FY11 FY12 FY13 FY14 FY15 FY16 FY17 FY18$215 $135P P P P P P P PP = Planning D = Design C = Construction O = OtherProject Funding: This project is funded by treated water rates.Operational Impacts: There are no operations and maintenance costs associated with the plan.Operational impacts for each capital improvement recommended in the plan will be evaluated as theimprovements are implemented.Basis for Priority: This project is ranked as priority level 2 because it ensures that the <strong>District</strong> willmeet water service and reliability commitments.Budgeting Department/Division: PlanningVII-32
Untreated <strong>Water</strong> Supply and Transport <strong>Program</strong>
CONTRA COSTA WATER DISTRICTTEN-YEAR CAPITAL IMPROVEMENT PLANPROJECT SUMMARY<strong>Program</strong>:Sub-<strong>Program</strong>:Project:Untreated <strong>Water</strong> Supply and TransportNon-<strong>District</strong> Funded ProjectsUntreated <strong>Water</strong> Applicant Funded ProjectsPriority: 1The purpose of this program is to relocate untreated water facilities as requested and funded bydevelopers and other applicants. Specific projects cannot be identified until an applicant presentsdevelopment plans and requests service. The cost estimates are based on past experiences, but may besignificantly lower or higher in any given year depending upon applicant requests.Ongoing development in East County causes the continued need for the type of untreated waterfacility relocations and modifications provided by this project. Anticipated future projects includerelocation of portions of laterals.This program was included in the FY2008 CIP at a ten-year cost of $1,689,000. The cost has beenadjusted for inflation.Total Project:N/ACost to Date through FY2008:N/ACIP Total: $1,850,000Cost Estimate Accuracy Range: $2,775,000 to $1,295,000 (+50%/-30%)Annual Cost Distribution (in 000's) and Schedule:FY09 FY10 FY11 FY12 FY13 FY14 FY15 FY16 FY17 FY18$185 $185 $185 $185 $185 $185 $185 $185 $185 $185O O O O O O O O O O O O O O O O O O O O O O O O O O O O O O O O O O O O O O O OP = Planning D = Design C = Construction O = OtherProject Funding: The project is fully applicant funded.Operational Impacts: The operational impact of this project depends on the actual facilities built.Basis for Priority: This project has been ranked as priority level 1 as the funding is from non-<strong>District</strong> sources. The relocation of pipelines and other <strong>District</strong> facilities must be performed to avoidconflicts with new construction.Budgeting Department/Division: EngineeringVII-33
CONTRA COSTA WATER DISTRICTTEN-YEAR CAPITAL IMPROVEMENT PLANPROJECT SUMMARY<strong>Program</strong>:Sub-<strong>Program</strong>:Project:Untreated <strong>Water</strong> Supply and TransportUntreated <strong>Water</strong> Facilities - PlanningLos Vaqueros Energy RecoveryPriority: 2The purpose of this project is to offset energy costs by implementing energy generating facilities,such as hydropower, if feasible. The project has been divided into phases: a study to identify andevaluate potential energy generating facilities and an implementation phase for design andconstruction of any recommended facilities, subject to funding.Feasibility studies completed to date conclude that constructing a hydropower generation facility atthe Los Vaqueros Pipeline has a payback of approximately ten years, contingent on how the PublicUtilities Commission addresses the phase out of Competitive Transition Charges and futurelegislation regarding small hydropower facilities. The <strong>District</strong> will pursue grants as they becomeavailable. Assuming 50 percent outside funding would shorten the payback period to less than the<strong>District</strong>’s five-year criteria for priority level 2 projects.Funds are included in FY2009 to continue feasibility studies on alternative sources of energy for the<strong>District</strong>.This project was included in the FY2008 CIP at a total project cost of $3,405,000. The cost has beenadjusted to reflect an updated cost estimate.Total Project: $4,734,000Cost to Date through FY2008: $184,000CIP Total: $4,550,000Cost Estimate Accuracy Range: $7,009,000 to $3,369,000 (+50%/-30%)Annual Cost Distribution (in 000's) and Schedule – Priority 2:FY09 FY10 FY11 FY12 FY13 FY14 FY15 FY16 FY17 FY18$50 $645 $1,825 $2,030P P P P D D D D C C C C C C C CProject Funding: The study phase is funded by untreated water rates. Funding for theimplementation phase is assumed to be funded 50 percent by untreated water rates and 50 percent bygrants.Operational Impacts: Annual operating cost savings are estimated to be approximately $370,000,beginning in FY13.Basis for Priority: This project has been ranked as priority level 2 because the <strong>District</strong> has amoderate level of control over scope and timing.Budgeting Department/Division: PlanningVII-34
CONTRA COSTA WATER DISTRICTTEN-YEAR CAPITAL IMPROVEMENT PLANPROJECT SUMMARY<strong>Program</strong>:Sub-<strong>Program</strong>:Project:Untreated <strong>Water</strong> Supply and TransportUntreated <strong>Water</strong> Facilities - PlanningUntreated <strong>Water</strong> Facility <strong>Improvement</strong> Plan UpdatePriority: 2The purpose of this project is to ensure timely, cost effective, and environmentally soundimprovements to the <strong>District</strong>'s untreated water facilities. The Untreated <strong>Water</strong> Facilities <strong>Improvement</strong>Plan (UWFIP) evaluates future needs of the untreated water facilities including such items asrequired capacity improvements, structural upgrades, renewal/replacement needs, and evaluation ofalternatives to reduce canal loop maintenance costs.Periodic updates are needed to ensure that the plan accurately reflects current improvement priorities.The plan was last updated in FY2006. Future updates of the UWFIP will be completed in FY2011and FY2016.This project was included in the FY2008 CIP at a cost of $585,000.Total Project: $585,000Cost to Date through FY2008: $0CIP Total: $585,000Cost Estimate Accuracy Range: $761,000 to $497,000 (+30%/-15%)Annual Cost Distribution (in 000's) and Schedule:FY09 FY10 FY11 FY12 FY13 FY14 FY15 FY16 FY17 FY18$375 $210P P P P P P P PP = Planning D = Design C = Construction O = OtherProject Funding: The project is funded by untreated water rates.Operational Impacts: As a study, there are no direct operations and maintenance costs associatedwith this project. Operational impacts for each project recommended in the study would be evaluatedas projects are implemented.Basis for Priority: This project has been ranked as priority level 2 because the integrity of theuntreated water system depends on a comprehensive plan to ensure timely and cost effectiveimprovements. The Untreated <strong>Water</strong> Facility <strong>Improvement</strong> Plan will prioritize projects necessary tomeet future needs of the <strong>District</strong>.Budgeting Department/Division: PlanningVII-35
CONTRA COSTA WATER DISTRICTTEN-YEAR CAPITAL IMPROVEMENT PLANPROJECT SUMMARY<strong>Program</strong>:Sub-<strong>Program</strong>:Project:Untreated <strong>Water</strong> Supply and TransportUntreated <strong>Water</strong> Facilities - NewUntreated <strong>Water</strong> Pipeline PlaceholderPriority: 2The purpose of this project is to supplement the <strong>District</strong>’s untreated water conveyance system, tomeet near-term and long-term water demands, and to improve fire-fighting flows after a majorearthquake. The project was identified in the Seismic and Reliability <strong>Improvement</strong>s Project (SRIP),which was adopted by the Board on January 8, 1997.The project, tentatively scheduled to be started in FY2014 and completed in FY2017, includes a 4-mile long untreated water pipeline and a 36 million gallon per day untreated water pump station inAntioch. The timing for the project will depend on demand growth in the service area. Canaldemands are analyzed as part of the Future <strong>Water</strong> Supply Study.This project was included in the FY2008 CIP at a total project cost of $18,729,000. The cost has beenadjusted for inflation.Total Project: $20,082,000Cost to Date through FY2008:NACIP Total: $20,082,000Cost Estimate Accuracy Range: $30,123,000 to $14,057,000 (+50%/-30%)Annual Cost Distribution (in 000's) and Schedule:FY09 FY10 FY11 FY12 FY13 FY14 FY15 FY16 FY17 FY18$333 $1,325 $9,260 $9,164P P D D D D D D C C C C C C C CP = Planning D = Design C= Construction O = OtherProject Funding: The project would be debt-funded with debt service being funded by untreated andtreated water rates and untreated water FRCs.Operational Impacts: The additional cost of operating the untreated water pump station will bedetermined during project design. Operating impacts will begin after project completion in FY2018.Basis for Priority: This project has been ranked as priority level 2 because the <strong>District</strong> has amoderate level of control over the scope and implementation of this project.Budgeting Department/Division: PlanningVII-36
<strong>Program</strong>:Sub-<strong>Program</strong>:Project:Priority: 1/2/3CONTRA COSTA WATER DISTRICTTEN-YEAR CAPITAL IMPROVEMENT PLANPROJECT SUMMARYUntreated <strong>Water</strong> Supply and TransportUntreated <strong>Water</strong> Facilities -UpgradesCanal Replacement Project - continuedProject Funding: The <strong>District</strong>’s share of the project cost is anticipated to be $5.6 million, which isneeded to satisfy cost sharing requirements from various grants. The balance of the project costwould be funded by Developers’ contributions and various State and Federal grants, includingWRDA 219Operational Impacts: The operational costs of this project are anticipated to be significant due tonew activities required to maintain and clear debris from the new pipeline. However, these costs willbe offset by a reduction of activities associated with the open waterway (such as levee maintenance,application of herbicides, dredging, etc.) that will no longer be needed. Net operating impacts areassumed to be negligible.Basis for Priority: The first phase of this project is ranked as priority level 1 because the <strong>District</strong> hasreceived project funding through grant agreements and funding from developers with a cash flow tiedto the pace of housing development. The final phase of the project is ranked as priority level 3because the <strong>District</strong> has significant control as to when to implement these portions of this project.Budgeting Department/Division: EngineeringVII-38
CONTRA COSTA WATER DISTRICTTEN-YEAR CAPITAL IMPROVEMENT PLANPROJECT SUMMARY<strong>Program</strong>:Sub-<strong>Program</strong>:Project:Untreated <strong>Water</strong> Supply and TransportUntreated <strong>Water</strong> Facilities - UpgradesLos Vaqueros Pipeline Relocation – Balfour RoadPriority: 1The purpose of this project is to comply with the 1994 Agreement between the <strong>District</strong> and the StateRoute 4 Bypass Authority (Authority) for construction of the original Los Vaqueros Pipeline (LVP)at Balfour Road in Brentwood, by relocating the pipeline to accommodate State Route 4 Bypass(Bypass) construction at this location.To accommodate original construction of the LVP and avoid possible unnecessary costs foraccommodating a then proposed Bypass interchange at Balfour Road, the <strong>District</strong> entered into anagreement with the Authority to allow the LVP to be constructed straight through the future proposedinterchange that connects Balfour to the new Bypass. This approach saved initial construction costs,while avoiding expending LVP project funds for a future Bypass project that might not occur.The Authority has recently budgeted for this specific interchange at Balfour Road. Additionally, theAuthority has prepared preliminary designs for this interchange indicating the LVP will be requiredto be relocated to allow for Bypass construction. This project provides the design and constructionfunding necessary to meet the <strong>District</strong>’s obligation to relocate the LVP at this location in 2015.This project was included in the FY2008 CIP at a cost of $2,500,000. The cost has been adjusted forinflationTotal Project: $3,000,000Cost to Date through FY2008: $0CIP Total: $3,000,000Cost Estimate Accuracy Range: $4,500,000 to $2,100,000 (+50%/-30%)Annual Cost Distribution (in 000's) and Schedule:FY09 FY10 FY11 FY12 FY13 FY14 FY15 FY16 FY17 FY18$466 $2,534D D D D C C C CP = Planning D = Design C = Construction O = OtherProject Funding: If the Authority awards construction for the interchange prior to June 2015, theproject will be funded from the Los Vaqueros Commitments Reserve Fund and untreated water rates;otherwise the Authority will fund the relocation.Operational Impacts: Operational impacts of the relocation are expected to be minimal.Basis for Priority: This project has been ranked a priority level 1 because it is a contractualobligation of the <strong>District</strong>.Budgeting Department/Division: EngineeringVII-39
CONTRA COSTA WATER DISTRICTTEN-YEAR CAPITAL IMPROVEMENT PLANPROJECT SUMMARY<strong>Program</strong>:Sub-<strong>Program</strong>:Project:Untreated <strong>Water</strong> Supply and TransportUntreated <strong>Water</strong> Facilities - UpgradesMallard Slough Channel RehabilitationPriority: 2/3The purpose of this program is to enable the <strong>District</strong> to operate the Mallard Slough Pump Station asoriginally designed without operational restrictions due to suction water re-charge issues.The Mallard Slough is forty feet wide and twenty-five hundred feet long and was acquired by CCWDin 1961 to draw water from Suisun Bay to the Mallard Slough Pump Station in Bay Point. The<strong>District</strong> performed a bathymetric survey of the slough in October 2006 and determined there is fivefeet of sediment buildup since the last dredging in 1987 when the bottom of the slough was dredgedto seven and a half feet below mean sea level. The buildup of sediment can reduce the capacity of thepump station by up to 15 percent.This project will dredge the slough to its original design depth and remove the sediment spoils to adesignated disposal site, as well as re-shape the walls of the intake channel. The permitting phase ofthe project is Priority Level 2, and is scheduled to occur in FY2009 and FY2010. Design andconstruction are Priority Level 3, subject to funding availability.This project was included in the FY2008 CIP at a cost of $1,735,000. The cost has been adjusted toreflect a new cost estimate.Total Project: $3,300,000Cost to Date through FY2008: $0CIP Total: $3,300,000Cost Estimate Accuracy Range: $4,950,000 to $2,310,000 (+50%/-30%)Annual Cost Distribution (in 000's) and Schedule: Priority 2FY09 FY10 FY11 FY12 FY13 FY14 FY15 FY16 FY17 FY18$150 $130P P P P P P P PP = Planning D = Design C = Construction O = OtherAnnual Cost Distribution (in 000's) and Schedule: Priority 3FY09 FY10 FY11 FY12 FY13 FY14 FY15 FY16 FY17 FY18$253 $2,767D D D D D C C CP = Planning D = Design C = Construction O = OtherProject Funding: This project would be funded entirely by untreated water rates.Operational Impacts: Operational impacts for this project are expected to be minimalBasis for Priority: This project has been ranked priority level 3, as the project scope and schedulehave been defined only on a conceptual level.Budgeting Department/Division: Planning/EngineeringVII-40
CONTRA COSTA WATER DISTRICTTEN-YEAR CAPITAL IMPROVEMENT PLANPROJECT SUMMARY<strong>Program</strong>:Sub-<strong>Program</strong>:Project:Untreated <strong>Water</strong> Supply and TransportUntreated <strong>Water</strong> Facilities - UpgradesRock Slough Fish ScreenPriority: 1The purpose of this project is to provide support to Reclamation’s efforts to construct a fish screen atthe Rock Slough intake to the <strong>Contra</strong> <strong>Costa</strong> Canal. The fish screen is required by the Central ValleyProject <strong>Improvement</strong> Act (CVPIA) and the U.S. Fish and Wildlife Service’s Los Vaqueros ProjectBiological Opinion on Delta Smelt. The project is currently required to be completed by December2008. Reclamation has initiated discussions with the resource agencies to extend the deadline to2013.This project was included in the FY2008 CIP at a total project cost of $326,000. The cost includesstaff time that will be required during the design and construction of the fish screen.Total Project: $336,000Cost to Date through FY2008: $286,000CIP Total: $50,000Cost Estimate Accuracy Range: $361,000 to $321,000 (+50%/-30%)Annual Cost Distribution (in 000's) and Schedule:FY09 FY10 FY11 FY12 FY13 FY14 FY15 FY16 FY17 FY18$10 $10 $10 $10 $10O O O O O O O O O O O O O O O O O O O OP = Planning D = Design C = Construction O = OtherProject Funding: Under the CVPIA, the costs of the fish screen are to be shared among the federalgovernment (37.5%), the CVP (37.5%) and the State of California (25%). The <strong>District</strong> incurs ongoingcosts for staff time during planning, design and construction phases. <strong>District</strong> staff costs are entirelyuntreated water rate funded.Operational Impacts: It is assumed that the <strong>District</strong> would take responsibility for the operations andmaintenance of this federal facility, as it has for the <strong>Contra</strong> <strong>Costa</strong> Canal and related facilities. The<strong>District</strong>’s O&M costs are estimated to increase by $150,000 per year starting in FY2010 (first fullyear of operation). Labor costs account for two-thirds ($100,000) of this estimate.Basis for Priority: This project has been ranked as priority level 1 because it is part of the CVPIAand Los Vaqueros Project Delta Smelt Biological Opinion requirements. Continued pumping at RockSlough is dependent on meeting the requirements of the CVPIA.Budgeting Department/Division: PlanningVII-41
CONTRA COSTA WATER DISTRICTTEN-YEAR CAPITAL IMPROVEMENT PLANPROJECT SUMMARY<strong>Program</strong>:Sub-<strong>Program</strong>:Project:Untreated <strong>Water</strong> Supply and TransportUntreated <strong>Water</strong> Facilities - UpgradesRock Slough Flood <strong>Improvement</strong>sPriority: 2The purpose of this project is to ensure reliable delivery of untreated water by rehabilitating theunlined first four miles of the <strong>Contra</strong> <strong>Costa</strong> Canal against possible levee failure and subsequentflooding.The U.S. Army Corps of Engineers (COE) continues the evaluation of the Rock Slough project, andis moving the project to the cost sharing feasibility stage. The <strong>District</strong> has pursued funding assistancefrom the COE, and $4,300,000 was authorized under the <strong>Water</strong> Resources Development Act (WRDA205) authorization bill in late 2000. The <strong>District</strong> has been seeking appropriations from the COE, butadditional time is required for the COE to complete its assessment.The <strong>District</strong> has been working with the COE to integrate this flood mitigation project with the CanalReplacement Project to fund the proportionate flood control benefits realized by encasing the unlinedCanal up to Pumping Plant 1.This project was included in the FY2008 CIP at a total project cost of $6,847,000. The start of designhas been delayed by one year to accommodate additional COE studies.Total Project: $6,840,000Cost to Date through FY2008: $258,000CIP Total: $6,582,000Cost Estimate Accuracy Range: $10,131,000 to $4,865,000 (+50%/-30%)Annual Cost Distribution (in 000's) and Schedule:FY09 FY10 FY11 FY12 FY13 FY14 FY15 FY16 FY17 FY18$120 $165 $335 $2,987 $2,975P P P P D D D D D D D D C C C C C C C CP = Planning D = Design C = Construction O = OtherProject Funded: Feasibility study and design costs will be split equally between the COE and the<strong>District</strong>. Construction of the project is mainly funded by the COE (65%), with the <strong>District</strong> matching35%.Operational Impacts: The operational impact of this project is estimated to be negligible.Basis for Priority: This project is ranked as priority level 2 because it will ensure reliable delivery ofuntreated water.Budgeting Department/Division: EngineeringVII-42
CONTRA COSTA WATER DISTRICTTEN-YEAR CAPITAL IMPROVEMENT PLANPROJECT SUMMARY<strong>Program</strong>:Sub-<strong>Program</strong>:Project:Untreated <strong>Water</strong> Supply and TransportUntreated <strong>Water</strong> Facilities - UpgradesUntreated <strong>Water</strong> Facilities <strong>Improvement</strong> <strong>Program</strong>Priority: 2The purpose of this project is to improve operational reliability of the <strong>District</strong>’s untreated waterfacilities, many of which are over 65 years old and nearing the end of their useful life. The projectfocuses on rehabilitating canal system deficiencies in an effort to improve current operations andensure safe access to the <strong>Contra</strong> <strong>Costa</strong> Canal. <strong>Improvement</strong>s are identified and prioritized in theUntreated <strong>Water</strong> Facilities <strong>Improvement</strong> Plan.The project consists of such improvements as mechanical and electrical equipment, structures,instrumentation, geotechnical improvements, lateral, wasteway and check structure rehabilitation;untreated water corrosion activities; rehabilitation of damaged concrete canal lining section, roads,bridges and fences and the restoration of erosion damaged sites at various locations along the <strong>Contra</strong><strong>Costa</strong> Canal.Planned FY2009 and FY2010 work includes the elimination of flow restrictions in the canal loop andother work to prepare for a Shortcut Pipeline interior inspection.This program was included in the FY2008 CIP at a ten-year cost of $18,509,000. The cost has beenadjusted for inflation.Total Project:N/ACost to Date through FY2008:N/ACIP Total: $19,625,000Cost Estimate Accuracy Range: $29,438,000 to $13,738,000 (+50%/-30%)Annual Cost Distribution (in 000's) and Schedule:FY09 FY10 FY11 FY12 FY13 FY14 FY15 FY16 FY17 FY18$2,220 $2,665 $1,930 $1,830 $1,880 $1,880 $1,730 $1,730 $1,880 $1,880O O O O O O O O O O O O O O O O O O O O O O O O O O O O O O O O O O O O O O O OP = Planning D = Design C = Construction O = OtherProject Funding: This project is funded entirely by untreated water rates. The cost of the pumprehabilitation program will be offset by a reduction in operating budget.Operational Impacts: The operational impact of this project is estimated to be negligible. Thisproject improves operations and maintenance of the Canal and reduces water loss.Basis for Priority: This project has been ranked as priority level 2. The <strong>District</strong>’s untreated waterfacilities may be approaching the end of their useful life. The improvements made by this project willinsure a reliable system of operation and greater maintenance efficiency.Budgeting Department/Division: EngineeringVII-43
CONTRA COSTA WATER DISTRICTTEN-YEAR CAPITAL IMPROVEMENT PLANPROJECT SUMMARY<strong>Program</strong>:Sub-<strong>Program</strong>:Project:Untreated <strong>Water</strong> Supply and TransportUntreated <strong>Water</strong> Facilities - UpgradesUntreated <strong>Water</strong> Reservoir Rehabilitation <strong>Program</strong>Priority: 2/3The purpose of this project is to improve operational reliability of the <strong>District</strong>’s untreated waterreservoirs, some of which are over 60 years old, and address issues raised by the State of California,Division of Safety of Dams (DSOD) and the United States Bureau of Reclamation (USBR).Priority level 2 FY2009 and FY2010 improvements include installation of a staff gauge at <strong>Contra</strong>Loma Reservoir, completing an evaluation of the Mallard Reservoir outlet discharge to determine ifmodifications are needed to conduct outlet valve testing, and responding to requests from DSOD andUSBR. Priority 3 work includes additional dam erosion protection and site upgrades at MallardReservoir, and will be done as funds are made available.This project was included in the FY2008 CIP at a total cost of $11,919,000. The cost has beenadjusted to reflect an updated estimate.Total Project: $11,891,000Cost to Date through FY2008: $10,157,000CIP Total: $1,734,000Cost Estimate Accuracy Range: $12,758,000 to $11,370,000 (+50 %/- 30%)Annual Cost Distribution (in 000's) and Schedule: Priority Level 2FY09 FY10 FY11 FY12 FY13 FY14 FY15 FY16 FY17 FY18$202D D C CAnnual Cost Distribution (in 000's) and Schedule: Priority Level 3FY09 FY10 FY11 FY12 FY13 FY14 FY15 FY16 FY17 FY18$439 $1,093D D D D C C C CP = Planning D = Design C = Construction O = OtherProject Funding: This project is funded by untreated water rates.Operational Impacts: Operational impacts of this project are anticipated to be minimal. Increasingautomated dam monitoring instrumentation will decrease the cost of obtaining data, and increase thelevel of dam oversight through higher quality, faster data.Basis for Priority: This project has been ranked as priority level 2 because the <strong>District</strong> has amoderate level of control over the scope and implementation of this project.Budgeting Department/Division: EngineeringVII-44
CONTRA COSTA WATER DISTRICTTEN-YEAR CAPITAL IMPROVEMENT PLANPROJECT SUMMARY<strong>Program</strong>:Sub-<strong>Program</strong>:Project:Untreated <strong>Water</strong> Supply and TransportUpgradesUntreated <strong>Water</strong> Revenue Meter Data Logger ReplacementsPriority: 2The purpose of this project is to improve the accuracy and reliability of revenue metering sites ofmajor untreated water customers. The electrical power system and data collection/telemetryequipment are approaching the ends of their useful lives, and are becoming increasingly unreliable. Inaddition, the physical sites are in need of refurbishment. These meters account for annual revenues inexcess of $36 million.A data collection upgrade prototype is currently being field tested at two sites, using cellulartelemetry to directly communicate real-time revenue data, reducing the need for <strong>District</strong> staff tomanually read these meters. This project consists of installation of successful prototype systems at alltwenty-three remaining untreated water metering sites. The project also includes security, power, andsafety and access improvements at each site.This project is new to the CIP.Total Project: $2,010,000Cost to Date through FY2008: $0CIP Total: $2,010,000Cost Estimate Accuracy Range: $3,015,000 to $1,407,000 (+50 %/- 30%)Annual Cost Distribution (in 000's) and Schedule: Priority Level 2FY09 FY10 FY11 FY12 FY13 FY14 FY15 FY16 FY17 FY18$230 $1,780D D C C C C C CProject Funding: This project is funded by untreated water rates.Operational Impacts: Operational impacts of this project are anticipated to be minimal. Anyadditional operating cost, i.e., cellular costs, would be more than offset by decreased labor effort(equipment maintenance and meter reading), which would be re-directed to other activities.Basis for Priority: The project is ranked as priority level 2 because unreliable metering results ininequitable revenue collection.Budgeting Department/Division: EngineeringVII-45
<strong>Water</strong> Demand Reduction <strong>Program</strong>
CONTRA COSTA WATER DISTRICTTEN-YEAR CAPITAL IMPROVEMENT PLANPROJECT SUMMARY<strong>Program</strong>:Sub-<strong>Program</strong>:Project:<strong>Water</strong> Demand ReductionBest Management Practices Implementation<strong>Water</strong> Conservation IncentivesPriority: 1The purpose of this program is to reduce water demands by providing water conservation incentivesfor the Residential, Commercial/Industrial/Institutional and Landscape customer classes. Incentivesare consistent with the Future <strong>Water</strong> Supply Study (FWSS) and the Best Management Practices(BMP’s).The program includes incentives for the installation of efficiency toilets, clothes washers, smartirrigation timers and various commercial devices and irrigation equipment.This program was included in the FY2008 CIP at a ten-year cost of $7,043,000. Costs have beenadjusted for inflation, and to reflect changes in individual program elements.Total Project:N/ACost to Date through FY2008:N/ACIP Total: $8,010,000Cost Estimate Accuracy Range: $9,212,000 to $7,610,000 (+15%/-5%)Annual Cost Distribution (in 000's) and Schedule:FY09 FY10 FY11 FY12 FY13 FY14 FY15 FY16 FY17 FY18$801 $801 $801 $801 $801 $801 $801 $801 $801 $801O O O O O O O O O O O O O O O O O O O O O O O O O O O O O O O O O O O O O O O OP = Planning D = Design C = Construction O = OtherProject Funding: This project is funded by untreated water rates and supplemented with grant funds.Annual grant income is estimated to be $200,000.Operational Impacts: This project has no operational impact.Basis for Priority: This project has been ranked as priority level 1 because it is a BMP programrequired to be implemented in the Conservation Section of the <strong>District</strong>'s USBR <strong>Contra</strong>ct.Budgeting Department/Division: FinanceVII-46
CONTRA COSTA WATER DISTRICTTEN-YEAR CAPITAL IMPROVEMENT PLANPROJECT SUMMARY<strong>Program</strong>:Sub-<strong>Program</strong>:Project:Priority:<strong>Water</strong> Demand ReductionBest Management Practices ImplementationCommercial/Industrial ConservationN/AThe purpose of this program is to reduce water demands by providing conservation audits tocommercial customers to evaluate water uses on site and to provide suggestions for improved wateruse efficiency. The program also provides the pre-inspection at commercial establishments for thewater conservation incentive program.This is an operating budget program and is not included in program or CIP cost estimate totals. It isincluded here to provide a comprehensive picture of the <strong>District</strong>’s <strong>Water</strong> Demand Reductionprogram.This program was included in the FY2008 CIP at a ten-year cost of $1,508,000. The cost has beenadjusted for inflation.Total Project:N/ACost to Date through FY2008:N/ACIP Total: $1,550,000Cost Estimate Accuracy Range: $1,772,000 to $1,473,000 (+15%/-5%)Annual Cost Distribution (in 000's) and Schedule:FY09 FY10 FY11 FY12 FY13 FY14 FY15 FY16 FY17 FY18$155 $155 $155 $155 $155 $155 $155 $155 $155 $155O O O O O O O O O O O O O O O O O O O O O O O O O O O O O O O O O O O O O O O OP = Planning D = Design C = Construction O = OtherProject Funding: This program is funded by untreated water rates.Operational Impacts: This is an operating budget program. There are no O&M impacts beyondadministering the project.Responsible Department/Division: FinanceVII-47
CONTRA COSTA WATER DISTRICTTEN-YEAR CAPITAL IMPROVEMENT PLANPROJECT SUMMARY<strong>Program</strong>:Sub-<strong>Program</strong>:Project:Priority:<strong>Water</strong> Demand ReductionBest Management Practices ImplementationLandscape ConservationN/AThe purpose of this program is to reduce water demands by providing landscape surveys in businessparks, homeowner association’s common landscape areas, city parks and other areas that haveirrigation meters and large areas of turf. It also provides an annual follow-up to those surveyed sitesin order to assure continued savings. In addition, this program involves developing landscape waterbudgets for all dedicated irrigation accounts.This is an operating budget program and is not included in program or CIP cost estimate totals. It isincluded here to provide a comprehensive picture of the <strong>District</strong>’s <strong>Water</strong> Demand Reductionprogram.This program was included in the FY2008 CIP at a ten-year cost of $1,958,000. The cost has beenadjusted for inflation.Total Project:N/ACost to Date through FY2008:N/ACIP Total: $2,020,000Cost Estimate Accuracy Range: $2,320,000 to $1,920,000 (+15%/-5%)Annual Cost Distribution (in 000's) and Schedule:FY09 FY10 FY11 FY12 FY13 FY14 FY15 FY16 FY17 FY18$202 $202 $202 $202 $202 $202 $202 $202 $202 $202O O O O O O O O O O O O O O O O O O O O O O O O O O O O O O O O O O O O O O O OP = Planning D = Design C = Construction O = OtherProject Funding: This program is funded by untreated water rates.Operational Impacts: This is an operating budget program. There are no O&M impacts beyondadministering the project.Responsible Department/Division: FinanceVII-48
CONTRA COSTA WATER DISTRICTTEN-YEAR CAPITAL IMPROVEMENT PLANPROJECT SUMMARY<strong>Program</strong>:Sub-<strong>Program</strong>:Project:Priority:<strong>Water</strong> Demand ReductionBest Management Practices ImplementationResidential <strong>Water</strong> Audits/Plumbing RetrofitN/AThe purpose of this program is to reduce water demands by providing water audits to single-familyand multi-family residential customers. The Residential <strong>Water</strong> Audit <strong>Program</strong> works with <strong>District</strong>customers at their homes to improve water efficiency. Trained surveyors test for leaks in toilets,install showerheads and conduct comprehensive landscape water use evaluations. The <strong>Program</strong>makes water saving devices (showerheads, faucet aerators, etc.) available to customers free of charge.This is an operating budget program and is not included in program or CIP cost estimate totals. It isincluded here to provide a comprehensive picture of the <strong>District</strong>’s <strong>Water</strong> Demand Reductionprogram.This program was included in the FY2008 CIP at a ten-year cost of $3,397,000. The cost has beenadjusted for inflation.Total Project:N/ACost to Date through FY2008:N/ACIP Total: $3,500,000Cost Estimate Accuracy Range: $4,025,000 to $3,325,000 (+15%/-5%)Annual Cost Distribution (in 000's) and Schedule:FY09 FY10 FY11 FY12 FY13 FY14 FY15 FY16 FY17 FY18$350 $350 $350 $350 $350 $350 $350 $350 $350 $350O O O O O O O O O O O O O O O O O O O O O O O O O O O O O O O O O O O O O O O OP = Planning D = Design C = Construction O = OtherProject Funding: This program is funded by untreated water rates.Operational Impacts: This is an operating budget program. There are no O&M impacts beyondadministering the project.Responsible Department/Division: FinanceVII-49
<strong>Water</strong> Treatment Facility <strong>Improvement</strong>s <strong>Program</strong>
CONTRA COSTA WATER DISTRICTTEN-YEAR CAPITAL IMPROVEMENT PLANPROJECT SUMMARY<strong>Program</strong>:Sub-<strong>Program</strong>:Project:<strong>Water</strong> Treatment Facility <strong>Improvement</strong>sExpansionDrinking <strong>Water</strong> LaboratoryPriority: 3The purpose of this project is to enable the <strong>District</strong> to meet new, more stringent analyticalrequirements related to new regulations, potential new water supplies, and expanded outreach to ourmunicipal customers.The Facilities Master Plan (FMP) adopted by the Board on in 1999, recommended construction of anew 6,500 to 10,000 square foot laboratory adjacent to the Bollman <strong>Water</strong> Treatment Plant at a costof $2.6 to $6.0 million to provide additional space and state-of-the-art equipment. Due to fundingconstraints, the proposed project has been reduced to 5,000 square feet.Estimated annual operating costs and amortized capital costs of the laboratory are about equal to thecost of using commercial laboratories to perform the projected analysis. A cost-benefit analysiscomparing the use of commercial facilities versus constructing a <strong>District</strong> facility will be providedbefore project funding. The <strong>District</strong> has conducted significant outreach to municipal customers toprovide lab services to them at a competitive cost. While limited success has been achieved,sufficient additional work to justify lab expansion, based on this criterion alone, has not beengenerated. The outreach will continue.This project was included in the FY2008 CIP at a cost of $1,861,000. The cost has been adjusted forinflation, and the schedule has been delayed two years to allow for additional outreach.Total Project: $2,000,000Cost to Date through FY2008: $0CIP Total: $2,000,000Cost Estimate Accuracy Range: $3,000,000 to $1,400,000 (+50%/-30%)Annual Cost Distribution (in 000's) and Schedule:FY09 FY10 FY11 FY12 FY13 FY14 FY15 FY16 FY17 FY18$400 $1,600P P D D C C C CP = Planning D = Design C = Construction O = OtherProject Funding: This project is funded by treated water and untreated water rates.Operational Impacts: This project will increase the <strong>District</strong>’s analytical capability by providingstate-of-the-art equipment and a more efficient laboratory layout, ensuring the lab’s ability to meetnew and more stringent regulations. Any additional operating costs would be offset by the lessenedneed for outside laboratory services, and fees collected from other agencies using the lab.Basis for Priority: This project has been ranked as priority level 3 because the <strong>District</strong> has maximumflexibility in implementing this project.Budgeting Department/Division: Operations and MaintenanceVII-50
CONTRA COSTA WATER DISTRICTTEN-YEAR CAPITAL IMPROVEMENT PLANPROJECT SUMMARY<strong>Program</strong>:Sub-<strong>Program</strong>:Project:<strong>Water</strong> Treatment Facility <strong>Improvement</strong>sPlanning<strong>Water</strong> Treatment Plant Master Plan Update and Implementation PlaceholderPriority: 2The purpose of this project is to ensure timely, cost effective and environmentally soundimprovements to the <strong>District</strong>’s water treatment facilities through periodic updates of the FY2004<strong>Water</strong> Treatment Plant Master Plan (WTPMP). The WTPMP also provides a review of upcomingregulatory requirements possibly affecting the water treatment plants so the <strong>District</strong> can continue tobe proactive on regulatory compliance.The next plan update is scheduled for FY2013. This project also includes approximately $4,900,000for the implementation of improvements recommended by the study.This project was included in the FY2008 CIP at a cost of $4,757,000. The cost has been adjusted forinflation.Total Project: $5,100,000Cost to Date through FY2008: $0CIP Total: $3,983,000Cost Estimate Accuracy Range: $7,651,000 to $3,570,000 (+50%/-30%)Annual Cost Distribution (in 000's) and Schedule:FY09 FY10 FY11 FY12 FY13 FY14 FY15 FY16 FY17 FY18$210 $245 $882 $882 $882 $882P P P P D D D D C C C C C C C C C C C C C C C CP = Planning D = Design C = Construction O = OtherProject Funding: This <strong>District</strong>’s share of the project is funded by treated water rates. Partners in theRandall-Bold facility pay a share based on capacity rights.Operational Impacts: Plan updates do not have operational impact. Operational impacts for projectsrecommended in the plan will be evaluated as they are developed.Basis for Priority: This project has been ranked as priority level 2 because master plan updates arerequired to ensure that new regulations, capacity requirements, and other factors are addressed in atimely manner.Budgeting Department/Division: PlanningVII-51
CONTRA COSTA WATER DISTRICTTEN-YEAR CAPITAL IMPROVEMENT PLANPROJECT SUMMARY<strong>Program</strong>:Sub-<strong>Program</strong>:Project:<strong>Water</strong> Treatment Facility <strong>Improvement</strong>sUpgradesMembrane Filtration PlaceholderPriority: 3The purpose of this project is to ensure the <strong>District</strong>’s water quality objectives will continue to be metthrough advanced treatment process improvements. Future increases to water demands from theDelta, in the absence of definite projects to protect the <strong>District</strong> and other Bay Area users of Deltawater, will likely lead to degraded water quality. There is also a trend to increasing regulations toensure high quality water is delivered to urban water users. These regulations are targeting areas nowunregulated, including new viral, bacterial and protozoan pathogens, more stringent disinfection byproductregulations and regulations on currently unregulated chemicals. This trend also leads to anincreasing likelihood of a need for advanced treatment.If the State proceeds with options for the Delta that create degraded water quality at the <strong>District</strong>’sintakes, then the <strong>District</strong> must consider the potential need for the implementation of advancedtreatment technologies such as membrane filtration and multiple barriers (including multipledisinfectants, UV disinfection, and higher filtration levels). If implementation were deemednecessary, this project would be initiated in FY2012 with an estimated completion date in FY2015.This project was included in the FY2008 CIP at a total cost of $61,994,000. The cost has beenadjusted based on cost estimates for membrane filtration developed as part of the RegionalDesalination Feasibility Project.Total Project: $80,000,000Cost to Date through FY2006: $0CIP Total: $80,000,000Cost Estimate Accuracy Range: $120,000,000 to $56,000,000 (+50%/-30%)Annual Cost Distribution (in 000's) and Schedule:FY09 FY10 FY11 FY12 FY13 FY14 FY15 FY16 FY17 FY18$4,295 $39,529 $24,839 $11,337D D D D C C C C C C C C C C C CP = Planning D = Design C = Construction O = OtherProject Funding: This project would be funded by treated water rates.Operational Impacts: For purposes of planning, the total annual O&M costs are estimated to be$6.6 million per year, of which $160,000 is attributable to labor costs.Basis for Priority: This project has been ranked as priority level 3 because the <strong>District</strong> has maximumflexibility in implementing this project, and the outcome of the CALFED <strong>Program</strong> is uncertain.Budgeting Department/Division: PlanningVII-52
CONTRA COSTA WATER DISTRICTTEN-YEAR CAPITAL IMPROVEMENT PLANPROJECT SUMMARY<strong>Program</strong>:Sub-<strong>Program</strong>:Project:<strong>Water</strong> Treatment Facility <strong>Improvement</strong>sUpgrades<strong>Water</strong> Treatment Plant <strong>Improvement</strong>s - BollmanPriority: 2/3The purpose of this program is to continue meeting <strong>District</strong> water quality objectives by providing aprogrammatic approach to addressing water quality, renewal and replacement and solids handlingneeds at the <strong>District</strong>’s Bollman <strong>Water</strong> Treatment Plant (WTP). Bollman WTP was constructed in1968 and has facilities and equipment that are in need of renewal and replacement due to age andnormal wear and tear. Recommended improvements were identified in the FY2004 <strong>Water</strong> TreatmentPlant Master Plan (WTPMP).Projects planned for FY2009 and FY2010 include Sedimentation Basin and Clearwell Seismic<strong>Improvement</strong>s, Filter Valve Replacements and Polymer System Upgrades. There is a priority level 3placeholder project to implement any recommendations from the solids handling evaluation.The projects identified in this program were included in FY2008 CIP at a total cost of $30,620,000.The costs have been adjusted for inflation.Total Project: $31,787,000Cost to Date through FY2008: $15,917,000CIP Total: $15,870,000Cost Estimate Accuracy Range: $38,165,000 to $25,468,000 (+50%/-30%)Annual Cost Distribution (in 000's) and Schedule: Priority 2FY09 FY10 FY11 FY12 FY13 FY14 FY15 FY16 FY17 FY18$821 $2894 $2820 $755 $202 $755 $755 $755 $202 $755O O O O O O O O O O O O O O O O O O O O O O O O O O O O O O O O O O O O O O O OAnnual Cost Distribution (in 000's) and Schedule: Priority 3FY09 FY10 FY11 FY12 FY13 FY14 FY15 FY16 FY17 FY18$2,688 $2,468D D C C C C C CP = Planning D = Design C = Construction O = OtherProject Funding: This program is funded by treated water rates.Operational Impacts: The total operational impacts for this project are estimated to be $50,000 peryear beginning in FY2009. Labor costs account for $8,000 of the total costs.Basis for Priority: This program has been ranked as priority level 2 for components that have beendefined and priority level 3 for components that are pending the outcome of investigations.Budgeting Department/Division: PlanningVII-53
CONTRA COSTA WATER DISTRICTTEN-YEAR CAPITAL IMPROVEMENT PLANPROJECT SUMMARY<strong>Program</strong>:Sub-<strong>Program</strong>:Project:<strong>Water</strong> Treatment Facility <strong>Improvement</strong>sUpgrades<strong>Water</strong> Treatment Plant <strong>Improvement</strong>s - City of BrentwoodPriority: 2/3The purpose of this program is to provide a programmatic approach to addressing water quality,renewal and replacement, and solids handling needs at the City of Brentwood’s <strong>Water</strong> TreatmentPlant (CBWTP). The CBWTP is currently under construction and is expected to begin operation inFY2009. Per the agreement with the City of Brentwood for the design, construction, and operation ofCBWTP, the <strong>District</strong> has developed a capital improvement program for the new facilities.This project includes re-rating the filters to increase the plant’s capacity from 12 MGD to 15 MGD inFY2009 and media replacement. Filter media is assumed to be replaced on a four-year cyclebeginning in FY2012. There is a priority level 3 placeholder project to line the wash water lagoons ifrequired by the Regional <strong>Water</strong> Quality Control Board.The projects identified in this program were included in FY2008 CIP at a total cost of $2,316,000.The costs have been adjusted for inflation.Total Project: $2,558,000Cost to Date through FY2008: $0CIP Total: $2,558,000Cost Estimate Accuracy Range: $3,837,000 to $1,790,000 (+50%/-30%)Annual Cost Distribution (in 000's) and Schedule: Priority 2FY09 FY10 FY11 FY12 FY13 FY14 FY15 FY16 FY17 FY18110 $374 $363 $363 $363 $363O O O O O O O O O O O O O O O O O O O O O O O OAnnual Cost Distribution (in 000's) and Schedule: Priority 3FY09 FY10 FY11 FY12 FY13 FY14 FY15 FY16 FY17 FY18$96 $526D D D D C C C CP = Planning D = Design C = Construction O = OtherProject Funding: This program is funded by the City of Brentwood.Operational Impacts: The total operational impacts for this project are minimal.Basis for Priority: This program has been ranked as Priority level 2 for components that have beendefined and priority level 3 for components that are pending the outcome of investigations.Budgeting Department/Division: PlanningVII-54
CONTRA COSTA WATER DISTRICTTEN-YEAR CAPITAL IMPROVEMENT PLANPROJECT SUMMARY<strong>Program</strong>:Sub-<strong>Program</strong>:Project:<strong>Water</strong> Treatment Facility <strong>Improvement</strong>sUpgrades<strong>Water</strong> Treatment Plant <strong>Improvement</strong>s – Randall-BoldPriority: 2/3The purpose of this program is to continue meeting <strong>District</strong> water quality objectives by providing aprogrammatic approach to addressing water quality, renewal and replacement and solids handlingneeds at the <strong>District</strong>’s Randall-Bold <strong>Water</strong> Treatment Plant (WTP). Randall-Bold WTP wasconstructed in 1992 and has facilities and equipment that are in need of renewal and replacement dueto age and normal wear and tear. Recommended improvements were identified in the FY2004 <strong>Water</strong>Treatment Plant Master Plan (WTPMP).Projects included in this program include DCS replacement, filter media replacement, andgroundwater monitoring and alternatives analysis for lagoon operations at the site. There are prioritylevel 3 placeholder projects to line the wash water and solids lagoons if required by the Regional<strong>Water</strong> Quality Control Board, and to convert the plant to hypochlorite if required by Congress.The projects identified in this program were included in FY2008 CIP at a total cost of $12,192,000.The costs have been adjusted for inflation.Total Project: $13,073,000Cost to Date through FY2008: $4,081,000CIP Total: $8,992,000Cost Estimate Accuracy Range: $16,580,000 to $9,385,000 (+50%/-30%)Annual Cost Distribution (in 000's) and Schedule: Priority 2FY09 FY10 FY11 FY12 FY13 FY14 FY15 FY16 FY17 FY18$322 $166 $186 $226 $2,221 $761 $96 $96 $96 $96O O O O O O O O O O O O O O O O O O O O O O O O O O O O O O O O O O O O O O O OAnnual Cost Distribution (in 000's) and Schedule: Priority 3FY09 FY10 FY11 FY12 FY13 FY14 FY15 FY16 FY17 FY18$443 $2,493 $261 $1,529D D D D C C C C D D D D C C C CP = Planning D = Design C = Construction O = OtherProject Funding: A portion of this program is funded by Diablo <strong>Water</strong> <strong>District</strong>, City of Brentwood,and the City of Antioch. The remainder of the program is funded by treated water rates.Operational Impacts: The total operational impacts for this project are estimated to be $90,000 peryear beginning in FY2009. Labor costs account for $8,000 of the total costs.Basis for Priority: This program has been ranked as priority level 2 for components that have beendefined and priority level 3 for components that are pending the outcome of investigations orpotential legislation.Budgeting Department/Division: PlanningVII-55
CONTRA COSTA WATER DISTRICTTEN-YEAR CAPITAL IMPROVEMENT PLANPROJECT SUMMARY<strong>Program</strong>:Sub-<strong>Program</strong>:Project:<strong>Water</strong> Treatment Facility <strong>Improvement</strong>sUpgradesRandall-Bold <strong>Water</strong> Treatment Plant Upgrades for Increased CapacityPriority: 3Description: The purpose of this project is to upgrade the Randall-Bold <strong>Water</strong> Treatment Plant toincrease treatment capacity at the facility. A filter assessment study is currently underway todetermine if the plant’s filtration rates can be increased from 40 MGD to 54 MGD. If the results ofthe study indicate that capacity increases are feasible, additional upgrades for greater storage andhigher treatment capacity will be needed to meet the 35% production increase. Examples of upgradesneeded are additional chemical tanks and chemical feeders, higher waste discharge capacity, greatercapacity for solid waste handling, and modifications to influent piping to alleviate hydraulicconstrictions.A placeholder of $500,000 has been included in this CIP for implementation of projects necessary toincrease capacity at the Randall-Bold <strong>Water</strong> Treatment Plant. The project scope and costs will beupdated based on the results of the filter assessment study and as funding becomes available.This project is new to the CIP.Total Project: $500,000Cost to Date through FY2008: $0CIP Total: $500,000+Cost Estimate Accuracy Range: $750,000 to $350,000 (+50%/-30%)Annual Cost Distribution (in 000's) and Schedule:FY09 FY10 FY11 FY12 FY13 FY14 FY15 FY16 FY17 FY18$93 $407D D D D C C C CP = Planning D = Design C = Construction O = OtherProject Funding: This project would be funded by treated water rates and FRCs.Operational Impacts: Impacts to total annual O&M costs are anticipated to be negligible.Basis for Priority: This project has been ranked priority level 3, as the project scope and schedulehave been defined only on a conceptual level.Budgeting Department/Division: PlanningVII-56
Section VIIIEXHIBITS
List of AbbreviationsABAGBDCPBMPCCWDCEQACIICIPCOECTCCVPCVPIACUWCCDOHSDSODDWDDWREBMUDECCIDEIREISENREOCERAFETFMPFRCFTEFWSSFYGACGISJPALVPMGDM&IMOUMPPO&MOCAPPOE/POUPUCRBWTPAssociation of Bay Area GovernmentsBay Delta Conservation PlanBest Management Practice<strong>Contra</strong> <strong>Costa</strong> <strong>Water</strong> <strong>District</strong>California Environmental Quality ActCommercial, Industrial, and Institutional<strong>Capital</strong> <strong>Improvement</strong> <strong>Program</strong>United States Army Corps of EngineersCompetitive Transition ChargesCentral Valley ProjectCentral Valley Project <strong>Improvement</strong> ActCalifornia Urban <strong>Water</strong> Conservation CouncilCalifornia Department of Health ServicesCalifornia Division of Safety of DamsDiablo <strong>Water</strong> <strong>District</strong>California Department of <strong>Water</strong> ResourcesEast Bay Municipal Utility <strong>District</strong>East <strong>Contra</strong> <strong>Costa</strong> Irrigation <strong>District</strong>Environmental Impact ReportEnvironmental Impact StatementEngineering News RecordEmergency Operations CenterEducation Revenue Augmentation FundEvapo-transpirationFacilities Master PlanFacilities Reserve ChargeFull-Time EquivalentFuture <strong>Water</strong> Supply StudyFiscal <strong>Year</strong>Granular Activated CarbonGeographic Information SystemJoint Powers AuthorityLos Vaqueros ProjectMillion Gallons per DayMunicipal and IndustrialMemorandum of UnderstandingMulti-Purpose PipelineOperations and MaintenanceOperations Criteria and PlanPoint of Entry/Point of UsePublic Utilities CommissionRandall-Bold <strong>Water</strong> Treatment PlantVIII-1
List of Abbreviations(continued)RODSCADASRIPSWQTWTWFIPTWMPTWSAULFTUSBRUVUWUWFIPWQWRDAWRIFWTPWTPMPRecord of DecisionSupervisory Control and Data AcquisitionSeismic Reliability <strong>Improvement</strong> ProjectSafety and <strong>Water</strong> QualityTreated <strong>Water</strong>Treated <strong>Water</strong> Facility <strong>Improvement</strong> <strong>Program</strong>Treated <strong>Water</strong> Master PlanTreated <strong>Water</strong> Service AreaUltra-Low Flush ToiletUnited States Bureau of ReclamationUltra-violetUntreated waterUntreated <strong>Water</strong> Facility <strong>Improvement</strong> <strong>Program</strong><strong>Water</strong> Quality<strong>Water</strong> Resources Development Act<strong>Water</strong> Resources Investment Fund<strong>Water</strong> Treatment Plant<strong>Water</strong> Treatment Plant Master PlanVIII-2
GlossaryAcre-Foot – The volume of water that will cover one acre to a depth of one foot. One acre-footof water equals 325,828.8 gallons.Annual Rate Analysis – Rates, fees, and charges are examined annually and are brought to theBoard in November and December of each year, and adjustments are typically considered forBoard approval in January. CIP cost estimates are among several factors used in the annual rateanalysis.Bay Delta Conservation Plan - An applicant-driven effort to provide for the conservation andmanagement of Delta aquatic species and regulatory assurances related to water supply reliabilityand water quality. It is a voluntary mechanism to provide Delta water users compliance withFederal Endangered Species Act, California Endangered Species Act, and/or the NaturalCommunity’s Conservation Plan Act.CALFED - The California Bay-Delta Authority (formerly CALFED) oversees the 25 state andfederal agencies working cooperatively to improve the quality and reliability of California’swater supplies while restoring the Bay-Delta ecosystem.Central Valley Project – California water project owned by the United States and managed bythe Bureau of Reclamation for diversion, storage, carriage, distribution and beneficial use ofwaters of the Sacramento River, the American River, the Trinity River, and the San JoaquinRiver and their tributaries. The CVP is composed of some 20 reservoirs with a combinedcapacity of more than 11 million acre-feet, 11 power plants, and more than 500 miles of majorcanals and aqueducts. The CVP delivers about 7 million acre-feet of water annually foragricultural, urban, and wildlife use. The <strong>Contra</strong> <strong>Costa</strong> Canal is a CVP facility. CCWD’s CVPwater service contract is for 195,000 acre-feet annually.Central Valley Project <strong>Improvement</strong> Act - Multipurpose water legislation that was signed intolaw October 30, 1992. The Central Valley Project <strong>Improvement</strong> Act mandated changes inmanagement of the Central Valley Project, particularly for the protection, restoration, andenhancement of fish and wildlife. The Rock Slough Fish Screen is a requirement of the CVPIA.CIP <strong>Program</strong>s - Projects in the CIP are organized by program and sub-program. There are tenprogram areas, each representing a different function of the <strong>District</strong>. Sub-programs are groups ofrelated projects within a program.Debt Service – The <strong>District</strong>’s obligation to pay the principal and interest of bonds and other debtinstruments according to a predetermined payment schedule.Debt Service Coverage Ratio – Revenues net of operating costs divided by maximum annualdebt service.Delta – The Delta is the largest estuary on the west coast and the hub of California’s watersystem. It is formed by California’s two largest rivers, the Sacramento and San Joaquin. TheDelta has increasingly become a center of controversy as federal, state, and local governmentsand private entities have sought to make use of its resources.VIII-3
Delta Vision – Governor Arnold Schwarzenegger appointed the Delta Vision Blue Ribbon TaskForce to develop a long-term sustainable vision for the Delta by December 2007 and animplementation plan by October 2008. The task force recommended a significant increase inconservation and water system efficiency, new facilities to move and store water, and likelyreductions in the amount of water taken out of the Delta watershed. The task force alsorecommended a new governing structure for the Delta that would have secure funding and theability to approve spending, planning and water export levels.Facility Reserve Charge - A one-time up-front fee paid by each new customer when theyconnect to the system. The fee covers the new customer’s share of the facilities required toprovide service. Such fees are commonly referred to as connection fees, capacity fees, systemdevelopment fees, or impact fees. There are separate Facility Reserve Charges for untreated andtreated water customers. The current fees are contained in Chapters 5.12 and 5.16 of the <strong>District</strong>Code of Regulations.Fiscal <strong>Year</strong> - The period from and including July 1 of each calendar year through June 30 of thefollowing calendar year.Funded by Others – Funding received from non-<strong>District</strong> agencies or entities. Other sources offunding include CALFED, Proposition 50 and 84, grants, Brentwood, developers, and otherentities either benefiting from <strong>District</strong> actions or mitigating for impacts to the <strong>District</strong>.M&I Deficit - This M&I deficit was largely comprised of compound interest on capital costscomputed retroactively back to 1949. A large component of the deficit was eliminated by thepassage of two pieces of Federal legislation that resulted in the transfer of the Sly Park and SugarPine dams and reservoirs to the respective local beneficiary agencies.Minimum Reserve Balances – The <strong>District</strong> has a minimum reserve balance policy of the totalof six months of debt service and operating expenses.Operations Criteria and Plan – Plan developed by the Bureau of Reclamation for operation ofthe Central Valley Project in conjunction with the State <strong>Water</strong> Project. The plan includesnumeric and nonnumeric operating criteria and strategies for all CVP divisions, including theTrinity River Division, Shasta and Sacramento County Divisions, American River Division,Delta Division, West San Joaquin Division, and Friant Division.Prioritization System - A method to rank or rate the relative importance of a project in the CIPbased upon factors such as protection of health and safety, legal requirements and rate of returnon the <strong>District</strong>'s investment. The priority levels provide a basis for deciding which projectsshould be done in any given year.Priority Level 1 – Projects in this priority level are the highest priority of all capitalprojects. They include projects already under construction and those required bylegislation, regulation, contract or for protecting health and safety. Priority level 1 alsoincludes applicant funded projects.Priority Level 2 - Projects in this priority level need to be done, but the <strong>District</strong> has amoderate level of control as to when they should be performed. Where return onVIII-4
investment is a determining factor, projects in this priority level will have a short-termpayback of less than five years.Priority Level 3 - Projects in this priority level are needed, but the <strong>District</strong> has a significantlevel of control as to when they should be performed. Where return on investment is adetermining factor, projects in this priority level will have a long-term payback of greaterthan five years.Proposition 50 - Authorized general obligation bonds, to be repaid from state's General Fund, tofund a variety of water projects including: specified Bay-Delta <strong>Program</strong> projects including urbanand agricultural water use efficiency projects; grants and loans to reduce Colorado River wateruse; purchasing, protecting and restoring coastal wetlands near urban areas; competitive grantsfor water management and water quality improvement projects; development of river parkways;improved security for state, local and regional water systems; and grants for desalination anddrinking water disinfecting projects.Proposition 84 – Authorized $5.4 billion in general obligation bonds to fund projects to providesafe drinking water, improve local water supply reliability, strengthen flood protection, andpreserve California’s natural landscapes, including parks, lakes, rivers, beaches, bays, ocean andcoastline.Rate Policy – The Board’s rate policy limits annual rate increases to levels at or below inflation.Restricted Reserves – Reserve funds whose use is constrained by Board action or by contractualor legal requirements.Revenue – Moneys that the <strong>District</strong> receives as income. It includes such items as water sales,fees for services, contributions, interest income and other miscellaneous receipts. Estimatedrevenues are those expected to be collected over the panning period.<strong>Ten</strong>-<strong>Year</strong> <strong>Capital</strong> <strong>Improvement</strong> <strong>Program</strong> - The <strong>Ten</strong>-<strong>Year</strong> <strong>Capital</strong> <strong>Improvement</strong> <strong>Program</strong> andFinancial Plan (CIP) provides a comprehensive view of the asset investments required over thenext ten years to ensure adequate water resources, maintain high quality water, and meet theservice needs of present and future customers.Treated <strong>Water</strong> Service Area – Portion of the service area that receives treated water from the<strong>District</strong>'s Bollman <strong>Water</strong> Treatment Plant in Concord and supplemental supply from Randall-Bold Treatment Plant via the Multi-Purpose Pipeline. The treated water service areaencompasses all or part of the cities and communities of Concord, Clayton, Clyde, Pleasant Hill,Walnut Creek, Martinez, and Port <strong>Costa</strong>.Two-<strong>Year</strong> Budget - The <strong>District</strong>’s budget is presented to the Board in May and June every otheryear. Budget status is reviewed at approximately six-month intervals until the next two-yearbudget.Unrestricted Reserves – Reserve funds that are not constrained by Board action or bycontractual or legal requirements.VIII-5
Untreated <strong>Water</strong> Service Area – Portion of the <strong>District</strong>’s service area that receives untreatedwater from the <strong>Contra</strong> <strong>Costa</strong> Canal for municipal, industrial, landscape irrigation, andagricultural purposes. The <strong>District</strong>’s municipal customers include the Diablo <strong>Water</strong> <strong>District</strong>;Cities of Antioch, Pittsburg, and Martinez; and the Golden State <strong>Water</strong> Company (Bay Point).VIII-6
Section IXINDEX
IndexAlternative Intake Project…………...I-1, I-3, I-7, I-8, I-9, I-10, IV-5, IV-6, V-2, V-3, V-4, VI-1…………………………………………………………………..VI-8, VI-10, VI-16, VI-19, VII-4Annual Building and Facility <strong>Improvement</strong>s……………………………………....I-3, IV-3, VII-1Canal Replacement Project..............................I-5, I-8, IV-18, IV-19, IV-20, IV-21, VI-11, VI-15……………………………………………………………………...VI-19, VII-37, VII-38, VII-42CCWD/Brentwood <strong>Water</strong> Treatment Plant……………..I-4, I-7, I-8, I-9, IV-9, IV-10, V-1, V-2…………………………………………..V-3, V-4, V-5, VI-1, VI-9, VI-11, VI-16, VI-17, VII-14CCWD/Brentwood <strong>Water</strong> Treatment Plant Expansion………………….IV-9, IV-10, V-3, VII-15Commercial/Industrial Conservation………………………………………...............IV-22, VII-47Corrosion Control <strong>Program</strong>……………………………………………III-3, IV-16, IV-17, VII-21Country Club Pump Station Expansion………………………………...........IV-16, IV-17, VII-26Distribution Facilities……………………………..I-5, I-8, II-3, II-6, IV-15, IV-16, IV-17, VII-22<strong>District</strong>-Wide Geographic Information System………………………………………….I-4, VII-6Drinking <strong>Water</strong> Laboratory………………………………………………………….IV-25, VII-50Energy Demand Reduction <strong>Program</strong>………………………………………...I-3, IV-3, IV-4, VII-2Future <strong>Water</strong> Supplies Placeholder……………………………………...I-9, IV-11, IV-12, VII-17Future <strong>Water</strong> Supply Study Updates…………………………………………IV-11, IV-12, VII-16Land Acquisition and Real Property Management……………………...I-4, IV-13, IV-14, VII-19Landscape Conservation……………………………………………………..IV-22, IV-23, VII-48Lindsey Basin Communication Lines Relocation……………………………………...IV-8, VII-7Los Vaqueros Energy Recovery……………..I-5, I-6, I-8, IV-19, IV-20, IV-21, V-4, V-5, VII-34Los Vaqueros Pipeline Relocation-Balfour Road……………………………IV-20, IV-21, VII-39Los Vaqueros Recreation Facilities and Equipment………………………………...IV-13, VII-18Los Vaqueros Reservoir Expansion Project…………………………….I-1, I-3, IV-5, IV-6, VII-5Los Vaqueros <strong>Water</strong>shed <strong>Improvement</strong>s…………………………………………….IV-13, VII-20Mallard Slough Channel Rehabilitation……………………………………...IV-20, IV-21, VII-40Membrane Filtration Placeholder……………………...I-6, I-8, IV-24, IV-25, V-5, VI-19, VII-52Multi-Purpose Pipeline Pressure Sustaining Valve………………………………….IV-16, VII-23Pipeline Renewal and Replacements…………………………….I-5, IV-15, IV-16, IV-17, VII-24Port Chicago Pipeline Phase II…………………………………………..I-5, IV-16, IV-17, VII-25Randall-Bold <strong>Water</strong> Treatment Plant Upgrades for Increased Capacity……...IV-4, IV-25, VII-56Replacement of Fleet Vehicles and Heavy Equipment…………………………IV-7, IV-8, VII-13Replacement/Upgrade of Computer Systems…………………………...................I-4, IV-7, VII-8Replacement/Upgrade of Network Systems and Hardware……………………….I-4, IV-8, VII-9Replacement/Upgrade of Radio System Equipment……………………………….VII-10, VII-11Replacement/Upgrade of SCADA Equipment..………………………….III-3, IV-7, IV-8, VII-11Replacement/Upgrade of Telecommunications Equipment…………………………..IV-7, VII-12Residential <strong>Water</strong> Audits/Plumbing Retrofit………………………………...IV-22, IV-23, VII-49Rock Slough Fish Screen………………………………IV-20, IV-21, V-2, V-3, V-4, V-5, VII-41Rock Slough Flood <strong>Improvement</strong>s………………………………………………….IV-18, VII-42Solar Power Project……………………………………………..IV-3, IV-4, V-2, V-4, V-5, VII-3Subzone 34 Reservoir………………………………………………..........................IV-16, VII-28Treated <strong>Water</strong> Facilities <strong>Improvement</strong> <strong>Program</strong>………………………...I-5, IV-16, IV-17, VII-27Treated <strong>Water</strong> Reliability <strong>Improvement</strong>s…………………………………….IV-16, IV-17, VII-29IX-1
Treated <strong>Water</strong> Renewal/Replacement Study Update……………I-5, III-8, IV-15, IV-16, IV-17……………………………………………………………………………...VII-21, VII-24, VII-27Treated <strong>Water</strong> Reservoir Rehabilitation <strong>Program</strong>……………………….I-5, IV-16, IV-17, VII-30Treated <strong>Water</strong> Service Area Master Plan Update……………………………………IV-15, VII-31Untreated <strong>Water</strong> Applicant Funded Projects………………………………..V-2, V-4, V-5, VII-33Untreated <strong>Water</strong> Facilities <strong>Improvement</strong> <strong>Program</strong>………….I-5, IV-18, IV-19, IV-20, IV-21………………………………………………………………………………………VII-35, VII-43Untreated <strong>Water</strong> Facility <strong>Improvement</strong> Plan Update….......................................I-5, IV-18, VII-35Untreated <strong>Water</strong> Pipeline Placeholder………………………………………………………VII-36Untreated <strong>Water</strong> Revenue Meter Data Logger Replacements…………………..I-5, IV-19, VII-45Untreated <strong>Water</strong> Reservoir Rehabilitation <strong>Program</strong>…………………...III-4, IV-20, IV-21, VII-44<strong>Water</strong> Conservation Incentives…………………………………I-6, IV-22, IV-23, VII-46, VII-47<strong>Water</strong> Treatment Plant <strong>Improvement</strong>s – Bollman…………………I-6, IV-24, IV-25, V-2, VII-53<strong>Water</strong> Treatment Plant <strong>Improvement</strong>s – City of Brentwood…………....I-6, IV-24, IV-25, VII-54<strong>Water</strong> Treatment Plant <strong>Improvement</strong>s – Randall-Bold………………….I-6, IV-24, IV-25, VII-55<strong>Water</strong> Treatment Plant Master Plan Update and Implementation Placeholder...…………...VII-51IX-2