Full Study - Reason Foundation
Full Study - Reason Foundation
Full Study - Reason Foundation
- No tags were found...

You also want an ePaper? Increase the reach of your titles
YUMPU automatically turns print PDFs into web optimized ePapers that Google loves.
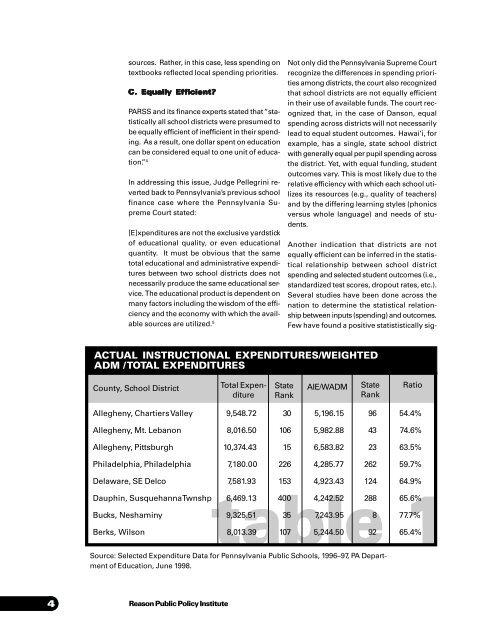
sources. Rather, in this case, less spending ontextbooks reflected local spending priorities.C. Equally Efficient?PARSS and its finance experts stated that “statisticallyall school districts were presumed tobe equally efficient of inefficient in their spending.As a result, one dollar spent on educationcan be considered equal to one unit of education.”4In addressing this issue, Judge Pellegrini revertedback to Pennsylvania’s previous schoolfinance case where the Pennsylvania SupremeCourt stated:[E]xpenditures are not the exclusive yardstickof educational quality, or even educationalquantity. It must be obvious that the sametotal educational and administrative expendituresbetween two school districts does notnecessarily produce the same educational service.The educational product is dependent onmany factors including the wisdom of the efficiencyand the economy with which the availablesources are utilized. 5Not only did the Pennsylvania Supreme Courtrecognize the differences in spending prioritiesamong districts, the court also recognizedthat school districts are not equally efficientin their use of available funds. The court recognizedthat, in the case of Danson, equalspending across districts will not necessarilylead to equal student outcomes. Hawai’i, forexample, has a single, state school districtwith generally equal per pupil spending acrossthe district. Yet, with equal funding, studentoutcomes vary. This is most likely due to therelative efficiency with which each school utilizesits resources (e.g., quality of teachers)and by the differing learning styles (phonicsversus whole language) and needs of students.ACTUAL INSTRUCTIONAL EXPENDITURES/WEIGHTEDADM / TOTAL EXPENDITURESCounty, School DistrictTotal ExpenditureStateRankAIE/WADMStateRankRatioAllegheny, Chartiers Valley 9,548.72 30 5,196.15 96 54.4%Allegheny, Mt. Lebanon 8,016.50 106 5,982.88 43 74.6%Allegheny, Pittsburgh 10,374.43 15 6,583.82 23 63.5%Philadelphia, Philadelphia 7,180.00 226 4,285.77 262 59.7%Another indication that districts are notequally efficient can be inferred in the statisticalrelationship between school districtspending and selected student outcomes (i.e.,standardized test scores, dropout rates, etc.).Several studies have been done across thenation to determine the statistical relationshipbetween inputs (spending) and outcomes.Few have found a positive statististically sig-Delaware, SE Delco 7,581.93 153 4,923.43 124 64.9%table 1Dauphin, Susquehanna Twnshp 6,469.13 400 4,242.52 288 65.6%Bucks, Neshaminy 9,325.51 35 7,243.95 8 77.7%Berks, Wilson 8,013.39 107 5,244.50 92 65.4%Source: Selected Expenditure Data for Pennsylvania Public Schools, 1996–97, PA Departmentof Education, June 1998.84<strong>Reason</strong> Public Policy Institute