Full Study - Reason Foundation
Full Study - Reason Foundation
Full Study - Reason Foundation
- No tags were found...

You also want an ePaper? Increase the reach of your titles
YUMPU automatically turns print PDFs into web optimized ePapers that Google loves.
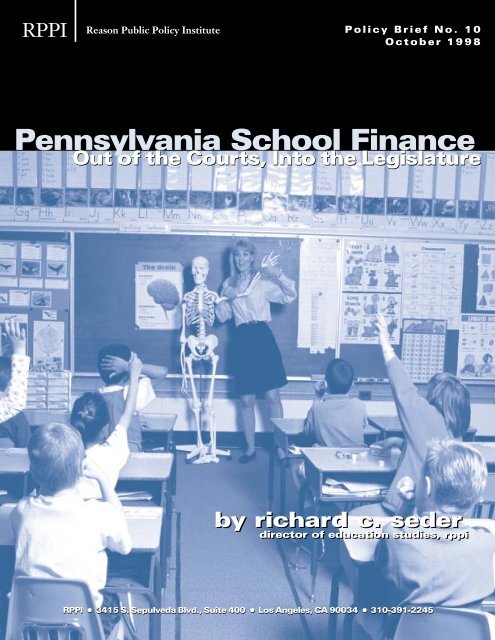
RPPI<strong>Reason</strong> Public Policy InstitutePolicy Brief No. 10October 1998Pennsylvania School FinanceOut of the Courts, Into the Legislatureby richard c. sederdirector of education studies, rppiRPPI l 3415 S. Sepulveda Blvd., Suite 400 l Los Angeles, CA 90034 l 310-391-2245
1EquityLawsuit1Major ComponentsofPARSS Ruling2Pennsylvania’sFunding Formulas7Pennsylvania’sFunding Future9Endnotescontentsabout RPPIRPPIThe <strong>Reason</strong> <strong>Foundation</strong> is a national researchand educational organization thatexplores and promotes the twin values ofrationality and freedom as the basic underpinningsof a good society. Since 1978,the Los Angeles-based foundation has providedpractical public policy research,analysis, and commentary based upon theprinciples of individual liberty and responsibilityand limited government.<strong>Reason</strong> Public Policy Institute (RPPI), a divisionof the <strong>Reason</strong> <strong>Foundation</strong>, fusestheory and practice to influence public policies.The Institute's research draws uponeconomics, science, and institutional analysisto critique public policies and advancenew policy ideas in a variety of policy areas,including education, infrastructure andtransportation, the environment, urbanland use and local economic development,social services, and privatization and governmentreform. To that analysis, the Institutebrings a political philosophy that supportsrule of law, marketplace competition,economic and civil liberty, personal responsibilityin social and economic interactions,and institutional arrangementsthat foster dynamism and innovation.The <strong>Reason</strong> <strong>Foundation</strong> is a tax-exempt educationalorganization as defined under IRScode 501(c)(3). The <strong>Reason</strong> <strong>Foundation</strong> neitherseeks nor accepts government funding,and is supported by individual, foundationand corporate contributions. Nothingappearing in this document is to be construedas necessarily representing theviews of the <strong>Reason</strong> <strong>Foundation</strong> or its trustees,or as an attempt to aid or hinder thepassage of any bill before any legislativebody.Photos used in this publication are Copyright© 1996. Photodisc, Inc. Copyright © 1998.<strong>Reason</strong> <strong>Foundation</strong>. All Rights Reserved.about the authorRichard C. Seder is the director of education studies for the <strong>Reason</strong> Public Policy Institute, a national public policyresearch organization. Mr. Seder has done extensive work in the area of quantitative and qualitative research on thestructure of educational systems; school choice programs; accountability issues; and the impact of expenditures onstudent achievement. Before joining RPPI, Mr. Seder worked as a research assistant to the executive director for theCato Institute in Washington, D.C., where he assisted in a study analyzing the relationship between public and privatepost-secondary institutions in three states. Prior to that, he was the recipient of a Charles G. Koch Fellowship throughthe Center of Market Processes examining the effects of immigration on the U.S. economy. Additionally, Mr. Seder hasserved as a project director for the Allegheny County School System in Pennsylvania, where he conducted extensive research on 43public school districts. Mr. Seder holds a Masters of Science in Public Policy and Management from the Heinz School at Carnegie MellonUniversity in Pittsburgh as well as a double bachelors degree in Government and Economics from Beloit College in Wisconsin.
Equity LawsuitThe Pennsylvania Association of Rural andSmall Schools (PARSS) filed suit againstthe Commonwealth of Pennsylvania in 1991claiming that the legislature failed in providinga “thorough and efficient” system of education.Their claim was based solely upon disparitiesin expenditures between school districts.Judge Dan Pellegrini handed down hisdecision on July 9, 1998 that the case was nonjudiciable,that because all school districts thattestified indicated that children in their districtswere receiving an adequate education, theCommonwealth was not in violation of constitutionalprovisions calling for a “thorough andefficient” system of public education. The courtnoted that all matters dealing with school financeare political matters and therefore arein the jurisdiction of the legislature.The court’s ruling mirrored previous court rulingschallenging the Pennsylvania school financesystem. Earlier in 1998, the CommonwealthCourt ruled similarly in Marrero v. Commonwealthof Pennsylvania that the Commonwealthwas in compliance with the state constitutionand that matters such as these fallinto the hands of the General Assembly. 1 Inthis case, the Philadelphia School Districtbrought suit against the Commonwealth claimingthat the funding system systemically discriminatedagainst the school district.The constitutionality of the Pennsylvania schoolfinance system was challenged once before andwas heard before the Pennsylvania SupremeCourt. In this case, plaintiffs sought equalized fundingacross school districts. The court ruled that itwas unable to judicially define what constituted a“normal program of educational services.” 2Major Components ofPARSS Ruling: Concen-tration on InputsA. Disparities in SpendingArguments against the Commonwealth ofPennsylvania centered on disparities in expendituresamong school districts. PARSS andits school finance experts contended that as longas differences in spending per child existed betweenschool districts, the Commonwealth wasnot meeting its constitutional obligation to providea “thorough and efficient” system of education.In comparing the per-pupil instructional expendituresbetween the five percent of school districtswith the lowest property wealth againstthe five percent of school districts with the highestproperty wealth, the statistical extremes,there was close to a $1,700 per child differencein spending for school year 1993-94 as presentedin the case (Figure 1).REGULAR PROGRAMS INSTRUCTION EXPENDITURESPER PUPIL (1993–1994)Rich$4,069.79PoorStatePhiladelphia$2,372.82$2,880.59$2,523.51Pittsburgh$3,618.85$0 $1000figure$2000 $3000 $4000 $50001Source: Judge Pellegrini Decision Memorandum, p. 48.pennsylvania school finance1
PARSS and its experts equated the $1,700spending difference to $1,700 less units ofeducation received by the students in thosepoorer districts.The Commonwealth countered this argumentby stating that comparing the bottom five percentand top five percent is comparing statisticalextremes. When all school districts werecompared, there were per-pupil instructionalspending variations between districts withsimilar property wealth characteristics, but theaverage per-pupil instructional expendituresbetween districts of differing property wealthwere not as extreme as PARSS made it appear.Only in the wealthiest (by property)school districts was there a large difference inthe mean per-pupil instructional expenditurescompared with the state as a whole (Figure2).However, when cost-of-living differences arefactored into district expenditures — takinginto account different housing costs as developedby the Panel on Poverty and Family Assistanceat the National Research Council —differences in school district spending withinsimilar property-wealth districts is smaller;the differences in school district spendingamong various property wealth districts issmaller; and there is tremendous overlap inspending among the various school districts,including the most property-wealthy districts(Figure 3).B. Local Spending PrioritiesComparing differences in expendituresamong school districts is problematic. A highspendingschool district does not necessarilyhave a higher “quality” educational programjust because of its higher overall expenditures.The plaintiffs in this case argued thatlower spending equated with a lower-qualityeducation.Judge Pellegrini concluded that the quality ofeducation was not directly related to spendinglevels. While more available funds allowedfor more spending options, JudgePellegrini concluded that setting spendingpriorities at the local level determined theACTUAL INSTRUCTIONAL EXPENSE (1993–94):SPENDING PER PUPIL$8,000Range of valueswithin 2 deviationsRange of valuesMeanOutliers$6,000$4,000$2,000figure 2Source: Judge Pellegrini Decsion Memorandum, p. 54.$01 2 3 4 5 6 7 8 9 10School Districts by Property Value Deciles82<strong>Reason</strong> Public Policy Institute
variation in educational programs (curriculum,class size, textbooks, facilities, technology)among school districts. Judge Pellegrinistated that “conditions in one representativedistrict cannot be applied to another becauseeach school district has different priorities: onedistrict may place a greater emphasis onschool facilities than on school books and computers;another places emphasis on retainingthe best possible staff causing them notto spend as much on facilities.“ 3 Therefore,spending decisions made by one school districtwere not generalizable across school districtswith similar characteristics much lessacross the 501 school districts in the Commonwealth.The ratio of Actual Instructional Expendituresto Total Expenditures shows varying spendingdecisions. Table 1 shows that differentdistricts allot different percentages of fundsto instructional programs as determined bytheir local spending priorities. Figures 2 and3 also illustrate spending variations amongsimilarly situated school districts.If school districts were making uniform spendingdecisions, we could expect state rankingsnot to change between total expenditures andactual instructional expenditures on a per studentbasis. Chartiers Valley School District,which ranks 30th in the state in terms of totalexpenditures, drops to 96th in the state anddevotes only 54.4 percent of its total expendituresto instructional expenditures. On the otherhand, Mount Lebanon School District movesfrom 106th in the state in total expenditures to43rd by devoting nearly 75 percent to actualinstructional expenditures. Again, the amountspent does not necessarily reflect the “quality”of education and does not take into account differentstudent populations served. Instead, thistable is intended to illustrate the varying spendingpriorities among school districts.Judge Pellegrini’s decision included the exampleof Southeast Delco School District, whichillustrates the sorts of spending decisions madeat the local level. PARSS argued that poorerschool districts could not afford textbooks.From school year 1993-94 to school year 1994-95, the average teacher’s salary increased by14 percent. During the same period, expendituresfor books and periodicals used for instructiondeclined by 48 percent. Inadequatetextbooks do not result from inadequate re-COST OF LIVING ADJUSTMENT (1993–94):PRICE-ADJUSTED TOTAL SPENDING PER PUPIL$8,000$6,000$4,000$2,000Range of valueswithin 2 deviationsRange of valuesMeanOutliersfigure 3Source: Judge Pellegrini Memorandum, p. 55.$01 2 3 4 5 6 7 8 9 10School Districts by Property Value Decilespennsylvania school finance 13
sources. Rather, in this case, less spending ontextbooks reflected local spending priorities.C. Equally Efficient?PARSS and its finance experts stated that “statisticallyall school districts were presumed tobe equally efficient of inefficient in their spending.As a result, one dollar spent on educationcan be considered equal to one unit of education.”4In addressing this issue, Judge Pellegrini revertedback to Pennsylvania’s previous schoolfinance case where the Pennsylvania SupremeCourt stated:[E]xpenditures are not the exclusive yardstickof educational quality, or even educationalquantity. It must be obvious that the sametotal educational and administrative expendituresbetween two school districts does notnecessarily produce the same educational service.The educational product is dependent onmany factors including the wisdom of the efficiencyand the economy with which the availablesources are utilized. 5Not only did the Pennsylvania Supreme Courtrecognize the differences in spending prioritiesamong districts, the court also recognizedthat school districts are not equally efficientin their use of available funds. The court recognizedthat, in the case of Danson, equalspending across districts will not necessarilylead to equal student outcomes. Hawai’i, forexample, has a single, state school districtwith generally equal per pupil spending acrossthe district. Yet, with equal funding, studentoutcomes vary. This is most likely due to therelative efficiency with which each school utilizesits resources (e.g., quality of teachers)and by the differing learning styles (phonicsversus whole language) and needs of students.ACTUAL INSTRUCTIONAL EXPENDITURES/WEIGHTEDADM / TOTAL EXPENDITURESCounty, School DistrictTotal ExpenditureStateRankAIE/WADMStateRankRatioAllegheny, Chartiers Valley 9,548.72 30 5,196.15 96 54.4%Allegheny, Mt. Lebanon 8,016.50 106 5,982.88 43 74.6%Allegheny, Pittsburgh 10,374.43 15 6,583.82 23 63.5%Philadelphia, Philadelphia 7,180.00 226 4,285.77 262 59.7%Another indication that districts are notequally efficient can be inferred in the statisticalrelationship between school districtspending and selected student outcomes (i.e.,standardized test scores, dropout rates, etc.).Several studies have been done across thenation to determine the statistical relationshipbetween inputs (spending) and outcomes.Few have found a positive statististically sig-Delaware, SE Delco 7,581.93 153 4,923.43 124 64.9%table 1Dauphin, Susquehanna Twnshp 6,469.13 400 4,242.52 288 65.6%Bucks, Neshaminy 9,325.51 35 7,243.95 8 77.7%Berks, Wilson 8,013.39 107 5,244.50 92 65.4%Source: Selected Expenditure Data for Pennsylvania Public Schools, 1996–97, PA Departmentof Education, June 1998.84<strong>Reason</strong> Public Policy Institute
nificant relationship between spending andstudent outcomes. 6 The commonwealth’sschool finance expert examined the relationshipbetween district spending and studentscores on the 1991 statewide Testing for EssentialLearning and Literary Skills (TELLS)test. When controlling for socioeconomic statusand student ability, he found no significantrelationship between spending and studentperformance on tests. Put very simply,spending more money does not necessarilyequate to higher student achievement.Pennsylvaniaennsylvania’s ’s SchoolFunding FormulasIn reviewing Pennsylvania’s school financeprogram, one cannot help but notice thechanging nature in which the commonwealthfunds public elementary and secondary education.Since school year 1991-92, Pennsylvaniahas changed the way it has funded publicschools five times.A. ESBE Formula (1983-84 to1991-92)The amount of aid received by school districtsunder the Equalized Subsidy for Basic Education(ESBE) was determined by: an aid ratio(MV/PI ratio) which is determined as a measureof a district’s wealth— total market valueof property and personal income of residents;the district’s weighted average daily membership(WADM) ;7 and the Factor of EducationalExpense (FEE), the maximum amounta district could receive per student—determinedto be $2,250 by the General Assemblyin 1991-92. A school district received the totalof its MV/PI ratio multiplied by the FEE,multiplied by the district’s WADM.The ESBE formula also took into account factorssuch as sparsely populated districts, districtswith large populations of children fromlow incomes, and districts with above averagetax efforts yet considered low wealth. TheESBE formula focused on equity and was designedto send a higher proportion of statefunds to districts with the least wealth.B. Funding Freeze (1992-93)The General Assembly suspended the use ofthe ESBE formula for educational funding forelementary and secondary schools and allottedschool districts the same amount of fundsas they received in school year 1991-92.C. <strong>Foundation</strong> Equity Supplement(1993-95)Under the foundation approach, each schooldistrict was required to make a minimum localtax effort of 19.5 mills on the 1990 market valueof property. The minimum expenditure levelper student in every district was $3,875 forschool year 1993-94 and increased to $4,700per student for school year 1994-95. However,each school district was guaranteed to receiveat least the same amount of funds as it receivedin the previous school year under thefrozen ESBE formula.The foundation approach also included supplementsfor poverty, district growth, and limitedrevenue availability. Districts were also guaranteeda minimum increase in funding withthe poorest districts (those with aid ratios ofgreater than 0.700) receiving a 1.5 percentminimum increase, those with ratios between0.500 and 0.700 receiving a 1.25 percent increase,and all others receiving a minimum 1percent increase. Included in the foundationapproach were three funding supplements:constantly changing formulas forfunding causes confusionpennsylvania school finance15
poverty, growth, and the limited revenuesource supplements.Under the poverty supplement, districts with35 percent or more of students from familiesreceiving Aid to Families with Dependent Children(AFDC) received $100 per ADM (1993-94) and increased to $120 per ADM (1994-95).The growth supplement, designed to aid districtswith rapidly growing student populations,allotted $400 per ADM for districts with 4.5percent growth, $225 per ADM for districtswith less than 4.5 percent growth.Under the limited revenue source supplement,districts with aid ratios of greater than 0.700that did not receive any other forms of supplementreceived $77.50 per ADM.D. Flat Increase (1995-96)Districts received a three-percent increaseper ADM from the state during 1995-96. Twosupplements aided school districts: minimumincrease (four percent for districts with aidratios of greater than 0.700, two percent fordistricts with aid ratios of between 0.500 and0.700, and one percent for districts with aidratios of below 0.500); and small district assistance($95 per ADM for any school district withan aid ratio of 0.500 and greater and ADM of1,500 or fewer). State expenditures for basiceducation totaled nearly $3.4 billion.E. No Increase (1996-97)From 1996-97, there was no increase in theamount of state aid to school districts regardlessof change in district characteristics (wealthor student populations). Total expenditures forpublic education — local and state funds forall functions — totaled $13.747 billion.Pennsylvaniaennsylvania’s ’s SchoolFunding FutureJudge Pellegrini determined that thePARSS case was non-judiciable, consistentwith Marrero (1998) and Danson (1979),that found that matters involving school fundingare issues left to the legislature. Educationis a state function that is locally administeredby school districts. The legislature, therefore,has the responsibility of structuring aneducation system that is understood by thecitizens of Pennsylvania and the school districts,while being accountable to systemstakeholders such as parents and taxpayers.A. Consistency and ContinuityThe volatile nature of state funding from 1991to the present makes it difficult for school districtsto plan into the future. The uncertaintyinherent in the current system may lead districtboards and administrators to focus solelyon near-term investments rather than on longtermplanning. Also, interviews with schooldistrict board members and administratorsgenerated many different answers whenasked to describe the state funding system. 8When compared to the various fundingmechanisms used by the state, all responseswere correct in one form or another, but somewere incorrect at the particular point in time.Constantly changing formulas for fundingcauses confusion. Pennsylvania’s legislatorsshould decide on a funding mechanism (continuancewith ESBE base or through the developmentof a new funding system) and staywith it. Consistency and continuity areneeded in order for the public to better understandhow their schools are funded andfor district personnel to better plan into thefuture.“content or subject knowledge seemsnot be central to the selection process”86<strong>Reason</strong> Public Policy Institute
B. AdequacyIn Marrero, the Commonwealth Court ruledthat “this court is likewise unable to judiciallydefine what constitutes an ‘adequate’ educationor what funds are ‘adequate’ to supportsuch a program. These are matters which areexclusively within the purview of the GeneralAssembly’s powers... 9 ”While not a single school district administratortestified to having inadequate resourcesto provide an educational program in thePARSS case, the General Assembly would bewise to investigate and determine best-practicesbenchmarks regarding costs. The ESBEformula tried to approximate the cost of providingan education. However, since then themethod in which Pennsylvania funds its publicschools has followed expenditures-drivenand flat-increase models without best practicesbenchmarking. Understanding the relativecosts of providing an education and thevarious equity considerations (e.g. low-incomefamilies, sparse populations, etc.) willprovide a basis from which to allocate funds,while letting individual districts decide howbest to serve their student populations.C. AccountabilityOne way of assuring that districts pursue educationalprograms appropriate for their studentpopulations is by developing an accountabilitysystem that works in conjunction withthe finance system. To date, school districtshave not been held accountable for the fundsbeing spent on behalf of the public. Pennsylvaniadoes not need to create a statewidecurriculum to thoroughly assess the performanceof school districts. Establishing cleargoals and objectives, through objective stateacademic standards or through performanceassessments, and allowing districts the flexibilityto meet those goals and objectives asthey see fit would solidify the public educationsystem in Pennsylvania. Pennsylvania continuesto revise its standards in the core subjectsof math and English.D. ProductivityIn 1996-97, Pennsylvania spent $6,708 per student,ranking sixth in the nation and nearly$1,000 above the national average of $5,787. 10This represents a 20 percent increase in expendituresfrom 1986. Pennsylvania schoolsdevote 64.4 percent of expenditures (excludingcapital outlays and interest on debt) to instruction,ranking ninth in the nation and abovethe national average of 61.7 percent.Pennsylvania ranks in the top ten states in educationspending, yet Pennsylvania studentsperform at or near the national averages onthe National Assessment of EducationalProgress (NAEP) math and reading tests. Twentypercent of fourth-grade students performed atleast at the “proficient” level, 48 percent at the“basic” level, and 32 percent at the “belowbasic” level on the 1996 NAEP math test. 11 Thisranks 22nd in the nation. Thirty percent of fourthgradersscored at least at the “proficient” levelon the 1994 NAEP reading test, above the nationalaverage of 28 percent. 12Students graduating from Pennsylvania highschools in 1994 enrolled in two and four-yearcolleges at a lower rate than the national average,57 percent compared to 62 percent. 13One explanation for such modest school productivityis the selectivity of Pennsylvaniaschool districts in hiring teachers. A recentstudy by Dr. Robert Strauss, from CarnegieMellon University, shows that “there is widevariation in the content knowledge test scoresamong Pennsylvania’s teacher preparationspending more money does not necessarilyequate to higher student achievementpennsylvania school finance 17
programs. Given that passing scores are quitelow, around the 10th or 20th percentile andoften representing very low fraction of correct,weighted scores, this means that there isa large pool of highly variable quality certifiedteachers from which districts make employmentdecisions.” 14 Strauss follows by criticizingthe hiring practices of some Pennsylvaniaschool districts. One criticism shows that “writtenhiring procedures are absent in about halfof the districts; content knowledge or subjectknowledge seems not be central to the selectionprocess.” 15 Again, the quality of selectionprocess and subsequent quality of teachersvaried across school districts regardless of districtwealth.E. Governance and StructureFinally, additional funding into the current educationalsystems may not yield educationalimprovements without changing the structureand governance models in most of the 501school districts in Pennsylvania. Most districtscontinue to have centralized decisionmakingbodies (districts) with little decisionmaking atthe school site. In those districts that havesite-based management, many provide littleto no budget authority to the school site. 16Currently, above-average expenditures yieldaverage results, both in the elementary schoolyears and at the end of the K-12 schooling period.Changing the structure of decision-makingin school districts requires a change in rolesand responsibilities. School districts mustcomply with state and federal regulations andmandates, at the same time ensuring thatschools are in compliance along with additionaldistrict regulations and mandates. A changein governance structure necessitates a changein school and district personnel functions.District administrators, in a decentralized system,move from the role of compliance officersto information providers and facilitators.Site-based management requires schools tomake decisions regarding budget allocations,staffing, training, curriculum development, etc.With additional responsibility and authoritycomes additional accountability. The centraldistrict provides continuous information andfeedback to the school site. Effective devolutionof responsibilities requires informationsharing across the organization. This informationshould also be shared with parentsand the community to gauge the effectivenessof the schools.Effective change of governance does not happenovernight. Training of district and schoolpersonnel is required in order to understandnew roles and responsibilities. Governancechange also requires a change in teacher andadministrator preparation programs. Skillssuch as budgeting, scheduling, and curriculumdevelopment are needed by incomingteachers and administrators in order to meetthe needs of the changing organizations. Theroles and responsibilities of the state mustalso change, moving from regulators to informationproviders while holding school districtsaccountable. 17 A change in school governancealso requires a change in other traditional institutionssuch as collective bargaining agreementsand purchasing of services such as foodservice and supplies. These decisions, typicallymade at a level away from the schoolsite, should be reconsidered with new modelsof governance.There is not a single model of governance thatis best for all school districts. Each district mustdevise a governance structure that best meetsthe local needs of its children. The change ingovernance must center on the goals and objectivesof educating children. School districtsmust see this as a continuous improvementproject, learning from past experiences andmaking adjustments as needed.What is not known is the governance structurethat each school district will undertake tobetter educate the children of Pennsylvania.However, utilizing the existing managementsystems for school districts will most likely leadto increased investments through spendingwith no increase in student performance. 18 ❖8<strong>Reason</strong> Public Policy Institute
1 Marrero v. Commonwealth of Pennsylvania,709 A. 2d 956 (Pa. Cmwlth. 1998).2 Danson v. Casey, 484 Pa. 415, 399 A. 2d360 (1979).3 Memorandum Opinion by Judge DanPellegrini, Filed July 9, 1998, p. 67.4 Memorandum Opinion by Judge DanPellegrini, Filed July 9, 1998, p. 49.5 Memorandum Opinion by Judge DanPellegrini, Filed July 9, 1998, p. 128, quotedfrom Danson, 484 Pa. At 427, 399 A.2d at366.6 James S. Coleman, Equality of EducationalOpportunity, Volume I and II, United StatesDepartment of Health, Education and Welfare,1966, Eric Hanushek, “The Economicsof Schooling: Production and Efficiencyin Public Schools,” Journal of EconomicsLiterature, vol. 24, no. 3, pp. 1141-1177.7 Average Daily Membership is the sum ofthe district’s enrollment count for each dayof session divided by the number of daysin the school year. Weighted ADM is determinedby assigning the relative cost ofeducating students at various stages oftheir education: half-day kindergarten isweighted as 0.5, full-time kindergartenand elementary school as 1.0, and secondarystudents as 1.36.8 Allegheny County Public Schools SystemsProject, H. John Heinz III School of PublicPolicy and Management, Carnegie MellonUniversity, August 1996-May 1997. Interviewswith school districts in AlleghenyCounty, Pennsylvania.9 Marrero v. Commonwealth of Pennsylvania,709 A. 2d 956 (Pa. Cmwlth. 1998).10 U.S. Department of Education, NationalCenter for Education Statistics, “Public Elementaryand Secondary Education Statistics:School Year 1996-97,” July 1997.Figures are “current” expenditures, whichexclude spending for capital outlays andinterest on debt, and adjusted using theNational Center for Education Statistics“cost-of-education” index.11 U.S. Department of Education, NationalCenter for Education Statistics, “NAEP 1996Mathematics Report Card for the Nationand the States,” February 1997.12 U.S. Department of Education, NationalCenter for Education Statistics, “NAEP 1994Reading Report Card for the Nation andthe States,” January 1996.13 National Education Goals Panel, “The NationalEducation Goals Report: Building aNation of Learners,” November 1996, andU.S. Department of Education, NationalCenter for Education Statistics, “The Conditionof Education,” June 1996.14 Robert P. Strauss, Lori L. Bowes, Mindy S.Marks, and Mark R. Plesko, “Who ShouldTeach in Our Public Schools? Implicationsof Pennsylvania’s Teacher Preparation andSelection Experience,” paper for AmericanEducation Finance Association, March 10,1998, p. 26.15 Robert P. Strauss, Lori L. Bowes, Mindy S.Marks, and Mark R. Plesko, “Who ShouldTeach in Our Public Schools? Implicationsof Pennsylvania’s Teacher Preparation andSelection Experience,” paper for AmericanEducation Finance Association, March 10,1998, p. 26.16 Allegheny County Public Schools SystemsProject, H. John Heinz III School of PublicPolicy and Management, Carnegie MellonUniversity, August 1996-May 1997. Interviewswith school districts in AlleghenyCounty, Pennsylvania.17 Pennsylvania School Boards Association,White Paper on Relief from Mandates,March 1997.18 Allan Odden and Carolyn Busch, FinancingSchools for High Performance: StrategiesFor Improving the Use of Educational Resources,Jossey-Bass, San Francisco(1998), p. 22.endnotes19
<strong>Reason</strong> Public Policy Institute [RPPI]3415 S. Sepulveda Blvd., Suite 400 l Los Angeles, CA 90034310-391-2245 l 310-391-4395 [fax]www.reason.org