n-1 Reliability Example - Idaho Power
n-1 Reliability Example - Idaho Power
n-1 Reliability Example - Idaho Power

You also want an ePaper? Increase the reach of your titles
YUMPU automatically turns print PDFs into web optimized ePapers that Google loves.
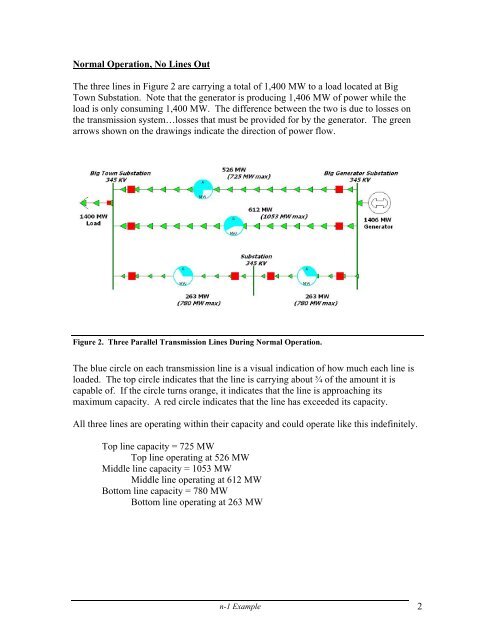
Normal Operation, No Lines OutThe three lines in Figure 2 are carrying a total of 1,400 MW to a load located at BigTown Substation. Note that the generator is producing 1,406 MW of power while theload is only consuming 1,400 MW. The difference between the two is due to losses onthe transmission system…losses that must be provided for by the generator. The greenarrows shown on the drawings indicate the direction of power flow.Figure 2. Three Parallel Transmission Lines During Normal Operation.The blue circle on each transmission line is a visual indication of how much each line isloaded. The top circle indicates that the line is carrying about ¾ of the amount it iscapable of. If the circle turns orange, it indicates that the line is approaching itsmaximum capacity. A red circle indicates that the line has exceeded its capacity.All three lines are operating within their capacity and could operate like this indefinitely.Top line capacity = 725 MWTop line operating at 526 MWMiddle line capacity = 1053 MWMiddle line operating at 612 MWBottom line capacity = 780 MWBottom line operating at 263 MWn-1 <strong>Example</strong> 2