Download - Thoresen Thai Agencies PCL
Download - Thoresen Thai Agencies PCL
Download - Thoresen Thai Agencies PCL
- No tags were found...

Create successful ePaper yourself
Turn your PDF publications into a flip-book with our unique Google optimized e-Paper software.
TTA: New Business GroupsTransport Energy Infrastructure• Dry Bulk ShippingOperations Owner‐operator of 35 ownedand 3 long term time charteredinvessels. Fleet renewal plan is firm with 5new handymax vessels. Deliverydate ranging from Q1 2010 to Q22012. Total asset size 1 of Bt28.8 billion.• Shipping ServicesCompanies A network of ship agency andship brokerage companies inAsia and the Middle East. Total asset size 1 of Bt2 billion.• Mermaid Maritime PLC. Listed on the Singapore Stock Exchange. Owner‐operator of 5 vessels and timechartererof 2 offshore service vessels viaMermaid + 2 more from affiliate AME. Subsea fleet renewal plan remains firmwith 3 new vessels delivering in 2010. Owner‐operator of 1 new build + 2tender drilling rigs. Total asset size 1 of Bt13.3 billion.• MertonNote 1 : Data as of 30 Jun 2009; 2 : Data as of 30 September 2009; 3 Data as of 31 July 2009 Holder of 13,000 hectares of coalexploration area in Cebu, Philippines. A “mine‐able reserve” of 0.8 million toover 2 million tonnes was estimated oninitial sample drilling of 45 hectares . First commercial drilling is expected tobegin in 2Q 2010.6• UMS A public listed company in <strong>Thai</strong>landthat specialises in logistics for the coalindustry in <strong>Thai</strong>land. UMS currently imports more than 1million tonnes of coal into <strong>Thai</strong>land,reclassifies them bf before transporting tomore than 400 SMEs on a “just‐intime”basis. Total asset size 2 of Bt2.99 Billion.• Baconco A fertiliser plant that is located in PhuMy 1 Industrial Zone, about 50m awayfrom Baria Serece Port in Vietnam This proximity to the port andextensive warehouse facilities allowfor professional logistics serviceswhich will be fully marketed at thebeginning of 2010. Total asset size 3 of Bt 0.8 billion.
HK000NDCUMS’s Company Profile &Operations
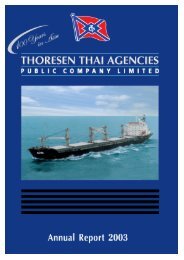
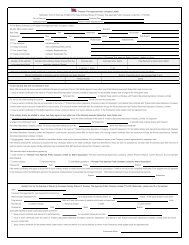
UMS’s Operation Procedures and DeliveryServicesCoals fromIndonesiaDirectly send coals to customersVesselsSi ChangIslandLightersUMS’s Jetty atSuan SomBelt ConveyorsSuan SomWarehousequality adjustmentCustomersquality adjustmentUMS’s Jettyat Nakorn LuangTrucksNakorn LuangWarehouseCustomersDirectly send coals to customers12
HK000NDCUMS’s Industry Outlook &Business Plans
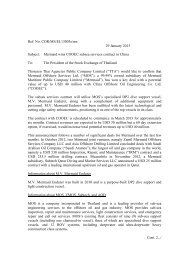
Rising Demand for Imported CoalImported CoalQuantity y( (ʹ000 tons)18,00016,00014,00012,00010,0008,0006,0004,0002,0000Value (million Baht)40,00035,00030,00025,00020,00015,00010,0005,000019861987198819891990199119921993199419951996199719981999200020012002200320042005200620072008Source: www.eppo.co.th‐QUANTITY(1,000 TONS)‐VALUE(MILLION BAHTS)Type of CoalType of Coal Calorific Value Moisture Ash Sulphur(kcal/kg) (%)* (%)* (%)Anthracite 6,500‐8,000 5‐8 5‐12 0.1‐1.0Bituminous 5,500‐6,500 8‐15 1‐12 0.1‐1.5**Sub‐bituminous 4,500‐5,500 24‐30 1‐10 0.1‐1.5**Lignite 3,000‐4,000 30‐38 15‐20 2.0‐5.0* Percentage by weight** 1% of sulphur world produce sulphur dioxide approximately 500 ppm. (According to UMS’s bituminous and sub‐bituminous coal)Source: UMS15
Higher Growth in Coal Consumption of the<strong>Thai</strong> Industrial SectorCoal Consumption Quantity Growth (%)2007 2008Lignite Consumption 18.11 18.53 2.3‐ Electricity Generation (EGAT) 15.81 16.41 3.8‐ Industry 2.30 2.12 ‐7.5Coal Consumption 14.41 15.98 10.9‐ Electricity Generation e (SPP and dI IPP*) 5.43 5.05 ‐7.1.‐ Industry 8.98 10.93 21.8Total Demand 32.52 34.51 6.1* SPP and IPP are Small Power Producer and Independent Power Producer, respectively.Source: Energy Policy and Planning Office, Ministry of Energy16
Low Consumption per Capita Allowing forPotential GrowthRank Country Coal ConsumptionNo of populationCoal consumption per(ʹ000 tonnes)capita (kg/capita)1 Australia 157,275 20,434,176 7,6972 Greece 71,220 10,706,290 6,6523 Czech Republic 60,543 10,228,744 5,9194 Kazakhstan 80,630 15,284,929 5,2755 South Africa 206,395 43,997,828 4,6916 Poland 157,651 38,518,241 4,0937 United States 1,121,714 301,139,947 3,7258 Germany 271,066 82,400,996 3,2909 Taiwan 71,268 22,858,872 3,11810 China 2,984,239 1,321,851,888 2,25811 Korea, oea,South 108,499 49,044,790 , 90 2,21212 Canada 70,122 33,390,141 2,10013 Romania 42,804 22,276,056 1,92214 Russia 263,721 141,377,752 1,86515 Japan 212,805 127,433,494 , 1,67016 Ukraine 73,640 46,299,862 1,59017 Turkey 102,322 71,158,647 1,43818 United Kingdom 64,402 60,776,238 1,06019 <strong>Thai</strong>land 39,078 65,068,149 60120 India 640,453 1,129,866,154 567Source: CIA World Fact book 2008 and Energy Information Administration (as of December 2008)17
Coal Fuel has the Best Cost Efficiency Ratio2,4002,0001,6001,2008004000Source: UMSComparative Heating Value (Baht/m Kcal)2,0451,5671,4641,269479 527555638435329 323 3602005 2006 2007 2008Fuel oil Natural Gas CoalKind of fuelHeatingValue(kcal)UnitPrice(Baht)Cost(Baht/kcal)BoilerEfficiency (%)Cost of steam(Baht/ton steam)Saving %vs CoalDiesel fuel 9,063 Litre 25.79 0.002846 85 2,140.25 77.02Bunker C oil 9,650 Litre 16.64 0.001725 85 1,297.14 62.09Coal 0‐50 mm 5,000 Kg 2.5 0.000500 65 491.77Source: Hamada Boiler Group18
Coal versus Fuel Oil Consumption in<strong>Thai</strong>landFuel Oil ConsumptionIndustry Coal ConsumptionMillion Litres8,000(ʹ000 tones)12,00011,2676,0004,0006,2055,851CAGR ‐11.6%4,2223,2732,76910,0008,0006,0004,885CAGR = 19.7%5,3566,4957,9839,0852,0004,0002,00002005 2006 2007 2008 2009F02003 2004 2005 2006 2007 2008Source: Energy Policy and Planning Officer, <strong>Thai</strong>landSource: Energy Policy and Planning Office, <strong>Thai</strong>land19
UMS’s Business Plans• UMS aims to be the leader of the domestic coal distributor business for theSMEs.• UMS’s corporate and social strategy is to communicate thoroughly andfrequently to the market about coal as a lower cost fuel option with much lessenvironmental impact than most people believe.• UMS plans to diversify further its risks by selling to several industries withoutdepending on any specific industry.UMS Aims tobe the Leaderof DomesticDistributorib t• UMS has and continues to differentiate its coals and services from othercompetitors by screening and improving the quality of coal to match each typeof boilers used in each industry and to provide after sales service as demanded.• UMS will not go into price war to enter into the larger industrial market.• UMS will utilise its coal powder to produce coal briquette that can be sold at ahigher margin.• UMS has policies to increase its coal suppliers to more than 5 in order tomitigate risk from reliance on one particular supplier.• UMS will continue to stabilise its cost of coals by having purchase contractsthat vary from spot, quarterly and yearly basis.20
UMS Remains as the Market Leader in theSMEs Sector 1Players Registered Capital Gross Margin Net Margin(M. Baht)1. Banpu Plc. 3,541 44.37% 20.90%2. Lanna Resources Plc. 350 39.18% 11.50%3. UMS 105 30.62% 12.31%4. SCT Co., Ltd. 400 21.56% 1.22%5. Asia Green Energy Plc. 140 16.94% 5.15%6. Energy Perfect Co., Ltd. 160 10.62% 2.43%7. Log Plus Mining Service Co., Ltd 3 6.57% 0.80%8. Sing Heng Seng Plc. 20 7.85% 1.27%9. Suvarnabhumi Lignite Co., Ltd 20 52.54% 3.14%10. Smart Global Energy Co., Ltd 1 9.35% (0.75%)11. Premthai Energy Limited 100 N.A N.ASource: BOL;Note 1 : Data as of 200821
HK000NDCTTA & UMS – The Perfect Matchfor Synergised Growth
TTA & UMS –A Perfect Match• This acquisition is in line with TTA’s approved medium‐term strategy todevelop and expand into niche logistic businesses.• TTA plans to maintain UMS as a niche coal trading and logistics businesswithout any changes to its business policies, expansion plans, financialstructure and key management.SynergyBenefits toTTA• Given that TTA believes that coal has a strong future, UMS’s sales andearnings should benefit from this rise. Thus, UMS is expected to be earningsaccretive to TTA’s bottom‐line.• UMS has invested significantly over the last 2 years to acquire necessary assetsand infrastructure such as land, warehouses, trucks, lighter vessels and jetties.These assets are expected to support UMS’s future volume growth of up to 3.7million tonnes per year. Thus, there will be minimal reliance in terms offinancing on TTA.• TTA has no intention to delist UMS. Thus, being a listed company, twobenefits: UMS’s future financing needs may be independent of TTA and it alsoacts as an economic currency for TTA• TTA plans to replicate UMS’s business model to other countries in the future.• UMS is an independent entity and will be run as a profit centre. TTA will notforce UMS to use other TTA units exclusively. TTA expects UMS and otherTTA units to compete fairly.23
TTA & UMS –A Perfect Match• UMS will be able to reap benefits from TTA’s expertise and experience incoal transportation especially for the routes between Indonesia and<strong>Thai</strong>land.• UMS should be able to increase revenues from its marine and landtransportation assets by leveraging upon TTA’s business network.• UMS will be able to make good use of TTA’s clients network to enlarge itscustomer base.SynergyBenefits toUMS• Although UMS has invested heavily in the past, it will be able to employTTA’s transportation and infrastructure assets in the future withoutadditional investments.• UMS’s financing capability will be well supported by TTA’s strongbalance sheet, thus ensuring lower financial costs for any futurefinancing.• UMS may benefit from TTA’s future expansion plan especially in thelogistic/infrastructure business.• UMS will be able to share TTA’s IT, ERP and other management systemsto control it business.24
Financial i HighlightshtHK000NDC
TTA’s Strong Balance Sheet to SupportExpansion PlansSummary of Key Financials as of 30 Jun 2009Solid Liquidity• Committed but undrawn facilities: US$ 442.73 millionKey Financial Covenants as at 30 Jun 2009Covenant ActualCash % of Assets Greater than 5% 27%US$ millions3202702201701207020338.8333.2313.4317.21.1242.5120%90%201.307 0.7159.1123.6138.90.560%0.6 110.1116 112.5 124.4730.530%40.30%2006 2007Cash Flow from Operations 2008 9M 2008 Cash Balance 9M 2009CapEx CapEx/CFOEBITDA to Debt Service Greater than 120% 581% Conservatively LeveragedTotal Shareholder Equityto Total AssetsGreater than 35% 64%20x 2.0x1.0x0.0x1.5x1.2x1.2x0.7x0.6x0.9xRatio of Total Debt toEBITDANot exceed 5:1 1.03:1‐1.0x‐0.3x‐0.7x2006 2007 2008 LTM 2009Total lDebt / EBITDANet tDebt bt/ EBITDANotes: For the above computation, the exact definitions in the loan agreements have been used.Notes:‐ Using the prevailing exchange rate of Bt 34.03 = US$1.00 quoted by the Bank of <strong>Thai</strong>land on 30 June 2009‐ LTM 2009: EBITDA calculated by combining 9M from FY2009 and 3M from FY 2008.‐ Total Debt and Net Debt values as of 30 June 200926
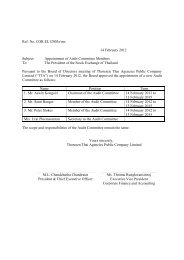
UMS’s Impressive ROE and ROASummary of Key Financials as of 30 Sep 2009• Return on Equity (ROE) and Return on Assets (ROA)were impressively above 40% and 20% respectively inthe past three years. However, both ratios dropped in9M 2009, due to negative impacts from the greateconomic crisis, relatively high shipping costs as well asthe huge assets investment made recently which is yet tobe fully utilised.• The fixed shipping contracts should expire by Q1 2010.The utilisation rate of the assets is currently at about50%. When the <strong>Thai</strong> economy recovers, UMS will bemore than prepared for the expansionary growth withvery minimal investment requirement in the next fewyears.80%60%40%20%0%201541%22%Impressive ROE and ROA63%31%53%20%30%10%2006 2007 2008 9M 2009Return on EquityReturn on AssetsCash Flows & Gearing Ratio9.51.0 8.4 1.117.921 2.1 19 1.914.62.012.5• Debt to Equity ratio rose to approximately 2.1x in 2008 10due to rising inventory and thus higher working capital 53.81.8 1.3requirement plus huge assets acquisition including0land, warehouses, trucks, lighter vessels and jetties. By ‐5‐1.5‐2.0the end of 2010, this ratio is expected to drop to around ‐10‐6.31x supported by about US$15 million cash receive fromthe capital injection of warrants.Cash Flow from OperationsCash Flow from Financing6.0 5.8 5.52006 2007 2008 9M 2008 9M 2009CapExDebt/Equity1.7Notes:‐ Using the prevailing exchange rate of Bt 33.55 = US$1..00 quoted by the Bank of <strong>Thai</strong>land on 30 September 200927
TTA’s Strong Financial PerformanceSummary of Key Financials(US$ millions) 2004 2005 2006 20072008INCOME STATEMENTOperating Revenue 307.3 437.5 470.1 598.2 1,010.7EBITDA 161.0 233.0 196.8 242.2 368.8Interest Expense 6.3 13.1 20.6 19.6 15.7Net Income 127.1 174.8 102.9 146.0 257.9EPS (US cents) 20.3 27.2 16.0 22.7 40.1BALANCE SHEETCash and Cash at Banks 78.0 49.9 40.3 110.1 338.8Total Assets 463.3 572.1 680.0 827.0 1,238.4Total Debt 227.3 255.1 263.4 266.7 237.1Net Debt 142.1 188.7 215.8 147.8 (115.3)Total Liabilities 266.6 303.4 326.7 355.3 379.9Total Shareholder’s Equity 196.0 267.4 328.7 445.3 735.3CASH FLOW STATEMENTCFO 152.7 206.4 123.6 201.3 333.2CapEx 225.4 158.4 73.0 138.9 159.1Cash Dividends 28.1 104.0 40.7 27.1 45.49M 2008719.3279.411.7197.727.9313.41,134.3231.1(110.1)341.7673.8242.5116.045.49M 2009459.8117.28.539.65.6317.21,189.3188.9(154.5)285.1763.8112.5124.414.2Note: Using the exchange rate of Bt 34.03 = US$1.00 quoted by the Bank of <strong>Thai</strong>land as of 30 June 200928
UMS’s Solid Financial PerformanceSummary of Key Financials(US$ millions) 2004 2005 2006 20072008INCOME STATEMENTOperating Revenue 28.7 33.6 40.9 73.6 102.1EBITDA 6.2 6.8 7.5 14.8 18.7Interest Expense 0.1 0.2 0.5 0.71.3Net Income 4.0 4.9 5.2 10.8 12.0Basic EPS (US cents) 2.6 3.2 3.4 7.17.99M 200874.516.30.811.77.79M 200958.810.31.46.24.1Fully diluted EPS (US cents) 1.9 2.3 2.5 5.1 5.75.6 3.0BALANCE SHEETCash and Cash at Banks 3.5 2.5 1.5 4.25.4Total Assets 12.7 21.6 25.6 43.5 76.1Total Debt 1.0 8.0 10.7 17.0 45.9Net Debt (2.5) 5.5 9.2 12.8 40.5Total Liabilities 2.4 9.5 12.5 22.7 51.5Total Shareholder’s h Equity 10.3 12.1 13.1 20.8 24.6CASH FLOW STATEMENTCFO 2.2 (3.1) 1.8 9.1(2.0)CapEx 0.7 3.0 1.3 9.514.6Cash Dividends ‐ 3.1 4.2 3.111.0Note: Using the exchange rate of Bt 33.55 = US$1.00 quoted by the Bank of <strong>Thai</strong>land as of 30 September 2009293.569.434.030.545.124.26.012.511.02.989.054.151.259.530.4(6.3)1.71.1
HK000NDCQ &A
HK000NDCAppendix