DENTAL - NHS Business Services Authority
DENTAL - NHS Business Services Authority
DENTAL - NHS Business Services Authority
- No tags were found...

Create successful ePaper yourself
Turn your PDF publications into a flip-book with our unique Google optimized e-Paper software.
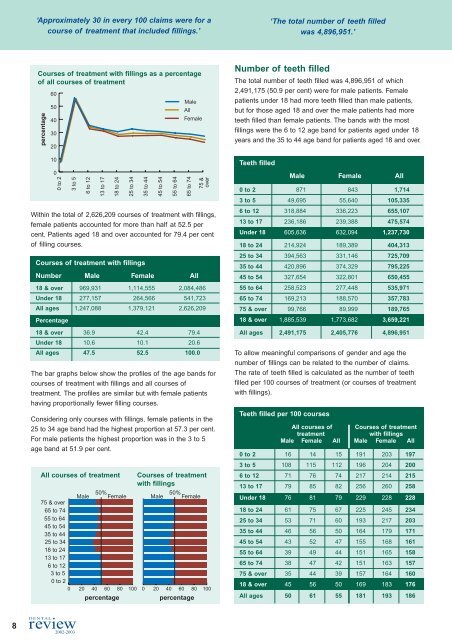
‘Approximately 30 in every 100 claims were for acourse of treatment that included fillings.’‘The total number of teeth filledwas 4,896,951.’Courses of treatment with fillings as a percentageof all courses of treatmentpercentage60504030201000 to 23 to 56 to 1213 to 1718 to 24Within the total of 2,626,209 courses of treatment with fillings,female patients accounted for more than half at 52.5 percent. Patients aged 18 and over accounted for 79.4 per centof filling courses.The bar graphs below show the profiles of the age bands forcourses of treatment with fillings and all courses oftreatment. The profiles are similar but with female patientshaving proportionally fewer filling courses.Considering only courses with fillings, female patients in the25 to 34 age band had the highest proportion at 57.3 per cent.For male patients the highest proportion was in the 3 to 5age band at 51.9 per cent.25 to 34Courses of treatment with fillings35 to 4445 to 5455 to 64MaleAllFemaleNumber Male Female All65 to 7475 &over18 & over 969,931 1,114,555 2,084,486Under 18 277,157 264,566 541,723All ages 1,247,088 1,379,121 2,626,209Percentage18 & over ,36.9 42.4 79.4Under 18 10.6 10.1 20.6All ages 47.5 52.5 100.0All courses of treatment75 & over65 to 7455 to 6445 to 5435 to 4425 to 3418 to 2413 to 176 to 123 to 50 to 2Male50% FemalepercentageCourses of treatmentwith fillingsMale50% Female0 20 40 60 80 100 0 20 40 60 80 100percentageNumber of teeth filledThe total number of teeth filled was 4,896,951 of which2,491,175 (50.9 per cent) were for male patients. Femalepatients under 18 had more teeth filled than male patients,but for those aged 18 and over the male patients had moreteeth filled than female patients. The bands with the mostfillings were the 6 to 12 age band for patients aged under 18years and the 35 to 44 age band for patients aged 18 and over.Teeth filledMale Female All0 to 2 871 843 1,7143 to 5 49,695 55,640 105,3356 to 12 318,884 336,223 655,10713 to 17 236,186 239,388 475,574Under 18 605,636 632,094 1,237,73018 to 24 ,214,924 189,389 404,31325 to 34 394,563 331,146 725,70935 to 44 420,896 374,329 795,22545 to 54 327,654 322,801 650,45555 to 64 258,523 277,448 535,97165 to 74 169,213 188,570 357,78375 & over 99,766 89,999 189,76518 & over 1,885,539 1,773,682 3,659,221All ages 2,491,175 2,405,776 4,896,951To allow meaningful comparisons of gender and age thenumber of fillings can be related to the number of claims.The rate of teeth filled is calculated as the number of teethfilled per 100 courses of treatment (or courses of treatmentwith fillings).Teeth filled per 100 coursesAll courses of Courses of treatmenttreatmentwith fillingsMale Female All Male Female All0 to 2 16 14 15 191 203 1973 to 5 108 115 112 196 204 2006 to 12 71 76 74 217 214 21513 to 17 79 85 82 256 260 258Under 18 76 81 79 229 228 22818 to 24 ,61 75 67 225 245 23425 to 34 53 71 60 193 217 20335 to 44 46 56 50 164 179 17145 to 54 43 52 47 155 168 16155 to 64 39 49 44 151 165 15865 to 74 38 47 42 151 163 15775 & over 35 44 39 157 164 16018 & over 45 56 50 169 183 176All ages 50 61 55 181 193 186<strong>DENTAL</strong>8 review2002-2003